

LLM (large language model) Visibility for SaaS means measuring and improving how your software brand appears inside AI-generated answers. LLM visibility for SaaS impacts brand discovery, sentiment in AI recommendations, and the ability to protect or grow share of voice in competitive software categories.
The Search Atlas LLM Visibility tool helps SaaS companies stay visible in AI-powered search. In this overview, you will see real use cases of SaaS brands inside AI results and how LLM insights translate into visibility growth.

What is LLM Visibility?
LLM visibility is the measurement of how often and in what context a brand is mentioned inside answers generated by large language models such as ChatGPT, Gemini, Perplexity, and Claude.
The Search Atlas LLM Visibility tool is an analytics platform that tracks these brand mentions across LLMs, classifies sentiment, and measures placement in AI-generated answers. It delivers visibility scores, competitor benchmarks, and share of voice insights inside a single dashboard.
In the SaaS context, the Search Atlas LLM Visibility tool shows how software brands appear in AI responses. It links these appearances to visibility scores and competitor benchmarks, showing if a company is cited first, listed last, or skipped entirely.
How Does LLM Visibility Work?
The Search Atlas LLM Visibility tool connects your brand to real-time AI search results. You begin by adding your SaaS brand, competitors, and website inside the dashboard. Then you select which AI models to monitor including ChatGPT, Gemini, Perplexity and Claude.
Once the setup is complete, the Search Atlas LLM Visibility tool will scan AI-generated answers for your brand. You see every place your company is mentioned, whether it appears first, last, or not at all, and whether the tone is positive, neutral, or negative.
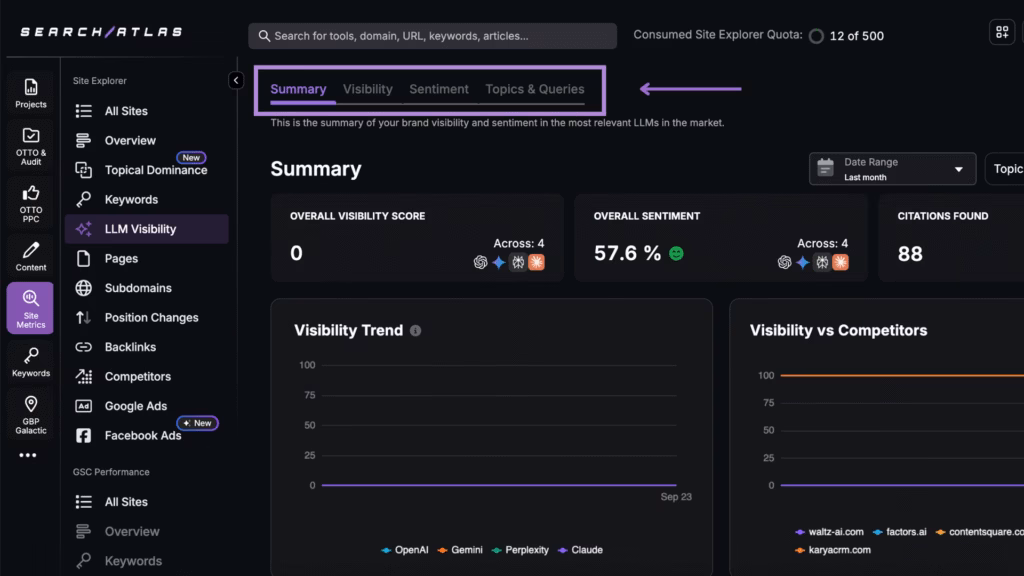
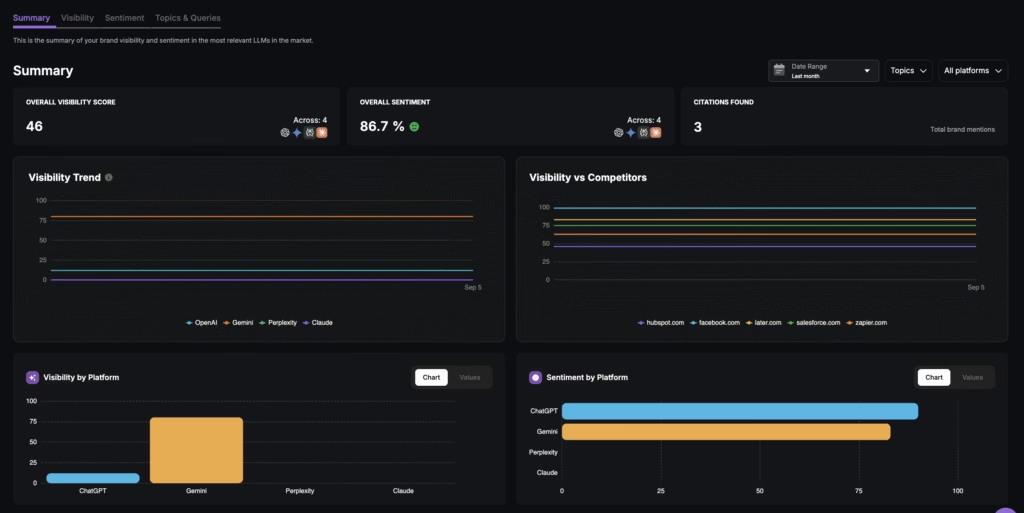
The results appear in a live dashboard with 4 tabs called Summary, Visibility, Sentiment and Topics & Queries. These tabs display visibility scores, share of voice, sentiment patterns and the exact queries that trigger mentions of your brand.
From there, compare performance against competitors, track how results shift over time and apply recommendations. The tool is able to flag reputation risks and provides optimization opportunities to strengthen your SaaS brand presence in future AI responses.
Why Does It Matter for SaaS?
LLM visibility reshapes how SaaS brands are discoverable and trusted when buyers use AI-powered assistants to evaluate vendors, compare pricing, and choose solutions.
The 4 reasons this matters for SaaS companies are listed below.
- Driving software discovery in AI research journeys. LLM Visibility shows how often and in what context your platform is mentioned when prospects explore category options and compare providers.
- Protecting the share of voice in crowded markets. The rise of AI assistants creates a new discovery channel where benchmarks reveal whether competitors dominate mentions. This insight opens opportunities to increase in SaaS categories.
- Identifying misinformation and crisis risks. AI responses sometimes generate false claims about integrations, pricing tiers, or security. Continuous monitoring prevents misinformation from damaging sales conversations and stops negative sentiment from escalating.
- Turning AI visibility into revenue growth. LLM Visibility shows which queries surface your brand, how competitors rank, and how sentiment shapes perception. These insights guide content updates, positioning refinements, and PR campaigns that convert visibility into measurable pipeline impact.
What Are the Top Use Cases of LLM Visibility for SaaS?
LLM visibility for SaaS encompasses all the ways software brands are measured, compared, and positioned inside AI-generated answers. These insights determine whether buyers discover your product, trust your reputation, and consider you against competitors during AI-driven research.
The top use cases for SaaS are listed below.
How Can I Track Software Discovery in AI-driven Research Journeys?
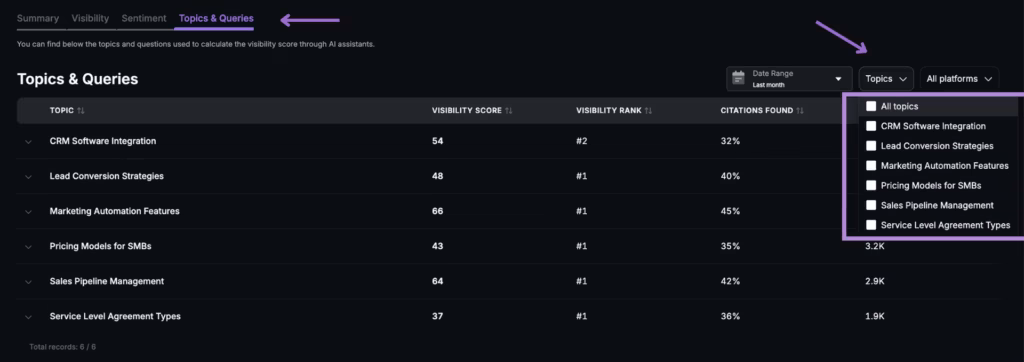
To track software discovery in AI-driven research, use the Topics & Queries dashboard to review which SaaS platforms appear in LLM answers to commercial queries such as “best project management software for startups” or “best CRM AI Analytics platforms for all-in-one marketing automation”.
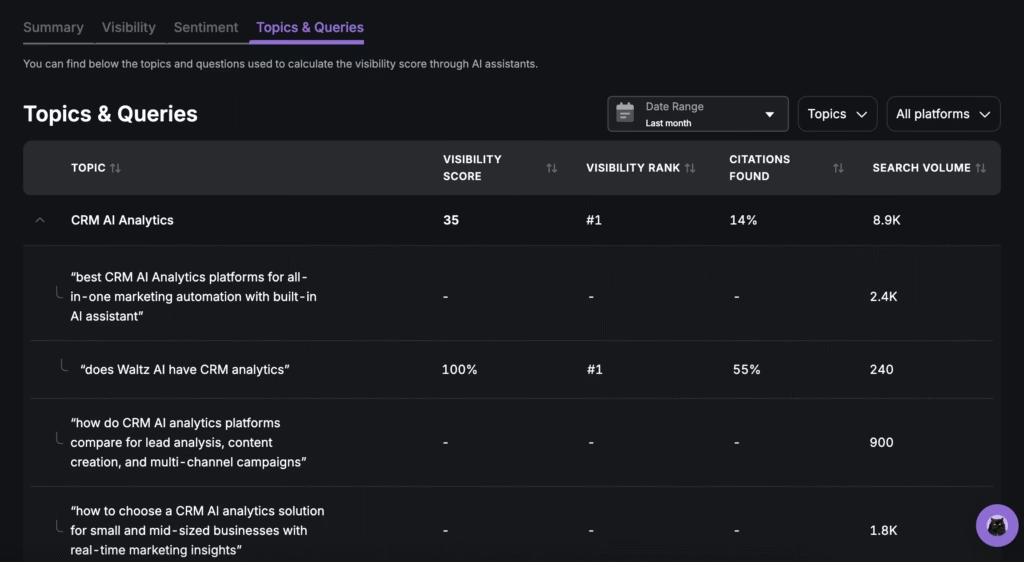
Check results by platform and timeframe to see if your brand is surfaced, how often, and in what share of voice. Monitor changes in mentions after publishing comparison content, updating solution pages, or announcing new features to validate whether your SaaS is discovered in real AI research journeys.
How Do I See if My SaaS Brand is Included When Buyers Compare Vendors in AI Answers?
To check if your SaaS brand appears in vendor comparisons, use the Visibility dashboard to analyze placement within AI-generated lists. This shows whether your brand is cited first, last, or skipped entirely in responses to buyer searches like “top CRMs for small businesses”.
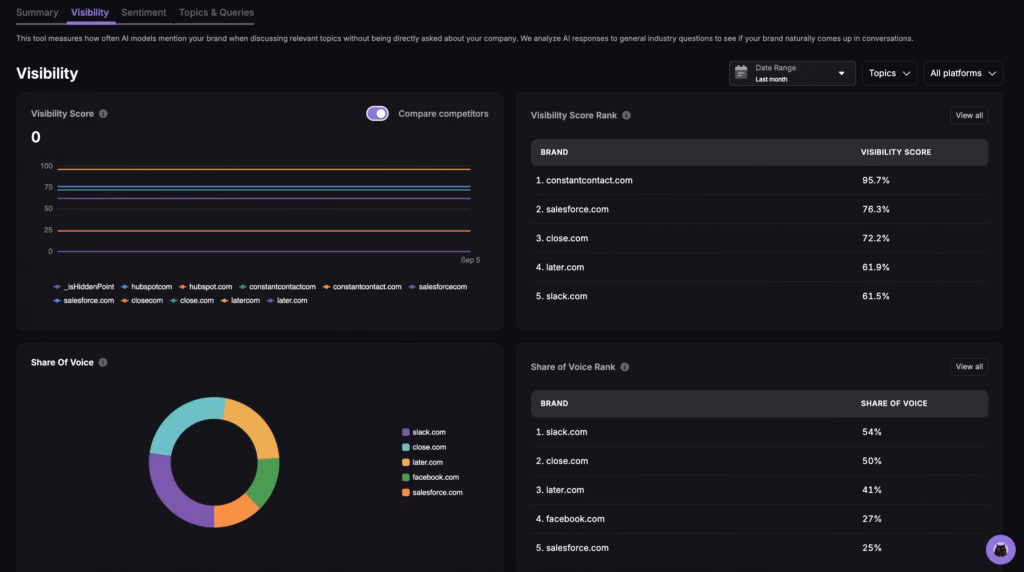
The dashboard displays side-by-side brand rankings, visibility scores, and share of voice. Filters by platform and query type reveal whether you appear in generic comparisons or only in niche prompts.
How Do I Track My Share of Voice Against Category Leaders in LLM Responses?
To measure share of voice against category leaders, use the Summary and Visibility dashboards together. These dashboards calculate the percentage of AI-generated answers that mention your SaaS compared with competitors.
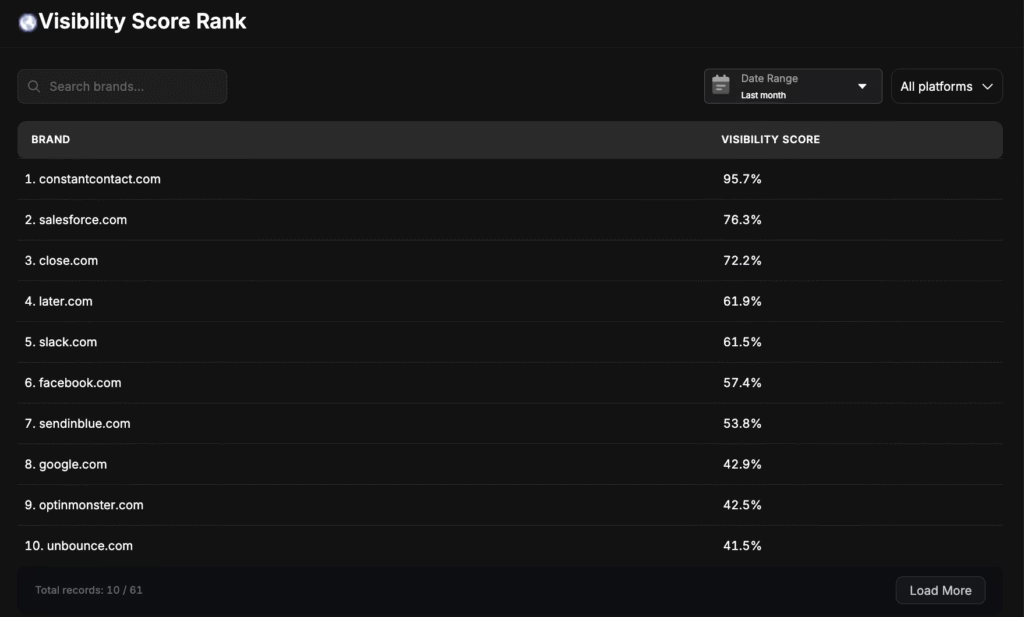
The Visibility Score Rank lists who dominates brand exposure, while share of voice charts show which vendors control the largest percentage of mentions. Use filters to analyze by platform, date range, or vertical to pinpoint where leaders outperform you. Track movements over time to see whether campaigns or PR pushes help close the gap.
How Do I Benchmark Against Direct Competitors in My Category?
To benchmark against competitors, use the Visibility and Topics & Queries dashboards to see which brands dominate generative answers and which fall behind. You view direct comparison tables that highlight frequency, sentiment distribution, and citation sources across AI platforms.

Filter for topic-specific queries such as “CRM automation platforms” or “enterprise HR software” to isolate where competitors outperform you. Combine citation data with sentiment scores to reveal not only who wins visibility, but why.
This transforms competitive benchmarking from static SEO monitoring into real-time, actionable insight for AI-driven SaaS research.
How Can I Evaluate Whether AI Tools Describe My Company Positively or Negatively?
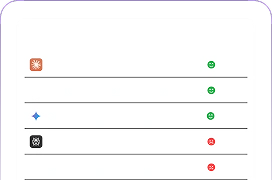
To evaluate whether AI tools describe your company positively or negatively, drill into the Sentiment dashboard for descriptor-level analysis. The Sentiment dashboard measures how positively or negatively LLMs describe your brand and products.
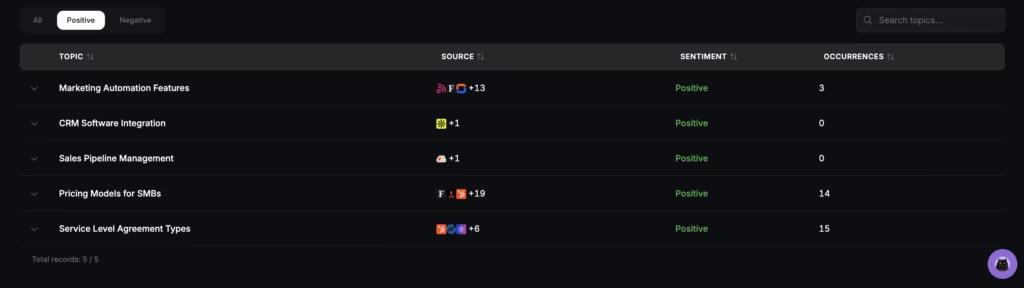
It groups mentions into topics and assigns sentiment, showing whether attributes like features, pricing, or integrations are framed positively or negatively. This evaluation shows how LLMs interpret your positioning compared to competitors.
How Do I Monitor Misinformation and Potential Crises in AI Answers?
To monitor misinformation and crises, review the Sentiment and Topics dashboards for negative mentions or inaccuracies. Look for spikes in unfavorable sentiment or incorrect claims about your pricing, onboarding, or security features.
Citation tracking highlights the external sources that fuel inaccurate AI responses. Once identified, update technical documentation, issue clarifications, or coordinate with PR teams to correct the record. Early crisis detection enables SaaS companies to protect brand trust before misinformation spreads across platforms.
How Do I Protect Onboarding Clarity and Pricing Accuracy in AI Recommendations?
To protect onboarding clarity and pricing accuracy, monitor the Topics & Queries dashboard for how LLMs describe your plans, free trials, and setup process. Check whether assistants explain your model as “freemium”, “per seat”, or “enterprise license” and whether those details match your actual offers.
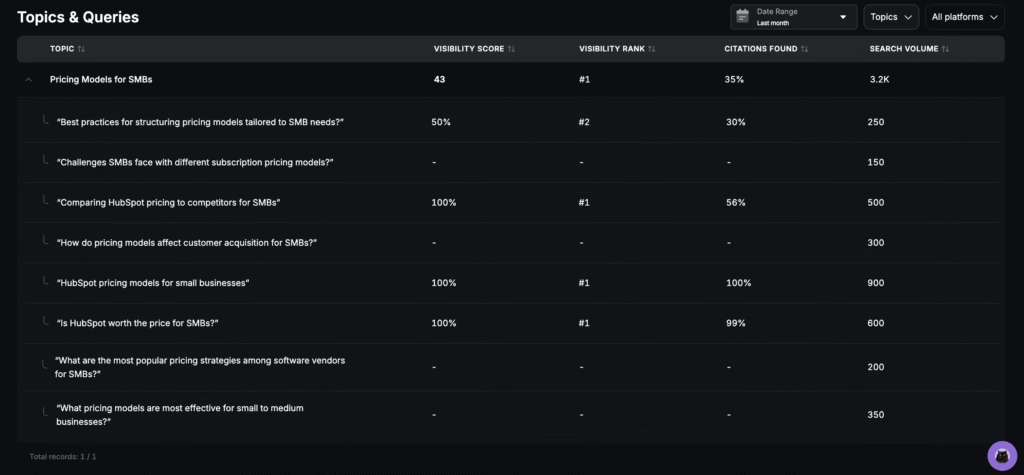
AI answers that present outdated or misleading details require updates to pricing pages, onboarding guides, and FAQ content with structured data and schema. Track improvements in subsequent dashboard scans to confirm accurate representation. Clarity at this stage prevents churn and increases trial-to-paid conversion.
How Do I Detect Gaps Where My Integrations or Ecosystem Partnerships are Missing?
To detect gaps in integration or ecosystem mentions, use the Topics & Queries dashboard to track whether LLMs reference your partnerships with tools like Salesforce, Slack, or Zapier. If these integrations are absent from AI answers, it signals missing alignment between your content and AI training data.
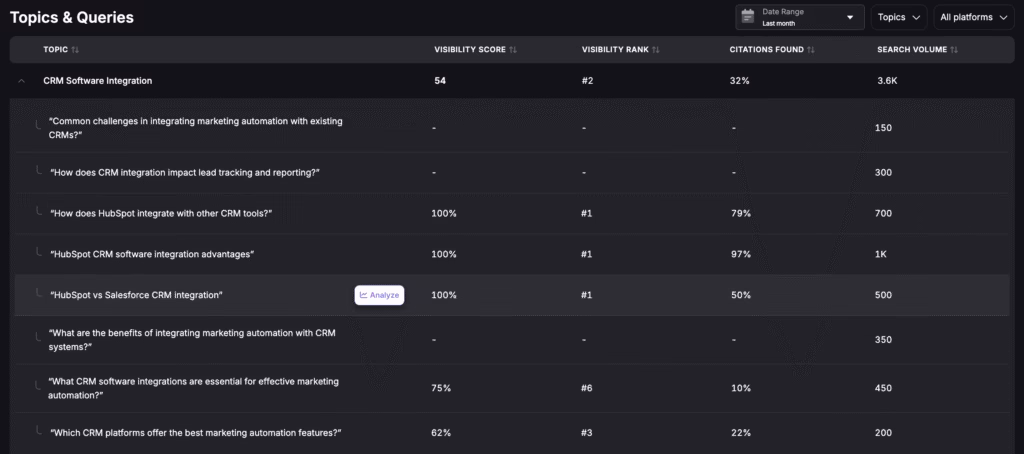
Review citation sources to see which competitor partnerships are being highlighted instead. Update integration pages, publish co-marketing content, and reinforce schema markup to ensure AI platforms recognize your ecosystem. This helps strengthen positioning as a connected, enterprise-ready solution.
How Can I Measure Whether Funding Rounds, Partnerships, or Awards Increase Brand Visibility?
To measure the impact of milestones like funding rounds or industry awards, use the Summary and Visibility dashboards to track shifts in AI mentions after announcements. Compare visibility scores and sentiment before and after events to see if recognition translates into stronger AI presence.
Historical charts highlight whether mentions spike temporarily or sustain long-term. Positive sentiment associated with awards or partnerships reinforces credibility, while absent mentions suggest under-leveraged PR. This measurement validates whether high-profile milestones improve brand awareness in AI-driven research.
How Do I Use Historical Trend Data to Prove Brand Visibility Gains Over Time?
To prove visibility gains, review the Summary dashboard for historical charts that track brand mentions, sentiment, and share of voice across AI platforms. Filter by data range to measure changes after campaigns, content updates, or feature launches.
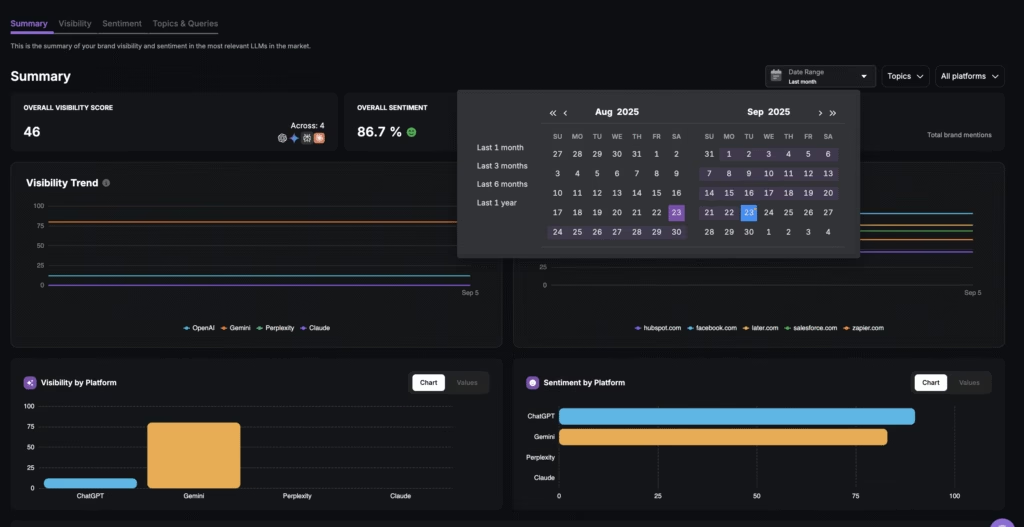
Trends reveal whether improvements are sustained, seasonal, or event-driven. Export reports to connect visibility growth with pipeline outcomes and demonstrate ROI to leadership. Historical data transforms AI visibility tracking into measurable, long-term brand performance reporting.
What Is an Example Scenario in SaaS?
An example scenario illustrates how the Search Atlas LLM Visibility tool transforms AI-driven research into actionable steps for SaaS optimization.
Scenario Description
A prospect submits the query “What is the best SaaS for team collaboration under $50 per month?” to 3 major language models.
- ChatGPT lists Competitor A.
- Gemini mentions your SaaS plus Competitor B.
- Perplexity only recommends Competitor B.
Dashboard Findings
LLM Visibility aggregates 3 results and presents clear metrics as listed below.
- Share of Voice. Your brand appears in 1 out of 3 LLMs for this query, showing 33 percent visibility.
- Sentiment. Gemini describes your platform positively on features but highlights negative perceptions on pricing.
- Competitor Benchmark. Historical trend charts reveal Competitor B dominates mentions for affordability-related queries in the collaboration software space.
Data Interpretation
The insights reveal weak coverage and mixed framing in AI-generated answers. The omission in Perplexity signals a lack of alignment between your pricing positioning and affordability queries. Competitor B consistently outperforms by owning budget-conscious messaging across LLM responses.
Remediation Actions
The direct actions to improve your LLM visibility based on findings are listed below.
- Optimize your pricing page to highlight affordability and value-for-money positioning.
- Publish case studies that showcase real customers using your platform at under $50 per month.
- Expand comparison content that frames your solution against Competitor B with clear pricing advantages.
- Monitor shifts in sentiment and share of voice as updated content and proof points enter AI recommendations.
This scenario illustrates a closed-loop process. Firstly, you identify coverage and positioning weaknesses. Secondly, you implement targeted improvements. Thirdly, you measure progress directly inside the Search Atlas LLM Visibility dashboards to secure stronger placement in AI-driven SaaS discovery.
Use the Search Atlas LLM Visibility tool to quantify your AI presence, benchmark against SaaS leaders, and convert insights into measurable pipeline growth. Start your free trial today!