

The evaluation of Whatagraph alternatives highlights a fragmented market of 30+ reporting platforms, where most tools compete on connector count, pricing tiers, and dashboard customization rather than actual marketing execution. Platforms such as Looker Studio offer a free reporting layer with 800+ integrations and anomaly detection capabilities, while Coupler.io provides 390+ integrations and a lower entry price of $24/month. Supermetrics and Funnel.io focus on data pipeline infrastructure with 150+ and 500+ connectors respectively, targeting teams that require complex cross-platform reporting and data transformation. These platforms expand reporting visibility, but they largely remain passive analytics layers that aggregate marketing data without improving campaign performance or implementing optimization tasks.
User migration away from Whatagraph is therefore driven not only by pricing, often exceeding $229–$400 per month for agencies, but by structural limitations in the reporting-only model. Alternatives such as Databox, DashThis, and Klipfolio provide 100+ connectors, AI-assisted goal tracking, or SQL-based customization, yet they still focus primarily on visualization and reporting automation. Even lower-cost options like ReportGarden, Dataslayer, and Windsor.ai expand connector libraries or warehouse integrations, but they do not extend beyond data aggregation and dashboard reporting.
Search Atlas stands out as the strongest Whatagraph alternative because it shifts the platform category from reporting to execution. Rather than simply visualizing marketing performance, Search Atlas integrates reporting with AI-driven optimization through tools such as OTTO SEO, Content Genius, and real-time site auditing. Starting at $99/month, the platform replaces reporting-only workflows with automated SEO implementation, internal linking improvements, content optimization, and technical fixes. This execution-focused model directly addresses the core limitation of Whatagraph and most alternatives: they show marketers what is happening but do not actually improve results.
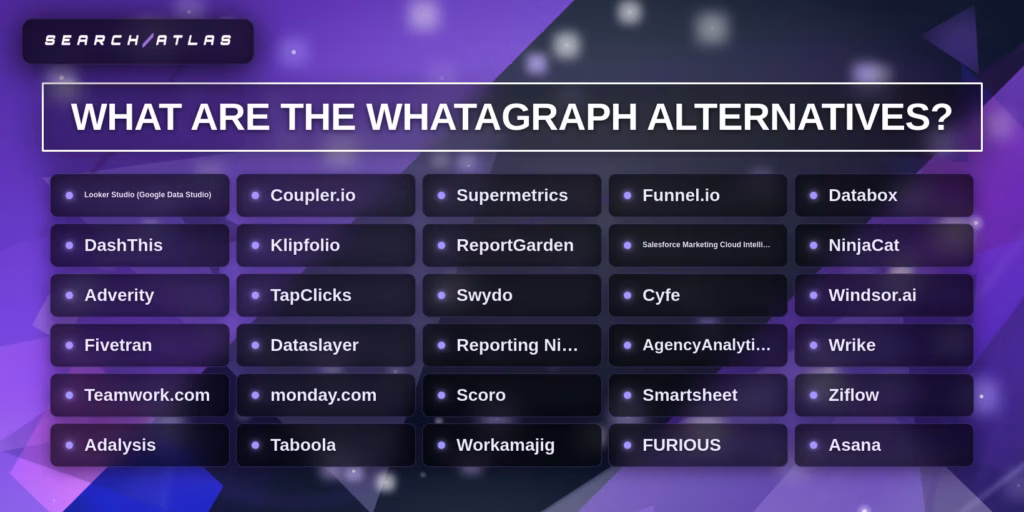
What are the Whatagraph Alternatives?
The Whatagraph alternatives include:
- Search Atlas (All-in-one SEO Platform)
- Looker Studio (Google Data Studio) (Reporting Tool)
- Coupler.io (Data Integration and Reporting Tool)
- Supermetrics (Data Integration Tool)
- Funnel.io (Marketing Data Platform)
- Databox (Reporting and Analytics Tool)
- DashThis (Reporting Tool)
- Klipfolio (Business Intelligence Dashboard)
- ReportGarden (Reporting Tool)
- Salesforce Marketing Cloud Intelligence (Datorama) (Marketing Intelligence Platform)
- NinjaCat (Reporting and Analytics Platform)
- Adverity (Data Integration Platform)
- TapClicks (Data Platform)
- Swydo (Reporting Tool)
- Cyfe (Dashboard Tool)
- Windsor.ai (Data Integration Solution)
- Fivetran (ELT Solution)
- Dataslayer (Data Integration Tool)
- Reporting Ninja (Reporting Tool)
- AgencyAnalytics (Reporting and Analytics Platform)
- Wrike (Project Management Software)
- Teamwork.com (Project Management Software)
- monday.com (Work Management Platform)
- Scoro (Work Management Software)
- Smartsheet (Work Management Platform)
- Ziflow (Creative Workflow Management)
- Adalysis (PPC Management Tool)
- Taboola (Content Discovery Platform)
- Workamajig (Project Management Software)
- FURIOUS (Marketing Management Platform)
- Asana (Work Management Platform)
1. Search Atlas
Search Atlas is a Whatagraph alternative because it combines reporting with SEO execution rather than dashboards alone, integrates live SEO data sources alongside marketing analytics, provides automated optimization through AI agents, includes full technical and on-page SEO monitoring within reports, and offers a more cost-efficient pricing model starting at $99/month without connector credit limits.
How does Search Atlas’s execution-first model make it an alternative? Search Atlas extends beyond reporting by executing SEO improvements directly inside the platform. Whatagraph focuses primarily on marketing dashboards and data visualization, which require marketers to manually implement fixes after reviewing reports. Search Atlas integrates automation through OTTO SEO, which deploys schema fixes, internal linking updates, and technical optimizations. This execution layer converts reporting insights into implemented improvements rather than static analytics.
Why do Search Atlas’s data integrations provide a stronger alternative? Search Atlas integrates live marketing and SEO data sources such as Google Analytics 4 (GA4), Google Search Console (GSC), Google Business Profile (GBP), and built-in keyword rank tracking within the reporting environment. Whatagraph aggregates marketing platform data through connectors but relies on external SEO tools for rank monitoring or technical analysis. Search Atlas centralizes reporting and SEO performance tracking inside one system, which eliminates tool fragmentation for agencies and marketing teams.
What makes Search Atlas reporting capabilities more advanced? Search Atlas delivers executive keyword growth reporting, device-level performance analysis, rank volatility monitoring, backlink tracking, and ad ROI reporting within a unified dashboard. The platform also includes the Portfolio Summary dashboard, which categorizes accounts into wins, stable, and at-risk segments to help agencies prioritize work. Whatagraph provides customizable dashboards but focuses on visual reporting rather than operational performance monitoring tied to SEO metrics.
How does Search Atlas automation provide an alternative to reporting-only tools? Search Atlas introduces OTTO SEO automation that implements technical fixes such as Core Web Vitals improvements, schema updates, and internal linking optimization. Whatagraph reports marketing metrics but does not execute technical or on-page SEO changes. This automation reduces manual optimization work and turns reporting insights into active performance improvements.
Why is Search Atlas pricing a compelling alternative? Search Atlas offers transparent pricing starting at $99/month, scaling to $199/month for Growth and $499/month for Pro, with unlimited dashboards and core reporting capabilities included in every plan. Whatagraph pricing starts around $229/month and increases with connector credits and reporting scale. The lower entry cost combined with integrated SEO execution tools allows agencies to replace multiple tools while reducing monthly software expenses.
2. Looker Studio (Google Data Studio)
Looker Studio is a Whatagraph alternative because it offers a free base product with unlimited dashboards, provides significantly more data integrations (800+ vs. Whatagraph’s 50-200+), includes advanced data transformation capabilities via SQL and calculated fields, features highly customizable drag-and-drop reports, integrates seamlessly with the Google ecosystem, and offers AI-powered anomaly detection and predictive analytics.
How does Looker Studio’s cost structure make it an alternative? Looker Studio’s base product is free, offering unlimited dashboards and native Google tool integration. This makes it attractive to startups, small teams, and agencies, especially when compared to Whatagraph’s paid plans starting at $229/month. While Looker Studio’s non-Google data sources may incur third-party connector costs (e.g., $200/month for 5 clients), its initial zero cost for Google data reporting positions it as a viable alternative for budget-conscious users.
Why are Looker Studio’s integrations a key differentiator? Looker Studio connects to 800+ data sources, including 24 free Google Connectors and 1,188 Partner Connectors. This vastly exceeds Whatagraph’s 50-200+ integrations. While many of Looker Studio’s non-Google integrations require additional fees for third-party connectors, the sheer breadth of connectivity allows users to consolidate data from a wider array of platforms, including Google Ads, YouTube, and BigQuery.
What advanced data capabilities does Looker Studio offer? Looker Studio provides advanced data manipulation through SQL and calculated fields, supporting complex analytics like dynamic date ranges and blending multiple data sources. This contrasts with Whatagraph’s more limited data transformation options. Looker Studio’s ability to perform data cleaning and transformation (though not ideal within the tool itself) and its support for complex logic make it suitable for more sophisticated data analysis.
How do Looker Studio’s visualization options compare? Looker Studio offers highly customizable drag-and-drop reports and interactive dashboards with rich visualization options, including customizable templates. This allows users to create bespoke reports tailored to specific needs. While Whatagraph focuses on pre-built dashboards, Looker Studio’s flexibility in visualization provides greater control over report design and presentation.
Why is Google ecosystem integration important for Looker Studio? Looker Studio works exceptionally well with Google Sheets, Ads, GA4, and BigQuery, making it the best option for Google ecosystem integrations. This seamless compatibility allows users to leverage their existing Google data infrastructure efficiently. Its strong demand in 2025 and 2026 for marketing and e-commerce reporting is partly due to its compatibility with the Google stack.
What AI capabilities does Looker Studio provide? Looker Studio includes AI-powered anomaly detection and predictive analytics. It also features Gemini in Preview, indicating future advanced AI integration. This offers more sophisticated analytical capabilities compared to Whatagraph’s AI Chatbot (beta) for data-related questions, providing users with deeper insights and foresight into their data.
3. Coupler.io
Coupler.io is a Whatagraph alternative because it offers a broader data ecosystem beyond marketing, integrates with significantly more data sources (390+ vs. 50+), provides more flexible data destinations including BI tools and databases, features a comprehensive in-app transformation suite with no-code ETL, and presents a more affordable and transparent pricing model starting at $24/month compared to Whatagraph’s $229/month.
How does Coupler.io’s broader data ecosystem make it an alternative? Coupler.io extends beyond marketing and finance into operations, product, and accounting, covering a cross-department data ecosystem. Whatagraph primarily focuses on marketing analytics for agencies, integrating mainly with marketing platforms. This wider scope allows Coupler.io to serve a more diverse range of business functions, making it suitable for companies needing a full reporting and analytics platform across various departments.
Why do Coupler.io’s data sources offer a stronger alternative? Coupler.io connects to 390+ (or 700+) data integrations, including ad platforms, CRMs, SEO tools, and accounting software, with all sources available on every plan. In contrast, Whatagraph integrates with 50+ marketing platforms. This vast difference in integration breadth means Coupler.io can centralize data from a much larger and more varied set of business tools, providing a more complete data picture.
What makes Coupler.io’s data destinations more flexible? Coupler.io allows exporting data to a wide range of destinations such as spreadsheets (Google Sheets, Excel), BI tools (Looker Studio, Power BI, Tableau), databases (BigQuery, PostgreSQL), and AI agents (Claude, ChatGPT). Whatagraph’s destination options are more limited, primarily to Looker Studio, Google Sheets, or BigQuery. This broader destination flexibility enables users to leverage their data in diverse analytical and operational environments.
How does Coupler.io’s transformation suite provide an alternative? Coupler.io offers a complete in-app transformation suite including column management, filtering, sorting, custom calculations, aggregation (sum, avg., count), and no-code ETL for data blending. Whatagraph provides basic transformation and metric harmonization with custom formulas. Coupler.io’s advanced capabilities allow for more complex data preparation and manipulation directly within the platform, reducing the need for external tools.
Why is Coupler.io’s pricing model a compelling alternative? Coupler.io offers clear, published pricing with a free plan and paid plans starting at $24/month, with all sources and destinations included. Whatagraph uses a source-credit pricing model, with paid plans starting at $229/month (billed annually) for 20 source credits, scaling with additional credits. This significant difference in starting price and pricing transparency makes Coupler.io a more affordable and accessible option, especially for SMBs.
4. Supermetrics
Supermetrics is a Whatagraph alternative because it offers a broader range of 150+ connectors compared to Whatagraph’s offerings, provides users with full data ownership and control over 15 destinations, supports advanced data transformation capabilities for complex analytics, is suitable for small to medium-sized businesses and agencies, and maintains SOC 2 Type II and GDPR compliance for data security.
How does Supermetrics’ connector breadth make it an alternative? Supermetrics provides over 150 connectors, including unique integrations for platforms like Amazon DSP, Google Ads Keyword Planner, Lazada, Shopee, Google Play Console, and Google Merchant Center, which Whatagraph lacks. This extensive coverage across nine categories, including paid advertising, social media, and ecommerce, allows for complex, global setups, making it a robust choice for diverse marketing and sales channels.
Why is full data ownership a significant factor? Supermetrics allows users to send data to 15 different destinations, including Excel, Google Sheets, Looker Studio, Power BI, and various data warehouses like Google BigQuery and Snowflake. This flexibility ensures users have complete control and ownership of their marketing data, enabling them to integrate it into their existing BI tools and data infrastructure without vendor lock-in.
What role do data transformation capabilities play? Supermetrics supports advanced transformations, data blending, and enterprise use cases such as Marketing Mix Modeling (MMM) and attribution. It offers no-code transformation features, including Custom Fields for lookups and conditional lookups, and allows data blending from multiple sources. This enables users to manipulate and harmonize data within the reporting tool, applying filters, calculations, and formulas for deeper insights.
How does Supermetrics’ target audience position it as an alternative? Supermetrics is ideal for small and medium-sized businesses, solopreneurs, freelancers, and marketing agencies that require access to multiple data sources and analytical tools. Its cost-effectiveness for Google Sheets integration, starting at $29/month, paired with free visualization tools like Looker Studio, makes it an accessible option for users with established reporting stacks.
Why is security and compliance important for an alternative? Supermetrics is SOC 2 Type II, GDPR, and CCPA compliant, ensuring that user data is handled securely and in accordance with major privacy regulations. This compliance allows organizations to enforce internal governance and access control as data flows to their controlled destinations, providing a secure and trustworthy data pipeline solution.
5. Funnel.io
Funnel.io is a Whatagraph alternative because it offers superior data transformation capabilities, provides broader data coverage with over 500 connectors, supports advanced analytics like marketing mix modeling, ensures centralized data aggregation for a single source of truth, demonstrates higher reliability in API connections, and is designed for complex multi-client data needs and scaling agencies.
How does Funnel.io’s data transformation contribute to its alternative status? Funnel.io cleans, maps, and standardizes marketing data before visualization, ensuring dashboards reflect accurate, actionable insights. It automatically handles conversions such as currency adjustments and metric alignment, a critical feature for consistent reporting across diverse data sources.
Why is broader data coverage a key differentiator for Funnel.io? Funnel.io offers “far broader data coverage” with “500+ always-maintained connectors (plus custom connectors built in-house),” allowing it to unify “virtually every marketing source.” This extensive integration capability surpasses alternatives by providing comprehensive data access.
What makes Funnel.io’s advanced analytics capabilities significant? Funnel.io supports advanced measurement tools like marketing mix modeling (MMM) and custom data modeling. This functionality enables deeper insights and more sophisticated analysis compared to platforms focused primarily on visual reporting.
How does centralized data aggregation position Funnel.io as an alternative? Funnel.io provides a “single source of truth to analyze, report and share insights securely.” This centralized approach ensures data consistency and integrity, which is crucial for large organizations managing complex datasets.
Why is Funnel.io’s reliability a strong point? Users report “More reliable API connections” and “GDS dashboards load way faster” when using Funnel.io. Its software reliability and support are praised, ensuring consistent data flow and performance for critical business operations.
How does Funnel.io cater to complex multi-client data needs? Funnel.io is best for complex multi-client data needs, ETL, modeling, dashboards, and advanced measurement. It supports unlimited clients and users, handling high-volume, cross-platform reporting without workarounds, making it ideal for scaling agencies managing dozens of accounts and platforms.
6. Databox
Databox is a Whatagraph alternative ecause it offers broader data integration with 100+ native connectors, provides moderate data transformation capabilities with calculated metrics, features more advanced AI for goal tracking and anomaly detection, offers a free plan starting at $0/month, includes a mobile app for on-the-go KPI monitoring, and is generally well-regarded with “mainly positive” user reviews.
How does Databox’s broader data integration contribute to its alternative status? Databox provides over 100 native data connectors, allowing users to consolidate data from various sources like Analytics, Google Ads, and social media into a single platform. This contrasts with Whatagraph’s 50+ or 100+ connectors, depending on the source, and enables businesses to access critical business metrics from diverse platforms in one place, simplifying data oversight.
Why are Databox’s data transformation capabilities significant? Databox offers moderate data transformations through calculated metrics and data blending, which allows for more flexible and customized data analysis. This feature is more advanced than Whatagraph’s limited or non-existent transformation capabilities, enabling users to derive granular insights and create custom metrics from their integrated data.
What makes Databox’s AI features a strong alternative? Databox incorporates AI-powered goal tracking, forecasting, and anomaly detection, providing users with proactive insights into performance. This is more sophisticated than Whatagraph’s AI Chatbot (beta) or Whatagraph IQ, which primarily focuses on report summaries, offering a more advanced approach to continuous monitoring and real-time responsiveness to data changes.
How does Databox’s pricing structure position it as an alternative? Databox offers a free plan with limited data sources and dashboards, making it accessible for smaller businesses or those exploring options. While its professional plan starts at $159-$199/month, the availability of a free tier and a lower initial entry point (starting from $47/month) provides a flexible alternative to Whatagraph, which has no free tier and a higher base price of $199/month.
Why is the mobile app a key feature for Databox? Databox provides a mobile app for on-the-go KPI monitoring and notifications, allowing users to track performance throughout the day. This feature is particularly beneficial for teams that rely on continuous monitoring and managers setting daily or weekly campaign goals, ensuring real-time access to critical business metrics from anywhere.
What do user perceptions indicate about Databox as an alternative? Databox is generally well-regarded with “mainly positive” reviews, highlighting its intuitive and aesthetically pleasing interface, ease of use, and comprehensive data visualization. Users frequently praise its ability to view data from various sources in one place and its valuable alert system, making it a strong contender for businesses seeking a user-friendly and powerful BI platform.
7. DashThis
DashThis is a Whatagraph alternative because it offers a more intuitive user experience for 94% of users, provides unlimited users and integrations across plans, boasts a higher G2 rating of 4.8 compared to Whatagraph’s 4.5, delivers significant time savings of 30-40 hours on monthly reporting, and offers newly launched AI Insights in beta for analyzing marketing performance.
How does user experience contribute to DashThis being an alternative? DashThis is praised for being more intuitive and flexible than Google Analytics, with users describing it as “plug and play for great dashboards.” Its streamlined interface and templates allow dashboard creation within minutes, requiring low technical expertise. This ease of use is a significant factor for agencies prioritizing simple, polished dashboards for fast client updates.
Why are unlimited users and integrations a key differentiator? DashThis offers unlimited users, templates, and integrations across its pricing plans, with pricing based solely on the number of dashboards. This contrasts with Whatagraph’s model, which charges per source credit and has a “Forever free” plan limited to 5 source credits. DashThis integrates with over 300 marketing platforms, including 30-34+ native integrations, and supports CSV file uploads for unsupported data sources.
What makes DashThis’s G2 rating significant? DashThis holds a higher G2 rating of 4.8 out of 5, compared to Whatagraph’s 4.5. This indicates stronger overall user satisfaction and positive feedback regarding its performance, customer service, and ease of use. Users frequently praise DashThis’s “Amazing Customer Service” and quick responses.
How do time savings position DashThis as a strong alternative? DashThis helps users reduce the time spent on monthly reporting from 30-40 hours down to 10-20 hours. This efficiency gain is crucial for agencies and teams needing to quickly generate reports for marketing campaigns, improving client communication and satisfaction, and helping to close new accounts.
What role do AI features play in its alternative status? DashThis has newly launched AI Insights in beta, which users describe as having “shocking” accuracy and providing “insightful recommendations” for analyzing marketing performance. While Whatagraph offers more advanced AI features like chatbots and natural language queries, DashThis’s emerging AI capabilities provide a competitive edge and enhance its reporting analysis.
8. Klipfolio
Klipfolio is a Whatagraph alternative because it offers broader business intelligence and integration capabilities with 130+ data sources, provides advanced technical data access including full SQL support, allows for extensive customization and flexibility with pixel-level control, targets technical users and specific business intelligence needs, supports real-time monitoring with refresh rates as low as 30 minutes, and has a lower entry cost starting at $120/month.
How does Klipfolio offer broader business intelligence and integration? Klipfolio provides extensive business intelligence capabilities with over 130 to 140 integrations, encompassing cloud services, databases, spreadsheets, and REST APIs. This contrasts with Whatagraph’s 40 to 55 marketing channel integrations. Klipfolio’s “Base” plan, priced at $120/month, includes 130+ data integrations, allowing for a wider scope of data consolidation and analysis.
Why is Klipfolio’s technical data access a key differentiator? Klipfolio supports full SQL and direct database connections, features not available in Whatagraph. It also allows users to connect directly via custom API if a data source is not natively supported. This capability enables deep data modeling for technical teams, scoring 10/10 for users building complex models.
What makes Klipfolio’s customization and flexibility stand out? Klipfolio offers spreadsheet-like flexibility and pixel-level control over visualizations. It provides 30+ visualizations with pixel-level layout control and custom theming, including CSS/JS upload as an add-on. Users can perform custom data modeling with joins, formulas, and SQL support, allowing for highly tailored dashboards.
How does Klipfolio target specific user needs? Klipfolio is best suited for technical users building complex models (score 10/10), Sales and Revenue teams needing real-time tracking (score 9/10) due to its database/CRM integrations, and Finance Leaders monitoring cash flow and KPIs (score 10/10) through spreadsheet integration and custom formulas. Consultants also find it excellent for building reusable KPI Dashboards (score 9/10) using its template gallery and pixel control.
Why is real-time monitoring a significant advantage for Klipfolio? Klipfolio is ideal for scenarios requiring real-time monitoring, offering refresh rates that vary from 4 hours down to 30 minutes depending on the plan, with near-real-time as an add-on for $139/month. This surpasses Whatagraph’s typical hourly refresh rate, providing more current data for critical decision-making.
What is the cost advantage of Klipfolio? Klipfolio offers a lower entry cost, starting at $120/month (or $99/month in some sources), compared to Whatagraph’s 199€/month (or $99/month in some sources). The Klipfolio “Base” plan at $120/month includes 3 dashboards and unlimited users, making it an accessible option for businesses seeking comprehensive BI tools.
9. ReportGarden
ReportGarden is a Whatagraph alternative because it offers a significantly lower price point, provides strong core reporting and dashboard functionality, features a user-friendly interface with automation, and targets small to midsize agencies effectively.
How does the lower price point make ReportGarden an alternative? ReportGarden is “well within the 100 USD per month budget,” making it a cheaper alternative to Whatagraph and Supermetrics. It offers “Price to performance” as a key benefit, with a starting price of $229 per month (SoftwareWorld, 2026) for its advanced plans, which is still competitive for its target market. This cost-effectiveness is “perfect for small agencies” and users with “a few smaller clients” who cannot justify spending upwards of USD 100 monthly on other platforms.
Why is its core functionality a strong alternative? ReportGarden is a “reporting and dashboard platform” primarily focused on creating analysis and performance reports for clients, especially for online ad agencies. It excels at “PPC reporting and client dashboards,” automating data integration from multiple sources like Search Console, Analytics, Google Ads, and Facebook to create custom reports and track KPIs. Users praise its ability to “easily create reports for online and social media campaigns” and its “strong campaign visualization and client reporting features.”
What makes the user-friendly interface and automation a viable alternative? ReportGarden offers an “excellent user interface” and is described as “pretty easy to setup and schedule your reports” and “User friendly.” It automates reports, saving time for agencies. Key features include customizable reporting templates, a “white-labelled portal,” “scheduling options,” and “dashboards,” all contributing to an efficient reporting workflow.
How does its target audience positioning establish it as an alternative? ReportGarden is specifically designed for Self-Employed, Small-Business, and Midsize-Business users. Its feature set and pricing are tailored to agencies managing “a few smaller clients,” providing essential reporting capabilities without the higher cost or complexity of more comprehensive marketing data platforms. Multiple users recommend it, with one stating, “ReportGarden indeed is the best reporting software” for their needs.
10. Salesforce Marketing Cloud Intelligence (Datorama)
Salesforce Marketing Cloud Intelligence (Datorama) is a Whatagraph alternative because it offers advanced data management capabilities beyond simple reporting, provides deep integration within the Salesforce ecosystem, and includes AI-powered tools for enhanced insights and optimization.
How does Salesforce Marketing Cloud Intelligence offer advanced data management? Datorama provides comprehensive features for data ingestion, harmonization, modeling, and analytics, including 170 prebuilt API connectors and a Universal AI connector for flat-file sources. It unifies and transforms marketing data into timely insights, supporting complex business logic and detailed segmentation for large enterprises.
Why is deep integration within the Salesforce ecosystem a key differentiator? Datorama benefits from its seamless integration with Salesforce CRM, Sales Cloud, and Service Cloud, allowing for a unified view of customer data. This integration is particularly valuable for large enterprises already committed to the Salesforce platform, enabling them to leverage existing investments and streamline data flow across their business operations.
What AI-powered tools does Datorama provide for enhanced insights? Salesforce Marketing Cloud Intelligence includes multiple AI-powered tools such as predictive analytics, trend and anomaly detection, and AI campaign summaries. It also features Agentforce, which identifies and pauses low-performing ads, recommends optimizations, and adjusts campaign goals to maximize effectiveness, proving marketing’s impact to the bottom line with embedded Tableau Next visualizations and built-in attribution.
11. NinjaCat
NinjaCat is a Whatagraph alternative because it offers comprehensive all-in-one functionality for digital marketing agencies, provides extensive AI-enabled analytics and automation, boasts a wide array of data integrations, delivers highly customizable reporting and data handling, and receives stellar customer support.
How does NinjaCat’s all-in-one functionality position it as an alternative? NinjaCat is an all-in-one reporting, call tracking, and call monitoring solution specifically designed for digital marketing agencies, tracking PPC, SEO, and AdWords. It unifies data, creates insightful reports, and accelerates campaign optimization, lead generation, and conversion. This comprehensive approach aims to help businesses compete, thrive, and grow, delivering exceptional results to advertisers and unburdening analytics teams.
Why are NinjaCat’s AI capabilities significant? NinjaCat employs AI-enabled analytics to provide sharp insights and automate tasks, including AI Agents for specific tasks like Campaign Performance Monitoring and Content Creation. The AI Insights Generator Widget provides automated text summaries linked to data widgets, transforming data into engaging insights and minimizing marketing data chaos through automation.
What makes NinjaCat’s data integration capabilities a strong alternative? NinjaCat offers over 150 integrations with marketing platforms, including Google Sheets, Google Data Studio, Tableau, and Google Ads. This extensive integration scope, powered by a transformational data engine, addresses the complexity of siloed digital marketing data, providing a “single pane of glass for all of our advertising channels.”
How does NinjaCat’s reporting and data handling compare? NinjaCat provides user-friendly, customizable reports and dashboards with extensive data customization options within templates. It facilitates visualizing data across a large number of clients and their disparate campaigns, allowing for combining datasets, filtering, and manipulating data. Users can simplify and harmonize data with no-code transformations and custom calculations, with options to store data in a managed warehouse or ship to external storage like Snowflake and BigQuery.
Why is customer support a key differentiator? NinjaCat receives praise for its stellar customer service and offers white-glove setup and service. This high level of support ensures users can effectively leverage the platform’s capabilities, despite some noted complexities in its interface and report builder.
12. Adverity
Adverity is a Whatagraph alternative because it focuses on ETL and data infrastructure rather than all-in-one reporting, it requires external tools for visualization, it presents a significant learning curve for users, its pricing model is substantially higher, and it targets large enterprises with dedicated data teams.
How does Adverity’s focus on ETL and data infrastructure differentiate it? Adverity functions primarily as an enterprise solution for connecting, storing, and transforming data (ETL). It treats marketing data as raw input for downstream tools, with analysis and reporting occurring elsewhere. This contrasts with Whatagraph’s all-in-one marketing reporting approach, positioning Adverity as a foundational data layer rather than a direct reporting competitor.
Why does Adverity require external tools for visualization? Adverity’s visualization and reporting capabilities are limited, frequently mentioned by users as lacking. It offers limited dashboards without rich design customization or a “wow factor,” and has not updated its dashboards for over a year. Users desire a BI-style tool for internal use and “terribly miss the option to send a chart from one report to another,” indicating a need for external BI tools like Looker Studio or Power BI for client-ready experiences.
What makes Adverity’s learning curve significant? The platform has a substantial learning curve, requiring time and technical skills to understand its logic. It is not plug-and-play, demanding significant onboarding time, especially for advanced features. Users report illogical aspects in the interface, such as “right-click” in Insights to add to a chart, and describe the UI/UX as “early-2010s enterprise software,” making it overwhelming for new users.
How does Adverity’s pricing model compare? Adverity’s customized quotes are at least 50-60% higher than Whatagraph for the same data, without including visualization capabilities. The annual cost is reported to be at least $30,000, with a one-time purchase option of $200,000 for a 12-month subscription via Microsoft Azure Marketplace. This pricing, described as “quite expensive,” is based on complex metrics like “number of rows, times this, divided by that.”
Why does Adverity target large enterprises? Adverity is designed for large enterprises with serious data infrastructure and dedicated data teams. These organizations possess the time, budget, and technical talent to manage its complexity, including API logic, UTC time zones, and custom field mappings. Its implementation averages 2 months to become fully operational, with an ROI payback period of approximately 15 months, aligning with large-scale organizational investments.
13. TapClicks
TapClicks is a Whatagraph alternative because both platforms simplify reporting for digital agencies and clients, they offer extensive integration capabilities with 250+ and 55+ native sources respectively, both provide robust customization options for reports and dashboards, they offer workflow automation features for scheduled reporting and campaign management, and both provide free versions and free trials for user evaluation.
How do both platforms simplify reporting for digital agencies and clients? Both TapClicks and Whatagraph are designed to streamline reporting and campaign assessment. TapClicks offers “end-to-end business intelligence capabilities” including SEO, social, and PPC reporting, while Whatagraph is a “marketing analytics visualization and automation platform” focused on “reliable client reporting.” Both platforms aim to reduce the complexity of data aggregation and presentation for their target audiences, which include digital agencies and their clients.
Why are extensive integration capabilities a key reason for TapClicks being an alternative? TapClicks provides access to a “relevant and large integrations library” with “many connector options under their 250+ connector,” connecting to over 250 native sources out of the box. Whatagraph supports approximately 55 managed integrations covering major platforms. Both platforms integrate with common marketing tools such as Google Ads, Google Analytics, Instagram, LinkedIn, and Salesforce, ensuring broad data connectivity for users.
What makes robust customization options a significant factor? TapClicks allows teams to create custom views and adapt dashboards to campaign goals, budget pacing, and metric changes. Whatagraph enables users to create custom metrics based on available data fields and offers full control over layout using drag-and-drop elements for client-friendly dashboards. This shared emphasis on customization ensures that users can tailor reports to specific client needs and campaign objectives.
How do workflow automation features contribute to their alternative status? TapClicks offers superior workflow automation, integrating campaign management, workflow automation, and data exports into one platform, supporting calculated metrics and performance pacing. Whatagraph helps agencies automate reporting without building dashboards from scratch and supports scheduled delivery for weekly or monthly updates. Both platforms aim to reduce manual effort in report generation and distribution.
Why are free versions and free trials important for positioning TapClicks as an alternative? Both TapClicks and Whatagraph offer a free version and a free trial. This allows potential users, particularly agencies and clients, to evaluate the platforms’ functionalities and determine their suitability before committing to a paid plan. This common offering makes them direct competitors in the market for marketing reporting solutions.
14. Swydo
Swydo is a Whatagraph alternative because it targets small agencies with lower-tier plans starting at $69/month, offers an intuitive user interface with minimal training, provides advanced data blending capabilities for up to 5 ad platforms (launched May 2025), includes proactive “Data Health Check Alerts” for connection monitoring, integrates with 30+ third-party tools, and offers a 14-day free trial without requiring a credit card.
How does Swydo’s target audience and pricing differentiate it? Swydo is designed for small agencies, offering flexible monthly subscriptions starting at $69/month, scaling by data sources. This contrasts with Whatagraph’s credit-based system, which typically starts around $229/month and can exceed $400/month for agencies with multiple clients. For example, 24 data sources cost Swydo users $132/month compared to Whatagraph’s ~$300-400/month.
Why is Swydo’s ease of use a significant factor? Swydo is praised for its intuitive user interface, requiring minimal training and featuring drag-and-drop report building. This simplifies the onboarding process for new users, unlike Whatagraph, which can present a steeper learning curve and a more complex interface for beginners, with reported glitches during simultaneous editing.
What makes Swydo’s core features and capabilities competitive? Swydo’s “Combined Data Sources” feature, launched in May 2025, allows merging metrics from up to 5 ad platforms (e.g., Google Ads, Meta, TikTok) into single widgets. Additionally, Swydo AI is now in Beta, offering instant insights and multi-language support, directly addressing previous feature gaps compared to Whatagraph IQ.
How do Swydo’s proactive monitoring and data health alerts provide an advantage? Swydo offers “Data Health Check Alerts” that proactively monitor data connections and notify users of breaks. This feature is explicitly stated as not being offered by competitors, addressing a common pain point for Whatagraph users who report frequent disconnections of marketing platform connectors.
Why are Swydo’s integrations and performance important? Swydo supports 30+ third-party tools, including Google Ads and Google Analytics 4, with recent additions like ActiveCampaign and Semrush AI Ranking Metrics. While Whatagraph supports 55+ integrations, Swydo’s integrations are described as “deep & not wide,” offering more metrics per integration. Swydo also provides fast-loading reports and consistent platform performance, unlike Whatagraph’s limited data refresh rates (12-24 hours).
What is the value of Swydo’s free trial and customer support? Swydo offers a 14-day free trial without requiring a credit card, allowing agencies to evaluate the platform risk-free. Swydo also provides 24/5 customer support, which users praise for its responsiveness, contributing to a positive user experience.
15. Cyfe
Cyfe is a Whatagraph alternative because it offers a broader business analytics solution beyond marketing, provides more custom data connection options, supports additional use cases like IT and Finance dashboards, features a more accessible pricing model, and includes client portal capabilities.
How does Cyfe’s broader solution compare to Whatagraph? Cyfe functions as an all-in-one dashboard app for monitoring and analyzing data from various online services, including Google Analytics, Salesforce, Google Ads, MailChimp, Facebook, and Twitter, in real-time from a single location. While Whatagraph specializes in marketing reporting, Cyfe is described as a broad solution for business analytics, extending its utility beyond marketing to IT, Finance, and Sales dashboards.
Why are Cyfe’s custom data connections a significant advantage? Cyfe provides more custom data connections to Zapier and SQL databases compared to Whatagraph. It offers more than 100 integrations and supports 1500+ Zapier app ecosystems, alongside 250+ pre-built metrics. In contrast, Whatagraph sources indicate Cyfe supports only 25 native connectors and requires manual connections for many platforms, highlighting Cyfe’s superior flexibility in data sourcing.
What additional use cases does Cyfe support? Beyond marketing, Cyfe is specifically designed for IT, Finance, and Sales dashboards, making it a versatile tool for various business departments. This multi-departmental utility allows businesses to consolidate monitoring across different functions, whereas Whatagraph is primarily focused on marketing reporting. Cyfe also supports TV displays for public dashboards and data alerts for proactive monitoring.
How does Cyfe’s pricing model offer an alternative? Cyfe features a dashboard-based pricing model with four tiers, starting at $19/month for the Starter plan (2 dashboards, 1 user) and going up to $89/month for the Premier plan (20 dashboards, unlimited users). This tiered structure, including a special Agency pricing plan with 100 dashboards and 15 users, provides a potentially more cost-effective solution for some businesses, especially smaller agencies or in-house marketers, compared to other alternatives.
What client-facing capabilities does Cyfe offer? Cyfe provides the ability to set up a client portal, which is crucial for agencies needing to share performance data directly with their clients. This feature, combined with white-labeling support and monthly pricing plans, allows agencies to present a professional, branded experience to their clients, enhancing client communication and reporting efficiency.
16. Windsor.ai
Windsor.ai is a Whatagraph alternative because both platforms offer ETL functionality for marketing data, Windsor.ai provides significantly more data connectors (303+ vs. 50+), Windsor.ai offers a more cost-effective entry point at $19/month compared to Whatagraph’s $219/month, Windsor.ai supports broader data warehouse transfers to all major platforms at its lowest tier, and both tools share core features like free trials and Looker Studio connectors.
How does shared ETL functionality position Windsor.ai as an alternative? Both Windsor.ai and Whatagraph function as ETL/ELT tools, enabling users to extract, transform, and load marketing data. Windsor.ai focuses on moving data from over 325 marketing sources into warehouses, spreadsheets, and BI tools, while Whatagraph handles the ELT pipeline, harmonization, visualization, and reporting for marketing agencies. This core shared purpose makes them direct competitors in the marketing data space.
Why is Windsor.ai’s connector availability a key differentiator? Windsor.ai offers a substantial advantage with 303+ connectors, all available across every pricing tier. In contrast, Whatagraph provides only 50+ connectors. This broader integration capability allows Windsor.ai users to collect data from a significantly wider range of marketing sources, ensuring more comprehensive data aggregation for customer journey mapping and attribution.
What makes Windsor.ai a more cost-effective alternative? Windsor.ai starts at $19/month and includes a free forever plan, with API access also beginning at $19/month. Whatagraph, however, starts at $219/month and its API access begins at $249/month, without a free forever plan. This significant price difference, especially at entry levels, positions Windsor.ai as a more accessible option for users with budget constraints.
How does Windsor.ai’s data warehouse transfer capability compare? Windsor.ai offers access to all major data warehouse platforms (BigQuery, Snowflake, Azure SQL/blob, Amazon S3, MySQL, PostgreSQL) starting at its $19/month tier, without basing pricing on row counts. Whatagraph, conversely, only transfers data to BigQuery and this feature starts at a higher price point of $249/month. This broader and more affordable data warehousing support enhances Windsor.ai’s utility for diverse data infrastructure needs.
What shared features contribute to their alternative status? Both Windsor.ai and Whatagraph offer free trials without requiring sales calls, include data mapping features for custom metrics, are SOC2 Type 2 compliant, and support Single Sign-On/MFA. They also both provide Looker Studio connectors (Windsor.ai offers 94), Power BI connectors, Tableau connectors via API, Google Sheets plugins, and Excel integrations, indicating a common set of functionalities for marketing data analysis and reporting.
17. Fivetran
Fivetran is a Whatagraph alternative for three because both platforms serve as data integration tools for businesses, both offer prebuilt connectors to various data sources, and both aim to simplify data pipelines for their respective target users.
How do both platforms serve as data integration tools? Fivetran is an ELT tool designed to centralize and sync data from hundreds of sources into data warehouses, lakes, or BI tools without coding. Whatagraph is an all-in-one marketing intelligence platform that enables simple processing and presentation of data for marketing agencies. While Fivetran focuses on raw data ingestion and Whatagraph on marketing analytics, both fundamentally integrate data from disparate sources.
Why do both offer prebuilt connectors to various data sources? Fivetran boasts over 700 prebuilt connectors across marketing, sales, finance, and operations tools, with some sources stating 600+ or 490+. Whatagraph has 85+ native integrations, including 55+ native marketing platform connectors or 45+ connectors depending on the source. This shared capability allows users of both platforms to connect to a wide array of business applications to extract data.
What makes both platforms aim to simplify data pipelines for their respective target users? Fivetran is described as a “set it and forget it” experience for data pipelines, designed for data-driven teams needing reliable, automated data pipelines without coding. Whatagraph is marketed with a “zero learning curve” and powerful AI features, allowing marketers to build live dashboards for clients/execs without needing a data engineer. Both tools abstract away significant technical complexity to make data accessible to their intended audiences.
18. Dataslayer
Dataslayer is a Whatagraph alternative because both platforms offer cross-channel reporting and data alignment, Dataslayer provides more versatile integrations with 45+ connectors compared to Whatagraph’s 55+ connectors, Dataslayer supports more deployment destinations including BigQuery and Amazon S3, Dataslayer offers a free plan while Whatagraph does not, and Dataslayer supports more operating systems including Windows and Linux.
How do both platforms offer cross-channel reporting and data alignment? Dataslayer’s core functionality is an efficient marketing reporting tool for aligning data across multiple channels, automatically updating reports in Sheets, Looker Studio, and BigQuery, and helping to keep tabs on campaign performance and user behavior across all paid media platforms from one interface. Whatagraph is described as “one of the leading platforms for cross-channel marketing data reporting,” simplifying data visualization and transforming intricate marketing data into clear and engaging visual reports.
Why does Dataslayer provide more versatile integrations? Dataslayer offers seamless integrations with various platforms including Google Sheets, Microsoft Excel, Looker Studio, Power BI, BigQuery, Amazon S3, and Amazon RedShift, supporting 45+ data sources. While Whatagraph supports 55+ connectors, it is “not as versatile when it comes to custom integrations.” Dataslayer’s focus on destination-specific pricing and integration with various destinations, including data warehouses, distinguishes its integration approach.
What makes Dataslayer’s deployment destinations a key differentiator? Dataslayer supports 5 destinations: Power BI, API Query Manager, Google Sheets, BigQuery, and Looker Studio. In contrast, Whatagraph has 0 destinations. Dataslayer’s BigQuery destination pricing starts at $3500 per month, indicating a robust offering for data warehousing.
Why is Dataslayer’s free plan a significant advantage? Dataslayer offers a free plan, making it accessible for users to try its features without initial cost. Whatagraph does not offer a free plan, with its starting price noted as $229 per month or $249 per month by different sources, and $12.46 by another source.
How does Dataslayer’s device support broaden its appeal? Dataslayer supports Web-Based, Windows, and Linux operating systems, providing greater flexibility for users. Whatagraph is primarily Web-Based. This broader support allows Dataslayer to cater to a wider range of user environments.
19. Reporting Ninja
Reporting Ninja is a Whatagraph alternative for four because both platforms offer automated digital marketing reporting, provide data blending and integration from various sources, share key features and capabilities like customizable dashboards and white-labeling, and serve similar target audiences within the digital marketing landscape.
How do both platforms offer automated digital marketing reporting? Both Reporting Ninja and Whatagraph function as automated digital marketing reporting platforms. Reporting Ninja centralizes data from various sources to aid strategic decision-making, with a primary focus on PPC (paid campaigns). Whatagraph focuses on marketing analytics visualization and automation for simple processing and presentation of data, specifically for marketing agencies.
Why is data blending and integration a shared characteristic? Reporting Ninja centralizes data from various sources and enables data blending from different platforms and channels for cross-channel data inclusion. Similarly, Whatagraph blends data from multiple channels, accounts, or campaigns, and connects custom data sources with Google Sheets and Public API integrations.
What key features and capabilities do they share? Both platforms allow users to create simple, fully customizable dashboards, decide what data to include, and apply filters and dimensions. Reporting Ninja offers white-labeling for branded reports and client portals for real-time progress tracking, while Whatagraph helps teams maintain brand consistency across clients. Reporting Ninja allows sharing via client portals or scheduled email delivery as PDF files (daily, weekly, monthly), and Whatagraph helps communicate results clearly. Both are noted for ease of use, with Reporting Ninja described as “very easy to use” with simple data automation and drag-and-drop functionality, and Whatagraph noted for visually impressive reports with minimal effort and fast, polished reporting.
How do they serve similar target audiences? Reporting Ninja aids strategic decision-making and is suitable for companies and professionals running ads on different platforms, offering affordability for businesses of all sizes, with plans starting at $20/month for 4 users and 10 reports. Whatagraph specifically targets marketing agencies, allowing clients to understand their business. The explicit mention of Reporting Ninja as an alternative to other reporting tools, including Whatagraph, further confirms their competitive overlap.
20. AgencyAnalytics
AgencyAnalytics is a Whatagraph alternative because it offers built-in SEO tools that Whatagraph lacks, provides a faster initial setup for basic reporting, includes more integrations than Whatagraph, features AI-generated summaries on all plans, and offers a lower starting price point for smaller agencies.
How do built-in SEO tools make AgencyAnalytics an alternative? AgencyAnalytics includes rank tracking, site audits, and backlink monitoring directly within its platform, eliminating the need for separate subscriptions for these capabilities. Whatagraph, in contrast, requires users to connect external SEO platforms, adding complexity and cost. This integrated approach makes AgencyAnalytics a comprehensive solution for SEO-focused agencies that want to manage their core SEO tasks alongside marketing dashboards.
Why is faster initial setup a significant factor? AgencyAnalytics allows users to create a basic report within an hour, with a gentle learning curve. One user noted it takes minutes to create a new client project and report, compared to up to an hour with Google Data Studio. This speed is crucial for small agencies (5-15 clients) needing standard reporting without deep customization, enabling them to quickly onboard clients and deliver reports.
What makes AgencyAnalytics’ integrations a competitive advantage? AgencyAnalytics integrates data from over 75 marketing tools, connecting with over 80 tools including GA4, Google Ads, and Meta Ads. While Whatagraph connects with over 40 native integrations and over 30 data sources, AgencyAnalytics offers a broader range of connections, including keyword rankings which Whatagraph lacks. This wider integration capability allows agencies to consolidate more client data in one platform.
How do AI-generated summaries enhance AgencyAnalytics’ offering? AgencyAnalytics recently introduced AI-generated summaries and on-page insights, which are available on its Agency plan ($179/month). Whatagraph also offers AI features on all plans, including report summaries and data Q&A. This shared AI capability provides agencies with automated insights, streamlining the reporting process and adding value for clients.
Why is the lower starting price point relevant for agencies? AgencyAnalytics’ subscription starts from $49 per month, making it more accessible for smaller agencies. While its pricing scales with client campaigns, its initial cost is significantly lower than Whatagraph’s Boost plan, which costs approximately $549/month (annual) for 60 source credits. This lower entry barrier allows smaller agencies to access robust reporting features without a substantial upfront investment.
21. Wrike
Wrike is a Whatagraph alternative because it offers shared features like dashboard creation, provides robust project management capabilities for operational visibility, supports diverse organizational needs across all business sizes, offers flexible pricing tiers starting from $0/month, and provides comprehensive platform and support options including mobile applications and 24/7 assistance.
How do shared features contribute to Wrike being an alternative? Wrike shares 2% of its features with Whatagraph, specifically Dashboard Creation. This common functionality allows users to visualize key metrics and project progress, a core aspect of Whatagraph’s data visualization focus. Both platforms also share 7% of their integrations, including BigCommerce, Campaign Monitor by Marigold, and HubSpot CRM, facilitating data flow between essential marketing and e-commerce tools.
Why are robust project management capabilities significant? Wrike is a versatile and robust project management software that enhances team collaboration and provides operational execution visibility across departments. It offers user-friendly features for planning, tracking, and managing projects seamlessly, including timeline-driven project mapping crucial for sequential campaign workflows. Wrike allows agencies and marketing departments to monitor asset production, approval cycles, and team capacity using interactive charts and status updates, which can serve as an alternative to Whatagraph’s reporting for operational insights.
What makes Wrike suitable for diverse organizational needs? Wrike supports Freelancers, Large Enterprises, Medium Businesses, Small Businesses, and Individuals, mirroring the broad applicability of Whatagraph. This wide range of supported organization types means Wrike can cater to similar client bases seeking project management and operational visibility solutions. SoftwareWorld recommends Wrike for enterprises seeking a robust alternative due to its scalability, advanced automation, top-tier security, and enterprise-grade customer support.
How do flexible pricing tiers make Wrike an alternative? Wrike offers a flexible pricing structure, with plans starting from $0/month for its Free tier, $10/user/month for the Team plan, and $25/user/month for the Business plan (all billed annually). This range, including a free option and a 14-day free trial, makes it accessible to various budgets, similar to how businesses might consider Whatagraph.
Why are comprehensive platform and support options important? Wrike supports multiple platforms, including Browser Based (Cloud), Mobile – Android, Mobile – iOS, Installed – Windows, and Installed – Mac, providing seamless remote access and real-time collaboration. It also offers a full-featured mobile application for managing tasks and tracking progress on the go. Both Wrike and Whatagraph provide 24/7 (Live rep), Business Hours, and Online support, ensuring users have access to assistance when needed.
22. Teamwork.com
Teamwork.com is a Whatagraph alternative because it offers project management reporting with 98% unique features, provides strong user satisfaction with a 4.5/5 Capterra rating, shares specific integrations like HubSpot Marketing Hub, and is explicitly recognized as an alternative by Software Advice.
How does Teamwork.com’s project management focus make it an alternative? Teamwork.com is primarily designed for project management reporting, focusing on project health, planned vs. actual reports, utilization, profitability, and project progress dashboards. This contrasts with Whatagraph’s marketing performance focus. Teamwork.com boasts 98% of its features as unique compared to Whatagraph, including Access Controls/Permissions, Activity Dashboard, and Activity Tracking.
Why is user satisfaction a factor in its alternativity? Teamwork.com has a Capterra rating of 4.5/5, praised for its ease of use, UI, Google Cloud integration, and task scheduling. This high user satisfaction indicates a robust and well-received platform, offering a strong alternative experience to Whatagraph, which has a slightly lower 4.4/5 rating.
What shared integrations contribute to Teamwork.com being an alternative? Teamwork.com shares 1% of its integrations with Whatagraph, specifically HubSpot Marketing Hub. This overlap in a key marketing integration allows businesses using HubSpot to potentially transition between the two platforms for certain reporting needs, despite their primary functional differences.
How does external recognition confirm Teamwork.com as an alternative? Teamwork.com is explicitly listed as one of the “Best 15 Whatagraph Alternatives in 2026” by Software Advice. This direct endorsement from an industry analyst firm provides strong contextual evidence that Teamwork.com is considered a viable alternative in the reporting software market.
23. monday.com
monday.com is a Whatagraph alternative because it is explicitly listed as an alternative by Software Advice in 2026, it offers overlapping campaign tracking features, it shares 14% of its integrations with Whatagraph, and it targets similar business sizes.
How is monday.com explicitly listed as an alternative? Software Advice, a reputable software review platform, includes monday.com in its “Best 15 Whatagraph Alternatives in 2026” list. This direct inclusion positions monday.com as a viable substitute for users seeking Whatagraph’s functionalities.
Why do overlapping features make monday.com an alternative? monday.com shares 2% of its features with Whatagraph, specifically Campaign Tracking. While monday.com is a comprehensive Work OS, this shared core marketing functionality allows it to serve a similar purpose for campaign oversight.
What role do shared integrations play in monday.com being an alternative? monday.com shares 14% of its integrations with Whatagraph, including key marketing platforms like LinkedIn for Business, Mailchimp, and Meta for Business. These common integrations enable both platforms to connect with essential marketing data sources, facilitating similar workflows for users.
How does target audience overlap contribute to monday.com’s alternative status? Both monday.com and Whatagraph target Small-Business, Midsize-Business, and Large-Enterprise-Business segments. This shared market focus means that businesses of various sizes considering Whatagraph could also find monday.com suitable for their operational needs, despite their differing core functionalities.
24. Scoro
Scoro is a Whatagraph alternative because it offers a 2% overlap in core features and an 11% overlap in integrations, it provides a comprehensive reporting and dashboard solution for professional services, it includes unique features and integrations not found in Whatagraph, and it offers structured pricing plans starting at $28/month.
How does feature and integration overlap position Scoro as an alternative? Scoro shares 2% of its features with Whatagraph, specifically Data Connectors, which are crucial for aggregating information. Additionally, 11% of Scoro’s integrations are shared with Whatagraph, including ActiveCampaign, Google Analytics 360, and HubSpot CRM. This shared functionality allows users to maintain continuity with existing data sources when considering Scoro as an alternative.
Why is Scoro’s comprehensive reporting solution relevant for professional services? Scoro is designed as a reporting and dashboard tool to analyze important metrics, enabling users to focus on execution and strategy. It targets agencies, consulting firms, and other professional services aiming to scale their business and improve team efficiency. Key capabilities include identifying gaps, creating detailed reports with a single click, and providing an overview of business risk areas.
What unique aspects distinguish Scoro from Whatagraph? Scoro boasts 98% unique features, such as Access Controls/Permissions, Activity Tracking, and Assignment Management, which provide broader operational management capabilities. Furthermore, 89% of Scoro’s integrations are unique, including connections to Airtable, Asana, and BambooHR, offering a wider ecosystem for business operations beyond just reporting.
How does Scoro’s pricing structure make it a viable alternative? Scoro offers four distinct paid plans, providing options for various business needs and budgets. These plans start at $28/month for the Essential tier, with subsequent tiers at $42/month (Standard) and $71/month (Pro), and an Ultimate plan available upon contact. This tiered pricing allows businesses to select a plan that aligns with their specific requirements and financial considerations.
25. Smartsheet
Smartsheet is a Whatagraph alternative because Smartsheet shares key features with Whatagraph, and Smartsheet shares specific integrations with Whatagraph.
How do shared features contribute to Smartsheet being a Whatagraph alternative? Smartsheet offers Dashboard Creation, Real-Time Data, and Reporting & Statistics, which are also core functionalities of Whatagraph. These shared features constitute 5% of Smartsheet’s total listed features, indicating a functional overlap that positions Smartsheet as a viable alternative for users seeking these specific capabilities.
Why are shared integrations significant for Smartsheet as an alternative? Smartsheet integrates with HubSpot CRM and Mailchimp, which are also integrations available in Whatagraph. These shared integrations represent 3% of Smartsheet’s total listed integrations. This commonality allows users to maintain continuity with their existing marketing and CRM tools when considering Smartsheet as an alternative to Whatagraph.
26. Ziflow
Ziflow is a Whatagraph alternative because both are explicitly listed as alternatives to AD EBiS in multiple contexts, they share 4% of core features including Reporting & Statistics and Search/Filter, and both offer free trial options suitable for small businesses and enterprises.
How are Ziflow and Whatagraph explicitly listed as alternatives? SoftwareWorld specifically identifies Ziflow as one of the “best alternatives to AD EBiS” alongside Whatagraph. In the “FAQs About AD EBiS Alternatives” section, both platforms are discussed together regarding “best alternatives,” “free trial options,” “small businesses,” and “enterprises.” Both are also categorized as “cloud-based alternatives” to AD EBiS.
What shared features contribute to Ziflow being an alternative? Ziflow and Whatagraph share 4% of their features, specifically Reporting & Statistics and Search/Filter capabilities. While Ziflow’s core functionality focuses on creative collaboration and online proofing software to streamline review and approval for creative content, and Whatagraph is a marketing intelligence platform for analytics and reporting, this overlap in fundamental data handling features positions them as comparable in certain aspects.
Why are free trials and business suitability important for alternatives? Both Ziflow and Whatagraph offer free trial options, making them accessible for evaluation by potential users. Furthermore, both platforms are considered suitable for both small businesses and enterprises, indicating a similar target market and scalability. Ziflow is priced at $199 per month and is available in the United States, while Whatagraph is $229 per month and available in the Netherlands.
27. Adalysis
Adalysis is a Whatagraph alternative because Adalysis offers 97% unique features compared to Whatagraph, 57% of Adalysis’s integrations are unique, Adalysis provides a broader range of advertising management capabilities, and Adalysis shares only 3% of its features with Whatagraph.
How do Adalysis’s unique features contribute to its status as an alternative? Adalysis provides a comprehensive set of features not found in Whatagraph, with 97% of its features being unique. These include A/B Testing, an Activity Dashboard, and Advertising Management, which offer distinct functionalities for users seeking advanced campaign optimization and oversight.
Why are Adalysis’s unique integrations significant? Adalysis offers 57% unique integrations, expanding its connectivity beyond Whatagraph’s shared integrations. These unique integrations include Gmail, Google Data Studio, and Microsoft Excel, providing users with diverse options for data import, analysis, and reporting that Whatagraph does not offer.
What makes Adalysis’s advertising management capabilities a differentiator? Adalysis includes Advertising Management as a unique feature, indicating a focus on direct campaign control and optimization tools. This contrasts with Whatagraph’s primary focus on reporting and statistics, making Adalysis a more hands-on solution for managing advertising efforts.
How does the low percentage of shared features position Adalysis as an alternative? Adalysis shares only 3% of its features with Whatagraph, specifically in Reporting & Statistics. This minimal overlap highlights that Adalysis largely offers a different set of functionalities, positioning it as a distinct and comprehensive alternative rather than a direct competitor with similar offerings.
28. Taboola
Taboola is a Whatagraph alternative because both platforms are listed as alternatives to “Control G” in one source, and both offer similar support channels including 24/7 live support.
How are Taboola and Whatagraph alternatives to “Control G”? Both Taboola and Whatagraph are identified as alternatives to “Control G” in the “Top Control G Alternatives & Competitors 2026 – SoftwareWorld” source. This indicates that for users seeking solutions similar to Control G, both Taboola and Whatagraph are viable options, positioning them as alternatives within a broader market context.
What support similarities do Taboola and Whatagraph share? Both Taboola and Whatagraph provide comprehensive customer support options. These include Email/Help Desk, FAQs/Forum, Knowledge Base, Phone Support, 24/7 (Live rep), and Chat. This shared commitment to diverse support channels ensures users of either platform can access assistance through multiple preferred methods.
29. Workamajig
Workamajig is a Whatagraph alternative because it shares real-time data and reporting & statistics features with Whatagraph, each representing 3% of Workamajig’s total features, and it shares LinkedIn for Business and Twitter/X integrations, each accounting for 17% of Workamajig’s integrations.
How do shared features contribute to Workamajig being an alternative? Workamajig offers real-time data and reporting & statistics, which are also core functionalities of Whatagraph. These shared features, each comprising 3% of Workamajig’s feature set, indicate a foundational overlap in data presentation and analytical capabilities. This common ground allows users seeking these specific functions to consider Workamajig as a viable option.
Why are shared integrations significant for an alternative? Workamajig integrates with key social media platforms like LinkedIn for Business and Twitter/X, mirroring Whatagraph’s ability to pull data from these sources. Each of these integrations represents 17% of Workamajig’s total integrations. This direct integration capability means Workamajig can fulfill similar data aggregation needs from popular business and social platforms, making it a functional alternative for users reliant on these specific data connectors.
30. FURIOUS
FURIOUS is a Whatagraph alternative because it offers a unique feature set with 98% distinct capabilities, it provides a broad range of unique integrations with 90% not shared with Whatagraph, and it is specifically identified as an alternative in at least one industry source.
How does FURIOUS’s unique feature set contribute to its status as a Whatagraph alternative? FURIOUS distinguishes itself by offering a substantial 98% of its features as unique, meaning they are not shared with Whatagraph. For example, FURIOUS provides Access Controls/Permissions, Accounting, and an Activity Dashboard, capabilities not listed as shared. This extensive set of distinct features allows FURIOUS to cater to different or more specialized user needs compared to Whatagraph.
Why is a broad range of unique integrations significant for an alternative? FURIOUS offers a highly differentiated integration landscape, with 90% of its integrations being unique and not shared with Whatagraph. While both platforms share integrations like HubSpot CRM and Mailchimp, FURIOUS extends its connectivity with unique options such as Agicap, AzureDesk, and Brevo. This wider array of unique integrations enables FURIOUS to connect with a different ecosystem of tools, appealing to users whose existing tech stacks align with FURIOUS’s offerings rather than Whatagraph’s.
What makes being specifically identified as an alternative important? FURIOUS is explicitly mentioned as a Whatagraph alternative in the industry publication “Best 15 Whatagraph Alternatives in 2026.” This direct inclusion in a comparative analysis positions FURIOUS as a recognized competitor. Other prominent industry sources, such as “14 Best Whatagraph Alternatives in 2026” and “Top Whatagraph Alternatives in 2026,” do not list FURIOUS, making its mention in at least one source a critical factor in establishing its alternative status.
31. Asana
Asana is a Whatagraph alternative for four because it is explicitly recommended as an alternative by SoftwareWorld, it shares 2% of its features and 3% of its integrations with Whatagraph, it offers a significantly lower starting price of $10.99 per month compared to Whatagraph’s $229 per month, and it targets a broader range of business sizes from self-employed to large enterprises.
How does explicit recommendation contribute to Asana being an alternative? SoftwareWorld, a software review platform, explicitly lists Asana as one of the “All Competitors and Alternatives to Whatagraph” and includes it in FAQs as a suitable alternative for various business sizes and needs. SoftwareWorld also designates Asana as “SW Recommended,” indicating its suitability as a viable alternative.
Why are shared features and integrations significant for an alternative? Asana shares 2% of its features with Whatagraph, specifically a Customizable Dashboard, and 3% of its integrations, including Campaign Monitor by Marigold, HubSpot CRM, and Mailchimp. These shared elements, along with common features like Ad hoc Reporting, Client Management, and Real-Time Data, allow Asana to fulfill some overlapping functionalities, making it a partial substitute for users who prioritize these specific capabilities.
What makes Asana’s pricing a compelling reason for it to be an alternative? Asana has a starting price of $10.99 per month, significantly lower than Whatagraph’s starting price of $229 per month. Asana also offers a Free Version for up to 10 users and a Free Trial, making it accessible for individuals and small teams. This cost difference, with Asana being 20 times less expensive at its base tier, positions it as a more budget-friendly option for users seeking similar functionalities.
How does Asana’s target audience support its role as an alternative? While Whatagraph targets marketers in small to large enterprises, Asana targets a broader audience, including Self-Employed, Small-Business, Midsize-Business, and Large-Enterprise-Business across all industries. This wider applicability means that businesses of various sizes and types, including those with marketing operations, can adopt Asana for their collaborative work management needs, potentially using it in place of or alongside specialized tools like Whatagraph.
Why do Users Search Alternatives to Whatagraph?
Users search for alternatives to Whatagraph for six because specific feature gaps and limitations, cost considerations, reliability and accuracy issues, data management and ownership constraints, usability challenges, and limited data refresh rates.
How do specific feature gaps and limitations drive users to seek alternatives? Whatagraph is not a full ETL tool, lacking advanced data modeling and transformation capabilities. It offers 50-55+ connectors, significantly fewer than competitors like Supermetrics with 150+, missing key integrations for Stripe, Amazon DSP, Google Ads Keyword Planner, and X (Twitter). Whatagraph also does not store historical data for extended periods, challenging long-term trend analysis and year-over-year comparisons. Users “hit a wall” for anything more complex than quick client dashboards, as advanced transformations, Marketing Mix Modeling (MMM), and comprehensive LTV attribution are not supported.
Why are cost considerations a factor in users seeking alternatives? Whatagraph is positioned in the premium segment, with real costs often exceeding $400/month for agencies, typically starting around $229/month. It lacks a freemium plan and relies on custom quotes, making cost prediction difficult, especially as data source needs grow. The BigQuery export feature is an add-on with extra costs, and while white-labeling is included, competitors like Databox charge $250 for similar features.
What reliability and accuracy issues do users encounter? Users report issues with consistent platform reliability, including connector breakage and reauthentication requirements. Data accuracy concerns arise from “iOS or ad blockers,” leading to “black box” numbers that users find unsatisfactory.
How do data management and ownership constraints influence user decisions? Whatagraph operates as a closed environment, limiting exports unless add-ons are purchased, effectively locking data inside the platform. This restricts data ownership and control, making it difficult to access granular historical datasets or manage data effectively. Leaving Whatagraph requires rebuilding data pipelines and dashboards, limiting scalability.
What usability challenges do users face? Users experience glitches when editing simultaneously and a 7-day waiting period to re-add deleted integrations. Custom metrics creation can also be challenging, contributing to a steep learning curve for beginners despite its intuitive aspects.
Why are limited data refresh rates a concern for users? Whatagraph has limited data refresh rates, with some integrations updating only every 12-24 hours, not in real-time. This can hinder timely performance monitoring and decision-making for users requiring more current data.
What to Look for in an Whatagraph Alternative?
Whatagraph alternatives offer diverse capabilities in data integration, transformation, visualization, scalability, pricing, and support, addressing specific gaps in Whatagraph’s functionality. Whatagraph alternatives provide broader integration options, more advanced data transformation, and greater enterprise scalability. Whatagraph alternatives also offer more transparent and flexible pricing models, alongside varied customer support structures.
What are the key considerations for a Whatagraph alternative?
Key considerations for a Whatagraph alternative include integration needs, data transformation capabilities, visualization features, scalability, pricing models, and customer support. Data accuracy, user experience, future needs, security compliance, and automation features also represent critical evaluation points. Whatagraph alternatives address specific limitations in Whatagraph’s 55+ integrations, limited data transformation, and undisclosed pricing.
What integration needs and data sources should a Whatagraph alternative address?
Integration needs and data sources for a Whatagraph alternative should include broad native integrations, custom connectors, and API integrations for niche data sources. Data refresh frequency, offline/CRM data integration, and native data blending across multiple sources are also important. Data governance and compliance features for sensitive data are essential for robust data management.
How do Whatagraph alternatives compare in connector availability?
Whatagraph alternatives compare significantly in connector availability, ranging from 21 native Google platform connectors in Looker Studio to over 700 in Coupler.io. Whatagraph offers 55+ integrations, while Supermetrics provides around 60 data sources and Funnel.io offers 500+ integrations. Databox provides 100+ integrations, DashThis offers 34, and Klipfolio supports over 300 data sources.
Which Whatagraph alternatives offer all connectors on all pricing tiers?
Whatagraph, Windsor.ai, and Dataslayer offer all connectors on all pricing tiers. Supermetrics and Fivetran do not provide this universal access across all plans. Coupler.io, Databox, Geckoboard, and Funnel (for some integrations) also offer all connectors on all pricing tiers. This feature ensures consistent access to data sources regardless of subscription level.
What specific platform support should a Whatagraph alternative provide?
A Whatagraph alternative should provide specific platform support for Google Display & Video 360, Shopify, Constant Contact, WooCommerce, and BigCommerce. Support for ActiveCampaign, Klaviyo, and Mailchimp is also crucial for comprehensive marketing data aggregation. These integrations ensure broad coverage for common e-commerce and marketing automation platforms.
What data transfer capabilities do Whatagraph alternatives offer?
Whatagraph alternatives offer diverse data transfer capabilities, allowing data export to warehouses or BI tools. Whatagraph provides no-code data transfer to BigQuery and Looker Studio. Cyfe lacks data transfer capabilities, while Coupler.io can transfer data to BigQuery. Windsor.ai supports BigQuery, Snowflake, Azure SQL/blob, Amazon S3, MySQL, and PostgreSQL for $19/month.
How do Whatagraph alternatives integrate with reporting tools?
Whatagraph alternatives integrate with reporting tools such as Looker Studio, Power BI, Tableau, Google Sheets, and Excel. Whatagraph offers connectors for Looker Studio, Power BI, Tableau, Google Sheets, and Excel. Windsor.ai provides 94 Looker Studio connectors, Power BI, Tableau via API, Google Sheets, and Excel. Supermetrics offers 140 Looker Studio connectors, Power BI, Google Sheets, and Excel.
What data transformation and pipeline optimization features do Whatagraph alternatives provide?
Whatagraph alternatives provide data transformation and pipeline optimization features including cleaning, blending, and structuring raw marketing data. AI-enhanced transformation automates grouping, blending, and custom metric creation, as seen in Improvado. Advanced data modeling, custom formulas, and calculated metrics across sources are available in Funnel, Tableau, and Domo.
How do Whatagraph alternatives support custom metrics and data blending?
Whatagraph alternatives support custom metrics and data blending with varying capabilities. Whatagraph, Klipfolio, and Grow.com support custom metrics and dimensions. Databox offers custom metrics and data calculations in higher-priced plans. Whatagraph, Klipfolio, Grow.com, and Looker Studio (limited to 5 data sources per blend) offer data blending.
What visualization and dashboard capabilities do Whatagraph alternatives offer?
Whatagraph alternatives offer visualization and dashboard capabilities including flexible, customizable dashboards with interactive UIs. Advanced features include drill-downs, filters, custom widget/chart types, dynamic calculated metrics, and embedding options. Multi-user collaboration, responsive design, and scheduled report exports enhance usability.
How do Whatagraph alternatives compare in white-labeling and customization?
Whatagraph alternatives compare in white-labeling and customization, with Whatagraph offering fully white-labeled reports including custom colors, logos, and domains. Coupler.io also provides white-label reporting. Databox offers white-labeling as a $250 add-on, while DashThis and Klipfolio include white-label options on higher plans.
How do Whatagraph alternatives compare in ease of use?
Whatagraph alternatives compare in ease of use, with Whatagraph being user-friendly, offering templates and drag-and-drop functionality. Supermetrics, Klipfolio, and TapClicks have steep learning curves. Cyfe has a “clunky interface” requiring multiple clicks and manual effort, with no template saving.
What scalability and enterprise readiness features do Whatagraph alternatives offer?
Whatagraph alternatives offer scalability and enterprise readiness features such as support for growing data volumes, multi-region warehouses, and advanced security. Enterprise-grade features include customizable compliance policies, multi-cloud data management, and integration with enterprise identity providers (SSO, SAML). Improvado and Looker Studio Pro offer enterprise-grade features.
What pricing models and flexibility do Whatagraph alternatives exhibit?
Whatagraph alternatives exhibit diverse pricing models and flexibility, with transparency varying across platforms. Pricing can be based on data volume, user seats, dashboards, or connectors. Hidden costs for custom connectors, data storage, or professional services are common. Contract terms, trial programs, and total cost of ownership also influence pricing flexibility.
How do Whatagraph alternatives compare in free trial availability and pricing transparency?
Whatagraph alternatives compare in free trial availability and pricing transparency, with Whatagraph requiring business details and sales engagement for a demo. Coupler.io offers a 7-day free trial and a free forever plan. Databox provides a 14-day free trial and a free forever plan. Windsor.ai, Fivetran, and Dataslayer offer free trials or free forever plans without sales interaction.
What professional services and customer support do Whatagraph alternatives provide?
Whatagraph alternatives provide professional services and customer support, with Whatagraph offering fast live chat (1-minute reply) and a dedicated CSM for all plans. Improvado includes professional services in all plans. Looker Studio offers no customer support. Coupler.io provides responsive customer support without chatbots.
How do Whatagraph alternatives compare in data accuracy and reliability?
§Whatagraph alternatives compare in data accuracy and reliability, with Whatagraph boasting 99.95% uptime and 30-minute consistent data refresh. Looker Studio reports are often broken and inaccurate. Supermetrics users report broken connectors and unreliable reports. Funnel.io has complaints about download source errors and inaccurate data with third-party visualization tools.
What data refresh rates do Whatagraph alternatives offer?
Whatagraph alternatives offer varied data refresh rates. Whatagraph refreshes data every 30 minutes across all integrations and pricing plans. Cyfe’s refresh rate depends on each data source. Databox’s refresh rate varies from 1 to 24 hours. Klipfolio offers refresh rates from 15 minutes to 1 hour.
What security and compliance standards do Whatagraph alternatives meet?
Whatagraph alternatives meet various security and compliance standards. Whatagraph, Windsor.ai, Supermetrics, and Fivetran are SOC2 Type 2 compliant. Dataslayer is not SOC2 Type 2 compliant. All listed alternatives offer single sign-on (SSO) and multi-factor authentication (MFA) for enhanced security.
What automation features do Whatagraph alternatives include?
Whatagraph alternatives include automation features such as data refresh, anomaly detection, and reporting. Improvado offers real-time alerts and AI capabilities for anomaly detection, which Whatagraph lacks. Whatagraph provides automated report delivery to inboxes. Looker Studio cannot automate reports.
What advanced features do Whatagraph alternatives offer?
Whatagraph alternatives offer advanced features including AI, alerts, and insights. Whatagraph launched AI summaries and Chatbot insights in January 2025, with ad spend alerts planned for April 2025. Databox provides AI summaries, insights notifications, and KPI scorecards. DashThis lacks advanced business insights or forecasting capabilities.
What data storage and warehousing options do Whatagraph alternatives provide?
Whatagraph alternatives provide diverse data storage and warehousing options. Whatagraph offers no-code data transfer to BigQuery and Looker Studio. Coupler.io can transfer data to BigQuery. Funnel.io stores data with a built-in data warehouse for 2 years. Windsor.ai supports BigQuery, Snowflake, Azure SQL/blob, Amazon S3, MySQL, and PostgreSQL.
What target audience and best fit do Whatagraph alternatives serve?
Whatagraph alternatives serve diverse target audiences and best fits. Whatagraph is best for streamlining client reporting for medium to large marketing agencies with 10+ employees. Looker Studio suits freelancers and boutique agencies. Coupler.io targets marketers, small businesses, and analysts. Funnel.io is ideal for big companies or marketing agencies with multiple clients.
What are Whatagraph’s areas for improvement that alternatives can address?
Whatagraph’s areas for improvement that alternatives can address include expanding integrations beyond 55+, offering more data transfer destinations, and enhancing flexibility and scalability. Whatagraph lacks the ability to define custom metrics across platforms or export raw data to a warehouse. Whatagraph also has limited BI tool integration and data transformation capabilities.
Why is Search Atlas the Best Whatagraph Alternative?
Search Atlas is the best Whatagraph alternative for three because it offers AI-first SEO automation for hands-on tasks, provides a significantly lower price point starting at $99/month, and focuses on automating SEO execution rather than just reporting.
How does AI-first SEO automation make Search Atlas a superior alternative? Search Atlas is an AI-first platform designed to automate hands-on SEO tasks, including technical fixes, content improvements, and link-building. Its OTTO SEO AI assistant can implement direct site changes, and the LLM Visibility tool tracks mentions in AI chats. This contrasts with Whatagraph, which solely focuses on reporting and analytics, not actual SEO work.
Why is Search Atlas’s pricing a key advantage? Search Atlas offers a starter plan at $99/month, making it considerably more affordable than Whatagraph, which starts at $229/month (billed annually). This lower cost allows agencies to automate repetitive SEO tasks and implement changes quickly across many client sites, saving significant time and budget compared to Whatagraph’s reporting-centric, higher-priced model.
What makes Search Atlas’s focus on SEO execution beneficial? Search Atlas excels at automating and executing SEO tasks, providing a solution for agencies that need to implement changes and improve client site performance directly. While Whatagraph automates and summarizes client reporting, it does not perform any SEO work itself. Therefore, for agencies whose primary need is automated SEO implementation, Search Atlas offers a direct solution that Whatagraph does not provide.


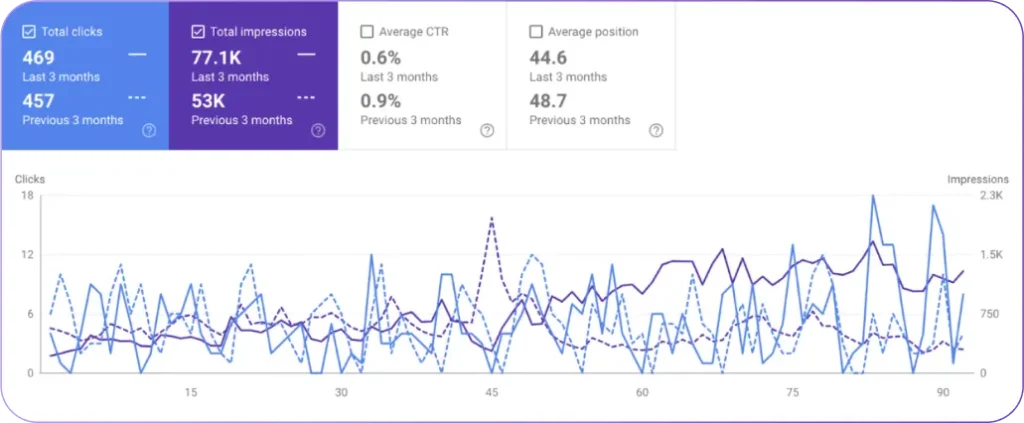
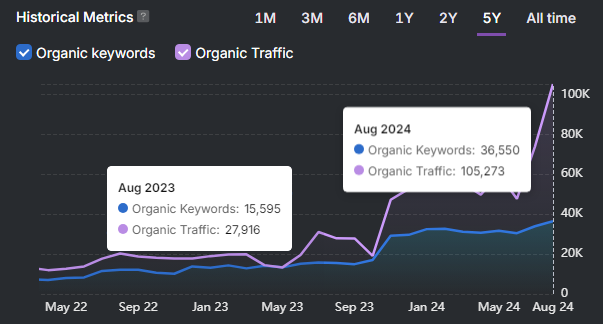
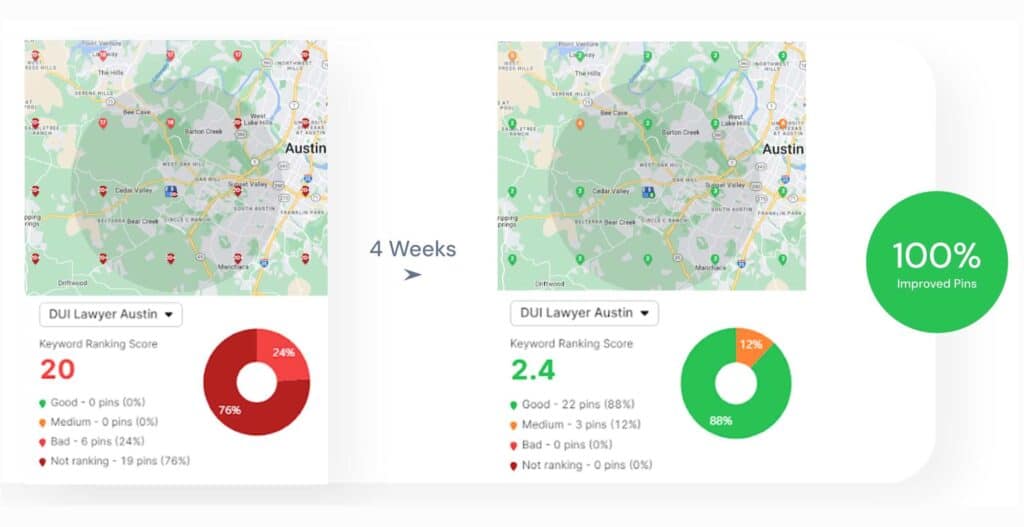
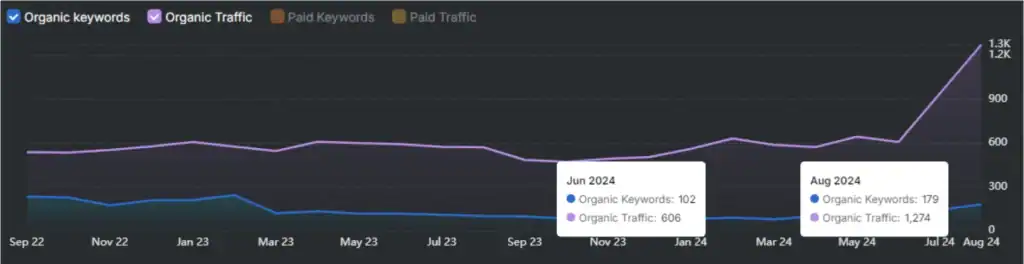