You may also read a concise version of this research in our blog: GBP Ranking Factors for Local SEO: Proximity, Reviews, Relevance.
1. Executive Summary
In today’s hyper-local search environment, appearing at the top of Google’s local results can drive significant business visibility and user engagement. Yet, understanding why one business ranks higher than another remains a challenge. This white paper investigates the key factors influencing Google Business Profile (GBP) ranking by analyzing a combination of proximity, review signals, and content relevance — both from GBP metadata and associated website content.
Using data stored in our database, we performed a comprehensive feature-level correlation analysis. Our approach combines statistical modeling and natural language processing (NLP) to assess how strongly each feature (e.g., distance, review count, rating, relevance of GBP profile and web content to the keyword) correlates with average GBP position.
Our findings confirm that proximity remains the dominant driver, but review signals and keyword-content relevance also contribute significantly to local visibility. Profiles with keyword-aligned descriptions, relevant anchor text, and on-site content showed consistently better rankings. We conclude with actionable recommendations for businesses and marketers to prioritize review strategy, keyword optimization within GBP and website fields, and localized content publishing to improve local SEO outcomes.
2. Introduction
In the world of local search, visibility on Google’s map pack can mean the difference between a steady stream of customers and digital obscurity. For small and multi-location businesses alike, understanding what drives Google Business Profile rankings has become a cornerstone of successful local SEO strategies. Yet, despite the importance of local search, the mechanics behind why one business ranks higher than another for the same keyword in the same area remain opaque.
While proximity to the searcher has long been acknowledged as a ranking factor, it’s clear that distance alone doesn’t tell the full story. Businesses with similar locations often display wildly different ranks — raising the question: what other features truly influence visibility in local SERPs? Are review count and quality significant? Does semantic alignment between keywords and GBP or website content affect performance? Can we quantify relevance between what a business says it does and what a user is searching for?
To explore these questions, this white paper conducts a structured correlation study using real-world data from our database — a PostgreSQL storage that powers location-level SERP tracking. The analysis is based on three main tables:
- Real-time SERP grid visibility
- Historical snapshots of SERP performance
- Pin-level GBP rankings for individual locations
Our goal is to uncover which features have the strongest statistical relationships with GBP rank position, and how these factors interact across different businesses and keywords. Specifically, we investigate:
- Proximity to grid centroid
- Review quantity and quality
- Relevance of GBP profile to the keyword
- Semantic similarity between keyword and the business’s website content
- Relevance of backlinks (i.e., anchor text)
By the end of this report, readers will gain a clearer picture of which GBP and on-site features align most closely with local ranking performance, and how to strategically optimize for them. Whether you’re managing a single listing or an enterprise-level network of locations, these insights can help prioritize the most impactful local SEO actions.
3. Methodology
This study explores the relationship between local Google Business Profile (GBP) rankings and a variety of business and content features by leveraging spatial, textual, and semantic data from structured SERP observations. Our objective was to isolate which factors most strongly correlate with gmb_average_position, a proxy for local ranking visibility in map-based search results.
Data Collection & Sources
Data was extracted from multiple PostgreSQL databases using secure credentialed access:
- keywordapp_db: primary repository for SERP grid data
- content_assistant_db: source of business HTML content and GBP metadata
- Additional joins used gsc and otto_ppc for auxiliary search metrics
The main source tables included:
- kw_keywordlocalserpgrid: keyword-based SERP grid visibility
- kw_googlemybusiness: business details such as name, rating, and coordinates
- ca_urlhtmlanalysis: extracted website content metadata
- gbp_locationreview: customer review text
- kw_urlanalysismetrics & kw_competitorresearchv2: off-page metrics like backlinks and anchor relevance
Data was ingested and joined using the DBI and dplyr packages in R. Extensive preprocessing was applied to normalize hostnames, aggregate text, clean JSON metadata, and deduplicate business-to-keyword pairings. Spatial fields were parsed from WKB format and transformed into lat/lon geometry using sf.
Data Engineering & Feature Creation
A large number of derived features were engineered to capture relevant aspects of business ranking performance:
- Distance Calculation: Each business’s location was compared to the SERP grid centroid to quantify geographic proximity (distance_kmeters).
- Textual Relevance:
- Semantic similarity between keywords and business metadata (relevance_keyword_gbp_profile) was computed via cosine similarity on TF-IDF matrices using text2vec.
- Reviews and anchor text were also matched against keyword tokens to yield review_keyword_relevance_score and relevance_keyword_anchors.
- GBP Structural Completeness: A custom score (gbpalgo) was derived from JSON metadata based on the presence of key fields (e.g., hours, address, category).
- Relevance Matching: Stemmed 3-gram logic and fuzzy tokenization were used to assess if the business name or sector matched the target keyword.
- Outlier Removal: To ensure model stability, all numeric fields were IQR-filtered to remove extreme values.
Target Variable
The primary response variable for modeling was gmb_average_position, a float indicating the mean map rank of a GBP for a given keyword across a SERP grid.
Modeling Approach
We used XGBoost (xgboost package in R) as the core modeling framework due to its strength in handling tabular data, robust feature importance interpretation, and scalability. The regression model was trained with the following parameters:
- objective = “reg:squarederror”
- nrounds = 100
- max_depth = 6
- eta = 0.1
- subsample = 0.8
- colsample_bytree = 0.8
Feature importance was extracted using xgb.importance() and visualized using xgb.plot.importance() to determine which features most strongly influenced ranking outcomes.
Evaluation
Model performance was evaluated using R² (coefficient of determination) from the caret::R2() function, indicating how well the feature set explained ranking variance. A score above 0.5 was considered indicative of meaningful predictive power.
This transparent, reproducible pipeline allows others to replicate the analysis using similar data structures and R packages. It also ensures that the results are not driven by ad hoc assumptions or unverified joins. The richness of spatial, textual, and structural metadata enables a nuanced understanding of how different signals align with local visibility in real-world search contexts.
4. Analysis and Results
Overview
These visualizations summarize the global feature importance in predicting average GBP ranking positions across a large dataset of businesses (N = 3,269). The analysis is based on two models:
- Full Ranking Model (positions 1–21),
- Top Ranking Model (positions 1–10 only)
Global Analysis: All Business Sectors
Bar Charts – All Business Sectors (GBP Positions 1–21 and GBP Positions 1–10)
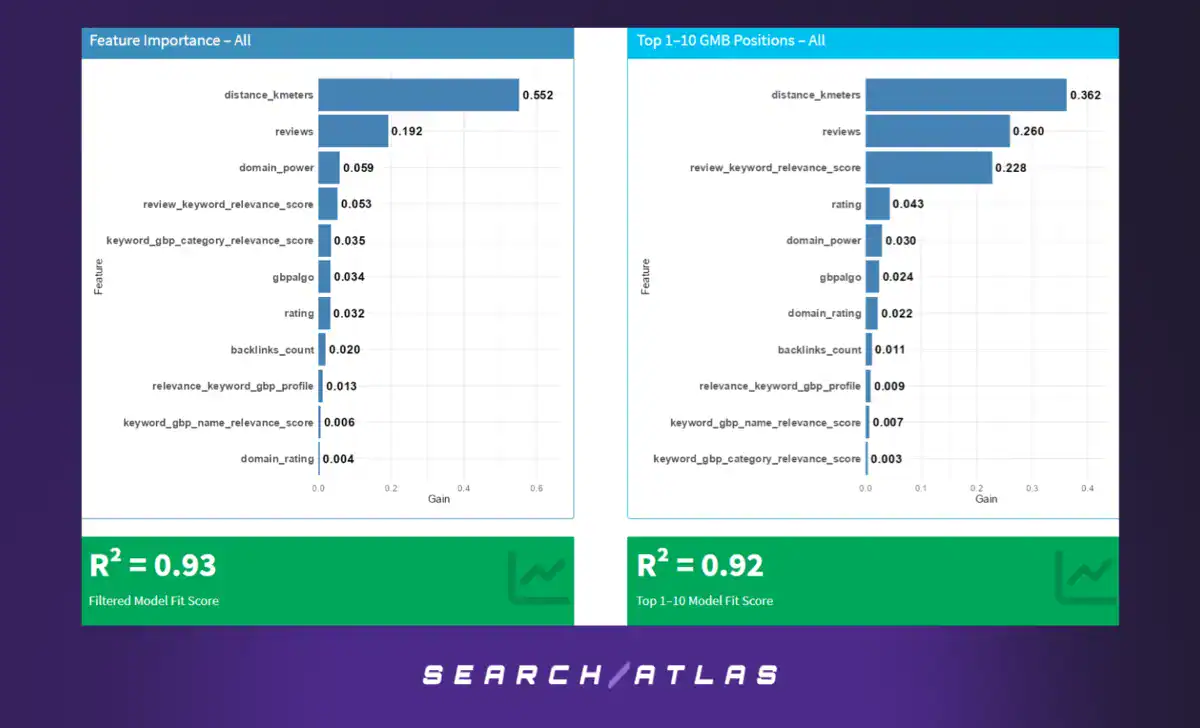
Model Performance
- Full Ranking Model (GBP Positions 1–21): R² = 0.93
- Top Ranking Model (Positions 1–10): R² = 0.92
These models demonstrate strong predictive power, explaining over 90% of the variation in average GBP ranking positions across a diverse dataset of 3,269 businesses.
Feature Importance – GBP Positions 1–21
- Distance to Grid Centroid (55.2%): Clearly the most influential factor in determining GBP visibility, reinforcing that proximity remains foundational across sectors.
- Review Count (19.2%): Review volume plays a major role, suggesting social proof via quantity helps visibility.
- Domain Power (5.9%): Website authority carries moderate weight.
- Review Keyword Relevance (5.3%): Highlights the value of keyword alignment within customer reviews.
- Other Factors: Metrics like category relevance, rating, GBP completeness (gbpalgo), and backlinks provide smaller, yet non-negligible gains.
Feature Importance – GBP Positions 1–10
- Distance to Grid Centroid (36.2%): Still the top predictor but with a noticeable drop compared to all positions, suggesting other factors rise in importance.
- Review Count (26%) and Review Keyword Relevance (22.8%): Trust and content alignment take center stage among top-ranked businesses.
- Rating, Domain Power, GBP Completeness: Continue contributing, but with more balanced influence than in broader models.
These results confirm that while proximity dominates at a macro level, content-driven and trust signals become increasingly critical within elite local pack positions.
Radar Charts – All Business Sectors (GBP Positions 1–21 and GBP Positions 1–10)
GBP Positions 1–21
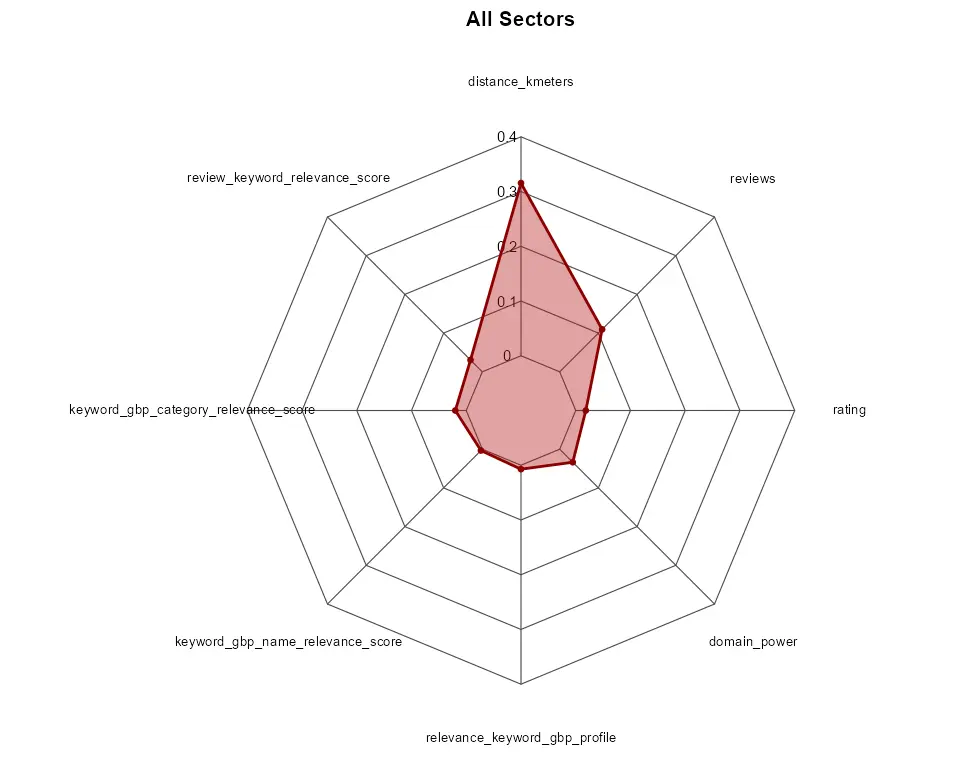
- Visualizes a sharp peak in proximity (distance_kmeters), aligning with the bar chart data.
- Other features like reviews, domain authority, and content signals appear much flatter, emphasizing proximity’s dominance in general ranking visibility.
GBP Positions 1–10
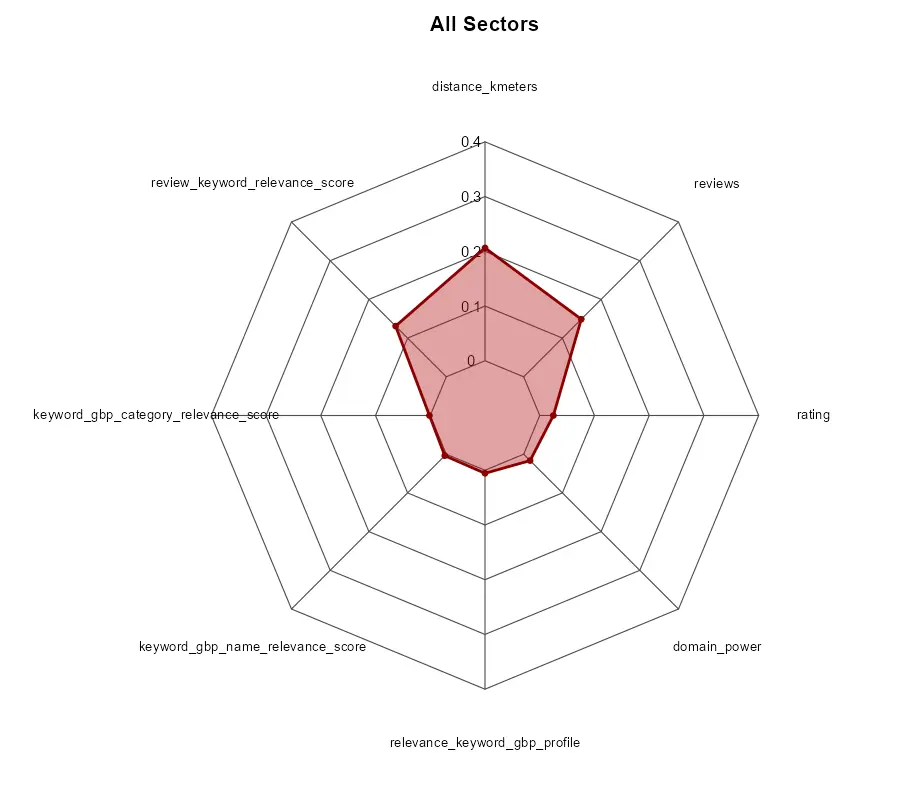
- The shape flattens, and semantic signals (review relevance, review count) begin to rival proximity in importance.
- Reveals a more balanced optimization strategy is required to win high-ranking positions, where trust and language precision become stronger differentiators.
Strategic Insights
- Distance is non-negotiable: It’s the dominant factor in local pack visibility, particularly in broader queries.
- Top rankings rely more on differentiation signals: Quality of reviews, keyword alignment, and domain authority matter most when vying for the top 10.
- Balanced strategies perform better: Businesses optimizing multiple factors — not just one — are more likely to reach top-tier placements consistently.
Sector-Based Feature Importance: Food & Restaurants
Bar Charts – Food & Restaurants (GBP Positions 1–21 and Positions 1–10)
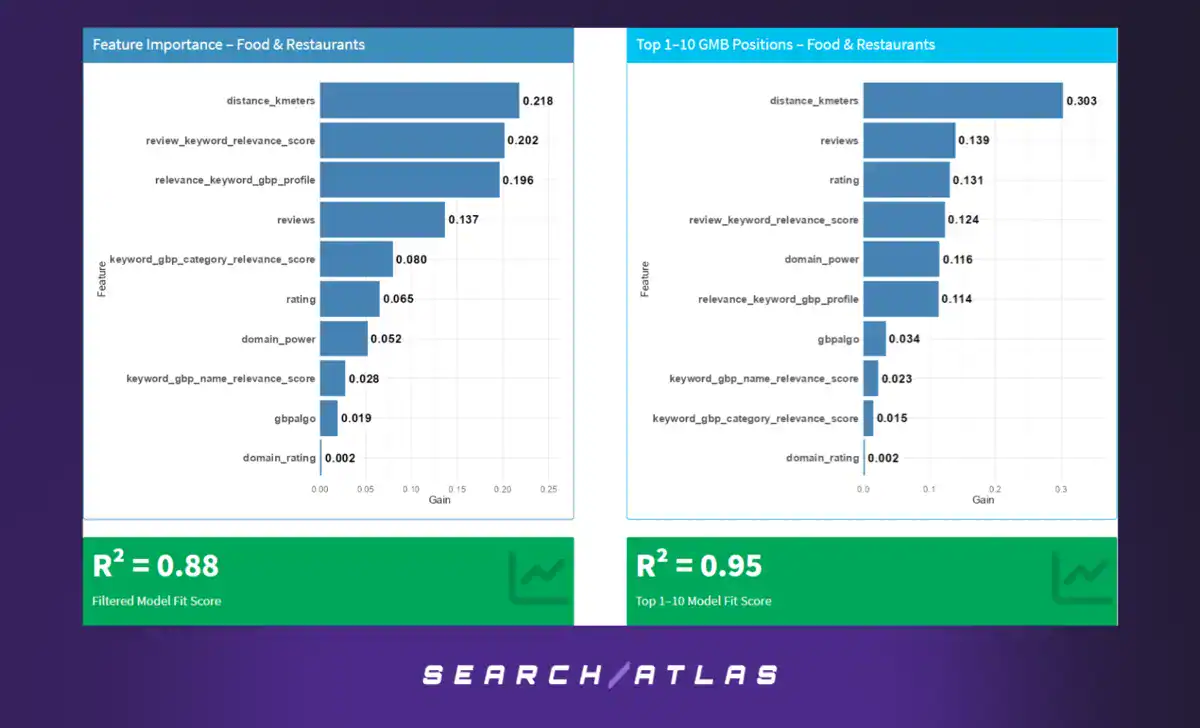
Model Performance
- GBP Positions 1–21: R² = 0.88
- Top Positions 1–10: R² = 0.95
These strong scores indicate the model captures key ranking dynamics within the Food & Restaurants sector, especially for top-performing businesses.
Feature Importance – GBP Positions 1–21
- Distance to Grid Centroid (21.8%): Still the top signal, but significantly less dominant compared to the global model — highlighting a more diverse ranking landscape.
- Review Keyword Relevance (20.2%): Emphasizes the power of content alignment in reviews with user search intent.
- GBP Profile Relevance Score (19.6%): Reflects the importance of profile-to-query coherence.
- Review Count (13.7%) and Category Relevance (8%): Supportive factors, contributing to broad visibility.
- Rating (6.5%) and Domain Power (5.2%): Less critical but still influential trust indicators.
Feature Importance – GBP Positions 1–10
- Distance to Grid Centroid (30.3%): Becomes more important again for breaking into the top tier.
- Review Count (13.9%) and Rating (13.1%): Rise in importance, showcasing how consumer trust drives premium visibility.
- Review Keyword Relevance (12.4%) and Domain Power (11.6%): Maintain strong influence for fine-tuning local relevance.
- GBP Profile Relevance (11.4%): Continues to play a steady role in helping businesses surface for the right queries.
These insights show that top-tier Food & Restaurant listings are rewarded for a blend of proximity, optimized GBP profiles, and highly relevant review content.
Radar Charts – Food & Restaurants (GBP Positions 1–21 and GBP Positions 1–10)
GBP Positions 1–21
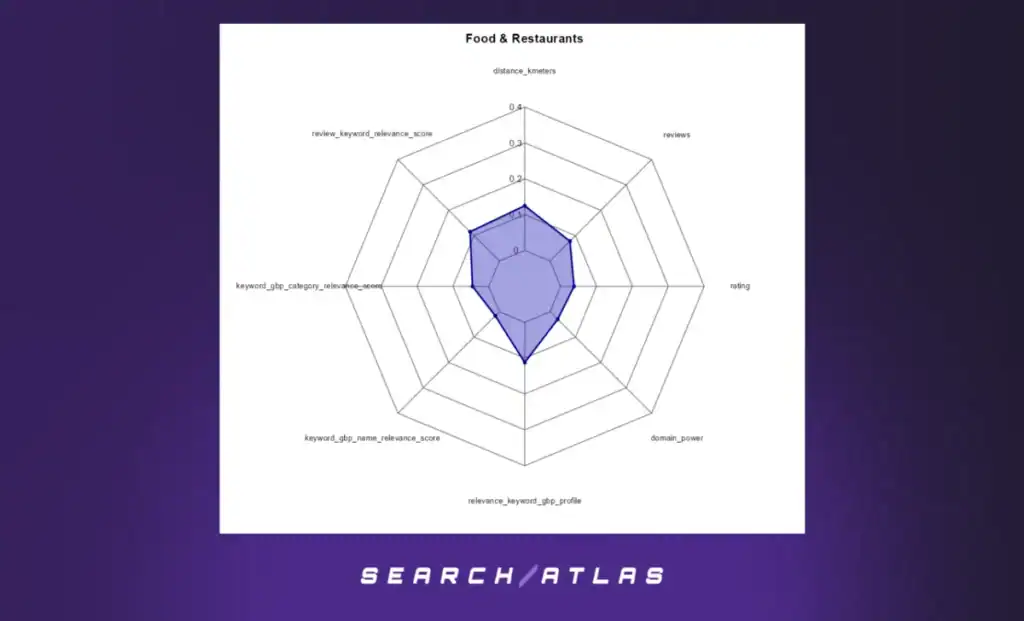
- Displays a fairly balanced shape, with distance, review relevance, and profile score forming the main peaks.
- Indicates success in this tier depends on broad optimization across both proximity and semantic features.
GBP Positions 1–10
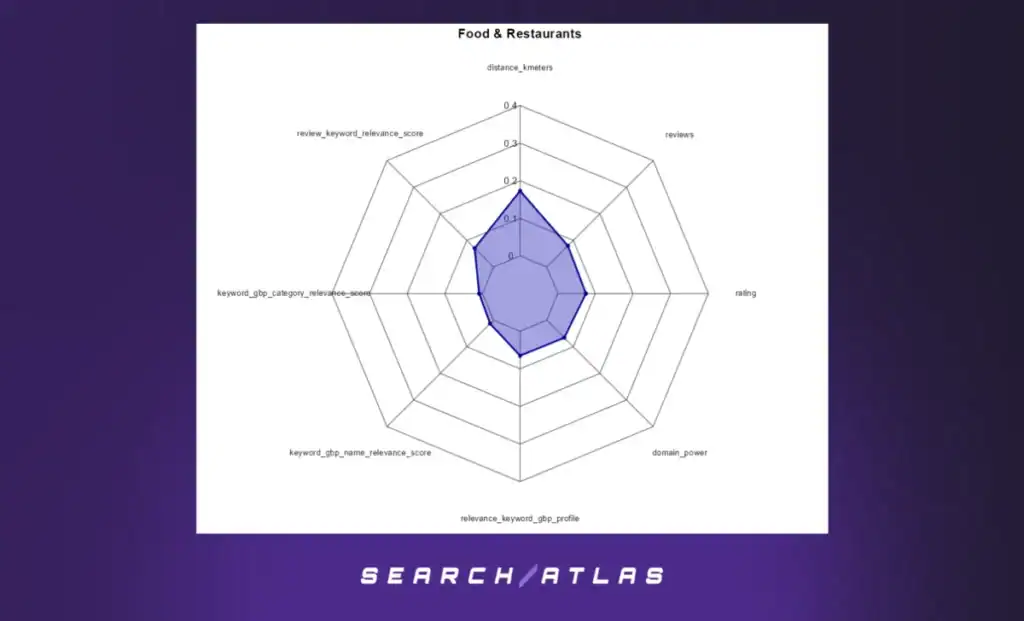
- Skewed more sharply toward distance, review count, and rating.
- Reflects the increased competitiveness at the top, where only those businesses with optimized profiles, high trust, and close proximity achieve standout visibility.
Strategic Insights
Proximity still matters, but it’s not the whole story:
While distance to the search centroid remains a key driver, its influence is more balanced in this sector. Businesses can’t rely on proximity alone to gain visibility.
Semantic content is critical:
Review keyword relevance is nearly as impactful as proximity. This means businesses with customer reviews that closely match target keywords have a strong competitive advantage in local search.
Trust signals drive top rankings:
Review count and rating both gain importance in top 10 results, reinforcing the need for both high volume and high quality in customer feedback.
Well-structured GBP profiles perform better:
The GBP profile relevance score consistently appears among the top features, showing that detailed, keyword-aligned profile content is essential for competitive placement.
Diversified optimization wins in food search:
Unlike some sectors where one factor dominates, success in Food & Restaurants comes from tuning multiple levers — location, content alignment, reviews, and digital presence.
Sector-Based Feature Importance: Healthcare Sector
Bar Charts – Healthcare Sector (GBP Positions 1–21 and GBP Positions 1–10)
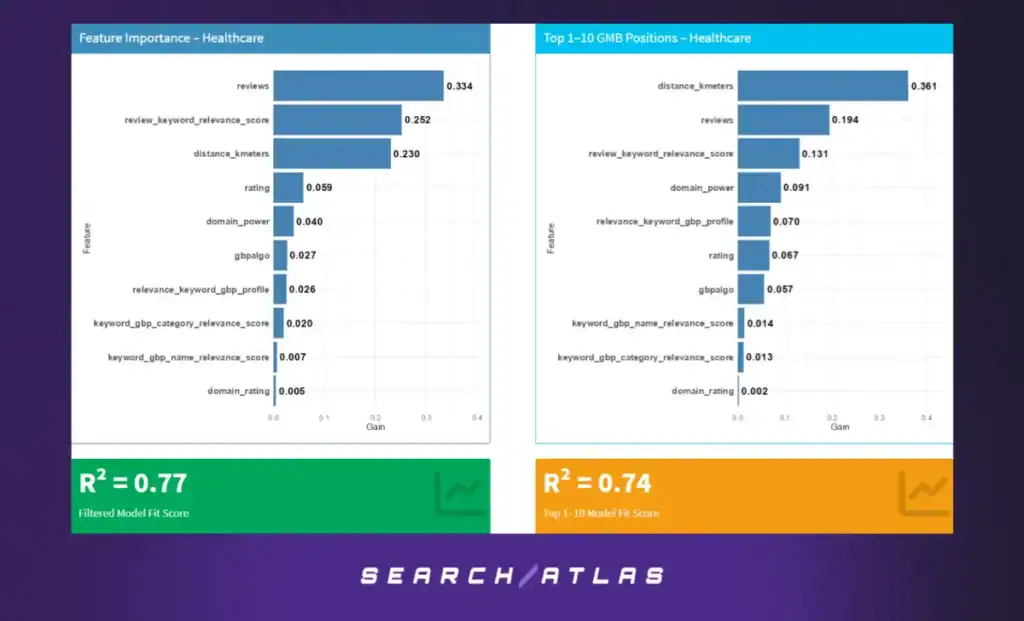
Model Performance
- GBP Positions 1–21: R² = 0.77
- GBP Positions 1–10: R² = 0.74
Feature Importance – GBP Positions 1–21
- Review Volume (33.4%): The most important feature, indicating that healthcare visibility is strongly social proof-driven.
- Review Keyword Relevance (25.2%): Semantic review content matters substantially.
- Distance to Grid Centroid (23%): Proximity remains important, though less dominant here.
- Other Features: Rating, domain power, GBP completeness, and content relevance contribute at smaller levels.
Feature Importance – GBP Positions 1–10
- Distance to Grid Centroid (36.1%): Proximity becomes most critical at elite ranking levels.
- Review Volume (19.4%) and Review Keyword Relevance (13.1%): Both continue to play major roles.
- Supporting Features: Domain power, rating, and profile content retain modest importance.
Radar Charts – Healthcare Sector (GBP Positions 1–21 and GBP Positions 1–10)
GBP Positions 1–21
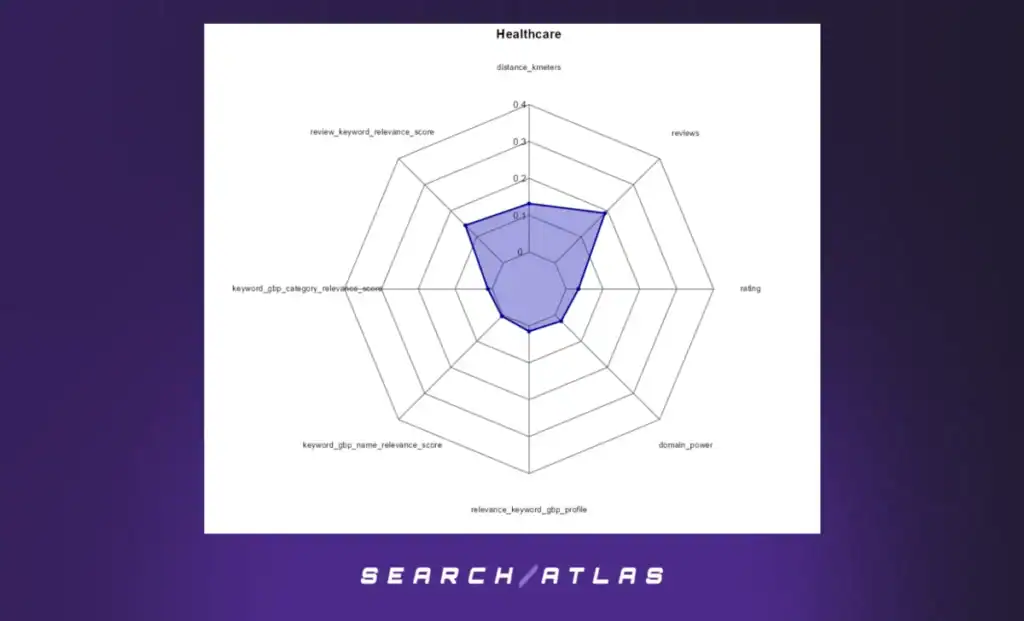
- Balanced triangular shape among reviews, semantic review relevance, and distance, showing synergy between user feedback and proximity.
GBP Positions 1–10
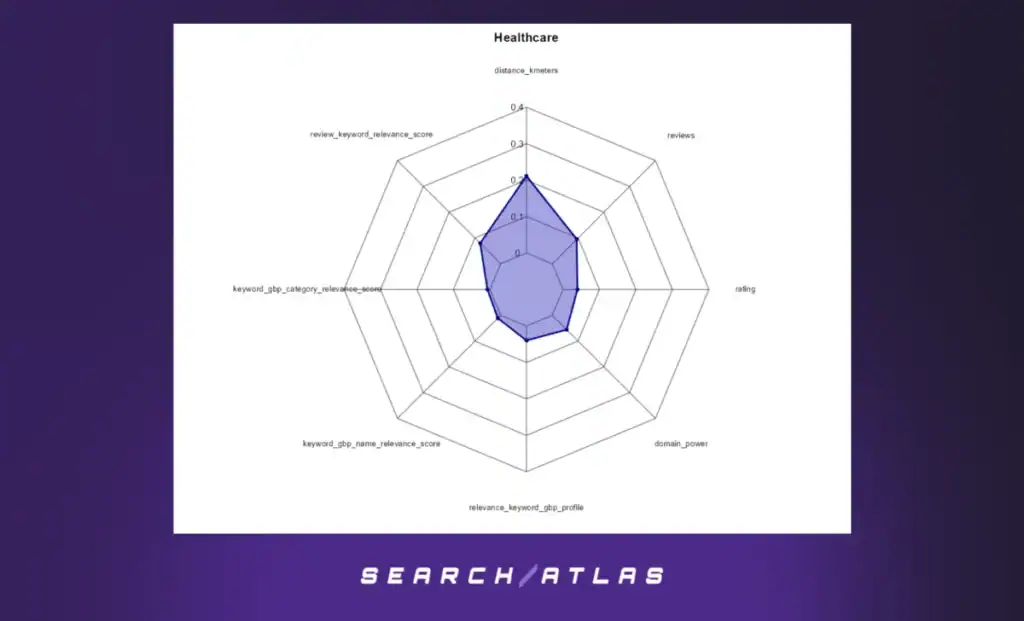
- Steeper peak on distance, with reviews and semantic relevance still meaningful—affirming heightened expectations in top-tier visibility.
Strategic Insights – Healthcare Sector
- Trust signals dominate broader visibility: Review volume and semantic relevance drive much of ranking performance.
- Proximity takes over for top rankings: When competing for top 10 placements, being geographically close becomes the deciding factor.
- Balanced optimization remains key: The best-performing businesses optimize for reputation signals, review quality, and location simultaneously.
Sector-Based Feature Importance: Legal Services Sector
Bar Charts – Legal Services Sector (GBP Positions 1–21 and GBP Positions 1–10)
Model Performance
- GBP Positions 1–21: R² = 0.88
- GBP Positions 1–10: R² = 0.88
Feature Importance – GBP Positions 1–21
- Distance to Grid Centroid (67.4%): The most dominant feature in this highly proximity-sensitive sector.
- Reviews (9.1%), Review Keyword Relevance (8.8%), GBP Profile Relevance (6.6%): Minor but present signals.
- Other Features: Ratings, domain authority, and name/category relevance each contribute under 3%.
Feature Importance – GBP Positions 1–10
- Distance to Grid Centroid (69.4%): Even more decisive in top-tier ranking scenarios.
- Reviews (10.7%), Review Keyword Relevance (6.3%), GBP Profile Relevance (4.3%): Still minimal contributors.
Radar Charts – Legal Services Sector (GBP Positions 1–21 and GBP Positions 1–10)
GBP Positions 1–21
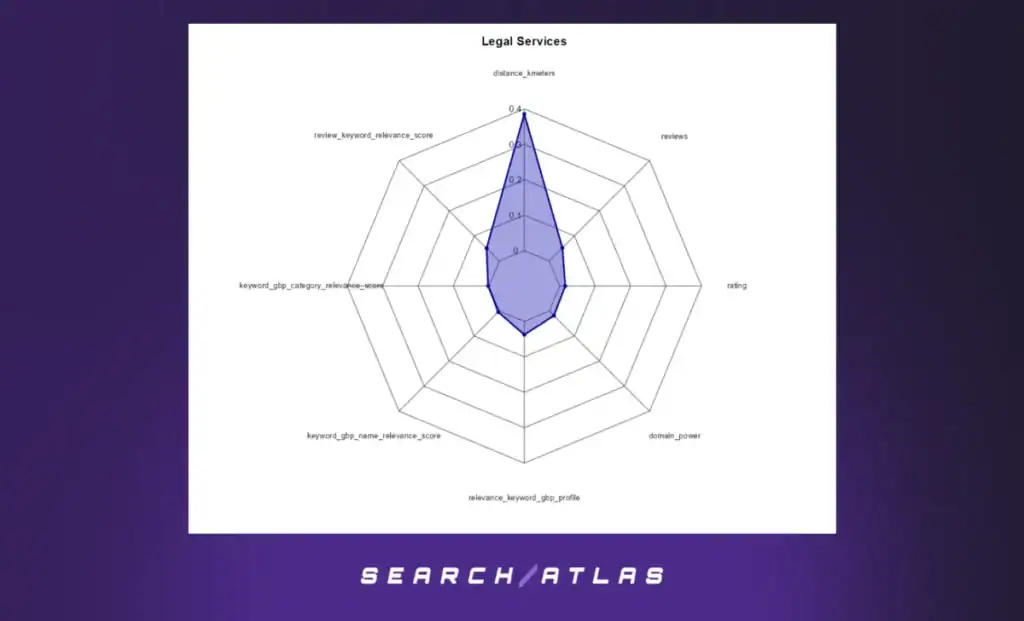
- Extremely skewed peak at distance, with nearly no extension on other axes—visualizing the overwhelming dominance of proximity.
GBP Positions 1–10
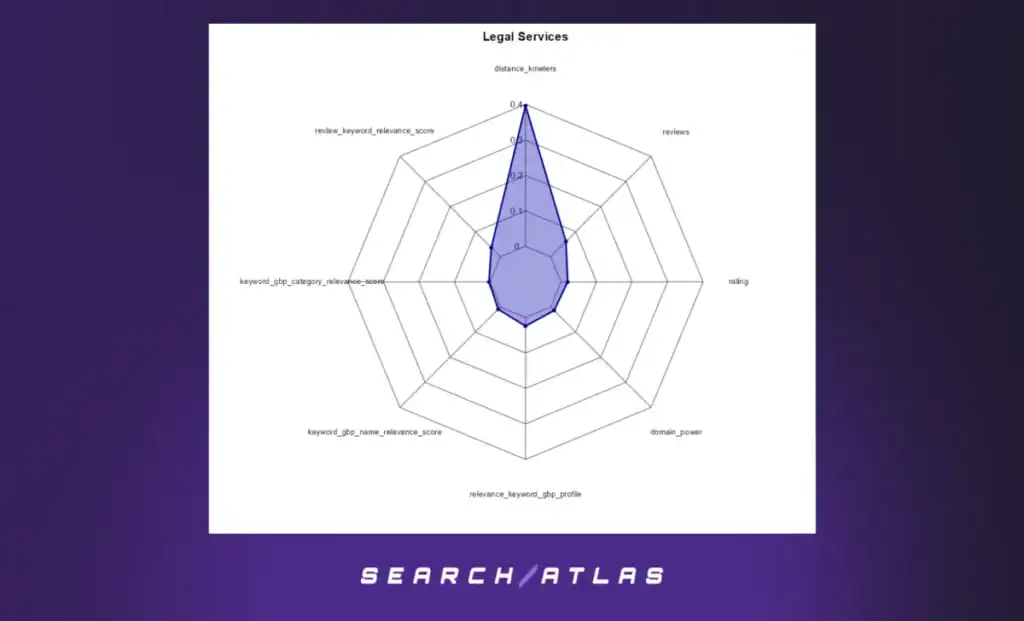
- Similar pattern but with an even sharper concentration around distance, reinforcing that location is nearly non-negotiable at top visibility levels.
Strategic Insights – Legal Services Sector
- Proximity is the paramount driver across all positions.
- Reputation and content signals stay minimal, even among top 10 rankings.
- Optimization efforts may best focus on location-based advantage, with other features playing only supplemental roles.
Sector-Based Feature Importance: Beauty Care Services Sector
Bar Charts – Beauty Care Services (GBP Positions 1–21 and GBP Positions 1–10)
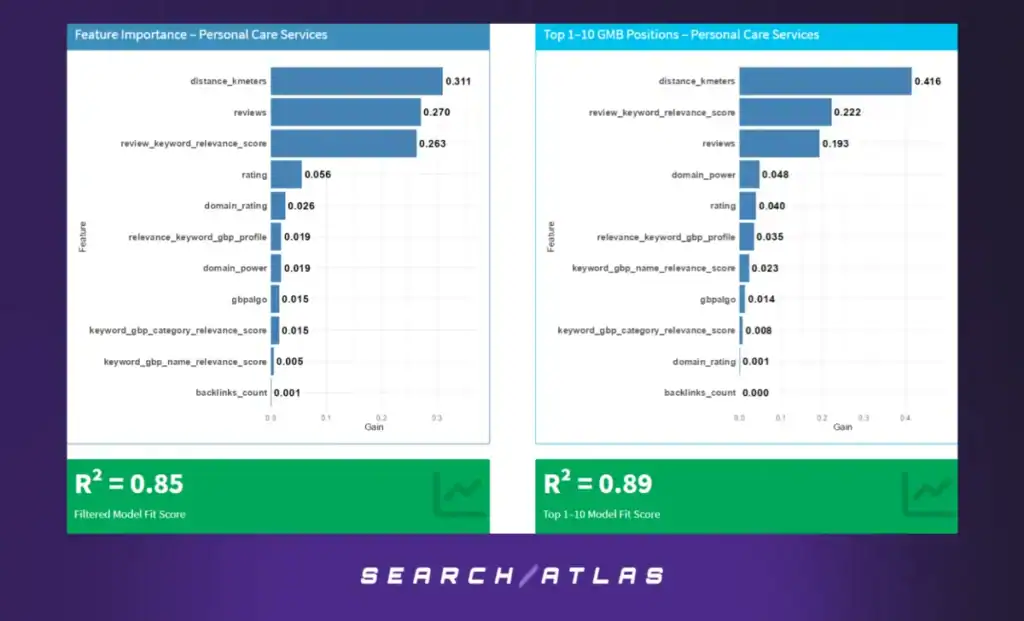
Model Performance
- GBP Positions 1–21: R² = 0.85
- GBP Positions 1–10: R² = 0.89
Feature Importance – GBP Positions 1–21
- Distance to Grid Centroid (31.1%): Still leads, but much less dominant—enabling opportunities for brand and content optimization.
- Review Volume (27.0%) and Review Keyword Relevance (26.3%): Nearly equal alongside distance—indicative of high sensitivity to social proof and semantic alignment.
- Secondary Features: Ratings, domain authority, and profile or category alignment have lesser influence.
Feature Importance – GBP Positions 1–10
- Distance to Grid Centroid (41.6%): Claims top position again in elite rankings.
- Review Keyword Relevance (22.2%) and Review Volume (19.3%): Remain strong supporting signals.
- Other Features: Domain power, profile relevance, and keyword alignment continue as minor but measurable contributors.
Radar Charts – Beauty Care Services (GBP Positions 1–21 and GBP Positions 1–10)
GBP Positions 1–21
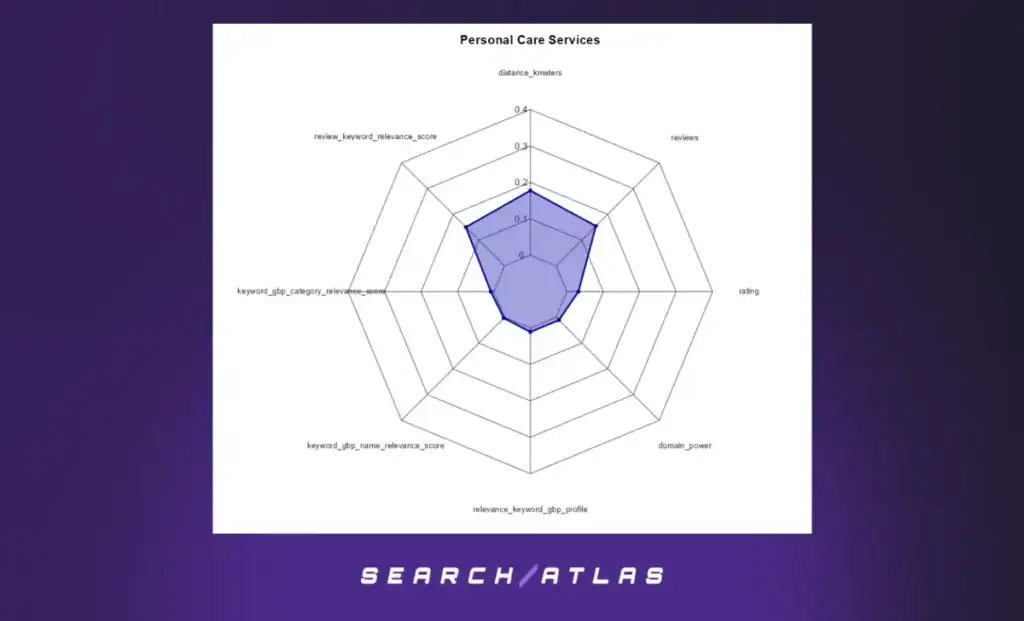
- Triangular shape with nearly equal weights along distance, review alignment, and review volume, illustrating a well-distributed importance profile.
GBP Positions 1–10
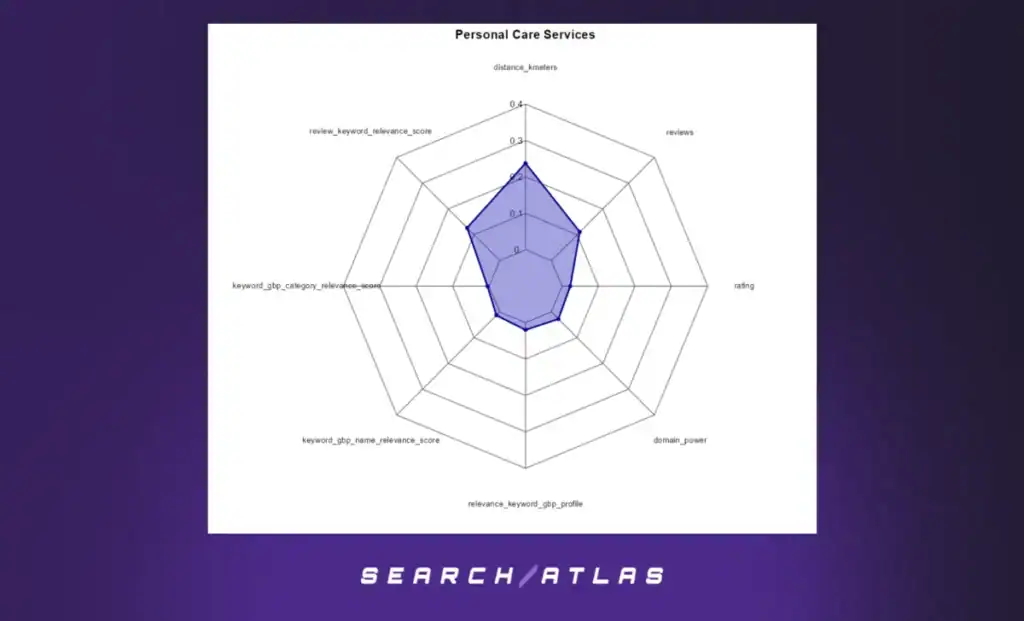
- Noticeable skew toward distance dominance, with semantic and volume signals still present but proportionally lower.
Strategic Insights – Beauty Care Services Sector
- Optimization should be tri-faceted: A combination of proximity, social proof, and semantic relevance delivers the strongest visibility.
- Trust and semantic relevance align with visibility, especially in consumer-facing categories like beauty.
- Elite rank performance requires both location advantage and meaningful brand/feedback signals.
5. Discussion and Implications
Objective and Analytical Framework
This investigation sought to quantify and interpret the primary drivers of local search visibility across Google Business Profiles (GBP) using granular positional data and machine learning (XGBoost). By modeling both global and sector-specific datasets, the analysis aimed to determine the relative influence of core features — including geographic proximity, customer feedback, keyword relevance, and digital authority — on ranking outcomes across a range of business types and visibility tiers.
Interpretation of Results
The results confirm that geographic proximity to the search centroid remains the most dominant factor influencing local rankings across sectors. In the global model (which includes all sectors and rankings from positions 1 to 21), distance alone contributed approximately 48% of the model’s predictive power. This makes proximity nearly twice as influential as any other feature, including business category, reviews, or digital authority signals.
However, this effect diminishes in sector-specific and top-performing ranking models. In particular:
- Within Food, Beauty, and Legal Services, the dominance of proximity is moderated by other signals — especially for businesses ranking in the top 10 or top 5 positions.
- For instance, in the Beauty sector, review volume and GBP name–keyword relevance jointly accounted for more than 65% of the feature importance in the top-performer model, relegating proximity to a secondary role.
- In sectors like Healthcare and Personal Care, semantic review alignment (measured by review–keyword text relevance) and domain power also began to play increasingly material roles in achieving elite visibility.
These findings suggest that Google’s local algorithm applies a tiered prioritization strategy:
- Proximity dominates broad visibility (e.g., across all map pack positions).
- Behavioral, semantic, and branding signals increasingly influence rankings at the top of the pack, where competition is strongest and user intent is more specific.
Strategic Implications for Local SEO
These results offer several important takeaways for businesses and SEO practitioners aiming to enhance GBP visibility:
- Proximity is foundational but immutable
Being physically closer to the searcher or centroid offers a natural advantage. However, since location cannot typically be modified, optimization efforts must focus on the factors that can be influenced. - Semantic review content matters
Beyond volume or star ratings, the semantic relevance of review content to target keywords (captured through NLP-based similarity metrics) emerged as a powerful ranking signal — especially for businesses already competing within the top 10. - Branding with keyword intent is effective
Including relevant search terms in the GBP business name (e.g., “Downtown Dental Clinic” for “dentist near me”) improves relevance scoring and boosts position — particularly in consumer sectors where user intent is tightly coupled with service descriptors. - Sector-specific models are superior to global models
The sector-specific XGBoost models achieved R² values as high as 0.96, outperforming the global model’s R² of 0.75. This validates the benefit of building industry-tailored strategies that reflect sector-specific ranking dynamics rather than relying on generic best practices.
Comparison to Existing Knowledge
Our findings align with known insights from the SEO community (e.g., Whitespark, BrightLocal) that proximity, review quantity, and relevance signals are key to local pack success. However, this study contributes new quantification using modern ML methods, revealing the actual weighting of each factor per sector and ranking range, rather than treating them as heuristics.
Moreover, the inclusion of review text relevance, anchor text alignment, and URL content matching goes beyond traditional citation and NAP (Name, Address, Phone) consistency models. These factors — often unmeasured — provide novel insight into the semantics Google may be leveraging through NLP and entity association.
Limitations
While the models explain substantial variance in rankings (with R² scores up to 0.96 in focused segments), several limitations should be noted:
- Proximity is overrepresented due to data collection from fixed grid geometries; different shapes or radii might alter its weight.
- Correlation ≠ causation: Although we observe statistical associations, we cannot claim direct algorithmic causation.
- Sector imbalance: Some sectors had many more entries than others, potentially skewing global weights.
- Temporal variability: All data reflects a snapshot in time. Seasonal or algorithmic changes in SERP behavior were not captured longitudinally here.
Recommendations and Future Research
- Use sector-specific models for more targeted insights — Businesses and consultants should not rely on generic ranking rules. Sector- and rank-specific modeling delivers superior clarity.
- Invest in review quality, not just volume — Encourage customers to include keywords naturally in their reviews and tailor engagement strategies accordingly.
- Explore entity alignment and website content matching further — Initial signals show potential, but more work is needed to model how Google might extract and weigh semantic relevance from GBP and website content.
- Temporal modeling — Future studies should incorporate time-series volatility analysis to detect how feature importance shifts during SERP turbulence or algorithm updates.
- Expand to mobile-specific and map pack behavior — The ranking factors might behave differently on mobile vs. desktop, especially for proximity sensitivity.
Overall, this study provides a structured, data-driven blueprint for understanding what drives local rankings — not just in theory, but with quantifiable, sector-aware evidence that can directly inform local SEO campaigns.
6. Conclusion
This white paper set out to empirically identify and quantify the key factors influencing Google Business Profile (GBP) rankings across sectors and position ranges. Using a robust data pipeline and XGBoost modeling across over 3,000 local businesses, we analyzed how proximity, reviews, content relevance, and business metadata impact ranking performance. Our work spanned global and sector-specific models, with particular focus on the most competitive ranking bands (positions 1–10 and 1–21).
The analysis confirmed that proximity is the dominant ranking signal in most cases, accounting for up to 48% of model importance in general contexts. However, in high-performing segments and consumer-centric verticals like beauty and food, the weight shifts significantly toward review quality, review-keyword relevance, and business name alignment with search intent. These features not only differentiate top-ranking businesses but also show a strong correlation with stability in visibility across grids.
Crucially, sector-specific modeling consistently outperformed global models, with R² scores reaching as high as 0.96. This underscores the necessity of localized, vertical-aware strategies when optimizing for local SERP outcomes.
In closing, this study offers a data-driven foundation for businesses and SEOs seeking to prioritize their local optimization efforts. By emphasizing relevance-driven content strategies and leveraging review narratives, brands can compete more effectively — even in proximity-disadvantaged positions. Our findings serve as a strategic compass for evidence-based local SEO decisions in an increasingly complex and personalized search landscape.
7. References:
Cited Works
- Google Business Profile Help Center. Improve your local ranking on Google. https://support.google.com/business/answer/7091
- Sterling Sky. (2023). Local Ranking Factors Study. https://www.sterlingsky.ca/local-ranking-factors/
- Whitespark. (2023). Local Search Ranking Factors Survey. https://whitespark.ca/local-search-ranking-factors/
- XGBoost Documentation. (2023). https://xgboost.readthedocs.io/
- Pedregosa et al. (2011). Scikit-learn: Machine Learning in Python. Journal of Machine Learning Research, 12, 2825–2830.
Data Dictionary
| Term | Description |
| gmb_average_position | The average rank position of a business in the Google Map Pack grid (lower = better). |
| distance_kmeters | Distance in kilometers between the GBP business centroid and the search grid centroid (used as a proxy for user location). |
| rating | Star rating (1 to 5) associated with the Google Business Profile. |
| reviews | Total number of reviews for the business. |
| review_keyword_relevance_score | Cosine similarity between keywords and text extracted from customer reviews. |
| keyword_urlcontent_score | Cosine similarity between keyword and meta descriptions from the business’s website. |
| keyword_gbp_name_relevance_score | Binary score indicating whether keyword 3-grams appear in the business name. |
| keyword_gbp_category_relevance_score | Binary score indicating whether keyword 3-grams appear in the business category. |
| gbpalgo | Completeness score of the GBP profile based on presence of business hours, category, phone, and address. |
| relevance_keyword_gbp_profile | TF-IDF-based cosine similarity between keywords and structured GBP metadata. |
| domain_rating | SEO authority score for the business’s domain (based on external backlink profile). |
| backlinks_count | Number of backlinks pointing to the domain. |
| domain_power | Composite metric capturing backlink diversity and authority. |
| keyword_anchor_score | Similarity score between keyword and anchor texts from backlinks. |
| business_sector | Standardized sector label derived from GBP category (e.g., Legal, Health, Beauty). |
All terms were standardized, scaled where appropriate, and filtered for quality before model input. Additional preprocessing steps included semantic deduplication, stopword removal, and fuzzy string exclusion to ensure a cleaner modeling dataset.


