You may also read a concise version of this research in our blog: [Visibility Redistribution Across SEO and GEO: 61 Industry Study]
Executive Summary
The search landscape is undergoing a structural shift from traditional search engine optimization (SEO) toward generative engine optimization (GEO), where visibility in AI-generated answers increasingly determines brand exposure. This study quantifies the impact of that shift on industries at scale.
We analyzed 13 months of longitudinal SEO performance data spanning January 2025 through January 2026, capturing industry-level trends in visibility, traffic, and engagement over time. These historical performance trends were paired with the most recent available GEO performance metrics at the domain level, representing current AI visibility strength.
The study integrates 25,685 SEO-tracked domains with a GEO dataset covering over 6.4 million domains derived from more than 120 million AI citation instances, mapped across 61 industries. A matched subset of 20,543 domains appearing in both SEO and GEO datasets enables direct comparison of historical SEO trends with present AI visibility strength.
By combining time-based SEO performance trends with current AI visibility signals, we identify which industries are experiencing a measurable redistribution of discoverability from search engines to generative AI systems.
The analysis segments industries into four visibility transition patterns:
Channel Shift Industries
These industries show statistically significant SEO performance decline alongside above-average GEO strength. This pattern indicates that discovery is increasingly occurring through AI-generated responses rather than traditional SERP interactions. These industries represent the clearest evidence of behavioral migration from search to AI.
At-Risk Industries
Industries in this segment show SEO decline without compensating GEO presence. These sectors are losing organic discoverability across both traditional and generative channels and face the greatest visibility risk.
Double Winners
Industries demonstrating growth or stability in both SEO and GEO performance. These industries exhibit strong overall digital presence and adaptive visibility strategies.
SEO-Dominant Industries
Industries maintain strong SEO performance but lag in GEO strength. These sectors present opportunities for GEO adoption rather than evidence of displacement.
Across the full dataset, correlation analysis shows only a weak relationship between SEO decline and GEO strength, indicating that GEO is not uniformly replacing SEO. Instead, the shift is industry-specific, with certain verticals showing clear redistribution of visibility toward AI systems.
These findings provide a data-driven framework for prioritizing GEO strategy and product development by identifying where visibility is redistributing, where risk is emerging, and where adaptation to AI-driven discovery is most evident.
Methodology
1. Data Sources
SEO Performance Dataset
A longitudinal dataset of domain-level SEO metrics aggregated monthly and mapped to industry classifications.
Metrics used:
- Total impressions (visibility volume)
- Total traffic (clicks)
- Average click-through rate (CTR)
- Ranking position metrics
GEO Performance Dataset
A domain-level dataset capturing AI visibility signals across generative answer systems.
Metrics used:
- Total AI mentions (frequency of citation in AI answers)
- Average AI visibility (prominence when cited)
- Query coverage (breadth of queries where domains appear)
- Share of voice and rank metrics retained for diagnostic use
Domains were deduplicated and cleaned prior to analysis. GEO domains were matched to industries via the SEO domain-industry mapping.
2. Industry-Level Aggregation
SEO metrics were aggregated by industry and month to establish baseline performance and enable time-series trend modeling. GEO metrics were aggregated by industry to measure current AI visibility strength.
Industries with insufficient domain representation were excluded from trend ranking to reduce statistical noise.
3. SEO Trend Modeling
To quantify directional performance change, linear regression slopes were calculated across time for each industry using:
- Total impressions
- Total traffic
- CTR
Each slope was standardized (z-score), and a composite SEO Trend Score was calculated as the mean of these standardized trends.
Formula:
Zi,m = i,m – mm
SEO Trend Scorei =Zi,imp + Zi, traf + Zi,ctr3
Where:
- i = industry
- m = SEO metric (impressions, traffic, CTR)
- i,m = regression slope for industry i and metric m
- m, m = mean and standard deviation of slopes for metric m across industries
Interpretation:
- A lower SEO Trend Score indicates a stronger performance decline.
- A higher score indicates stability or growth.
4. GEO Strength Modeling
To quantify relative AI visibility strength, industry-level GEO performance metrics were aggregated and standardized across industries using:
- Total mentions
- Average visibility
- Query coverage
Each metric was standardized (z-score), and a composite GEO Strength Score was calculated as the mean of these standardized metrics.
Formula:
Zi,m = Xi,m – mm
GEO Strength Scorei = Zi, mentions + Zi, visibility + Zi, coverage3
Where:
- i = industry
- m = GEO metric (mentions, visibility, coverage)
- Xi,m = value of GEO metric m for industry i
- m, m = mean and standard deviation of GEO metric m across industries
Interpretation:
- A positive GEO Strength Score indicates the industry has a stronger-than-average AI visibility presence.
- Near 0 indicates Industry is around average AI presence.
- Negative GEO Strength Score indicates the industry underperforms in AI visibility relative to others.
5. Industry Impact Classification
Industries were categorized into four structural states using SEO Trend Score and GEO Strength Score:
| Classification | SEO Trend | GEO Strength | Interpretation |
| Channel Shift | Declining | Strong | Search discovery migrating to AI |
| At Risk | Declining | Weak | Visibility loss across both channels |
| Double Winners | Stable / Growing | Strong | Broad digital dominance both SEO & GEO |
| SEO Dominant | Stable / Growing | Weak | Opportunity for GEO expansion |
This framework operationalizes the concept of “impact from the SEO to GEO shift.”
6. Comparative Validation
To support interpretation:
- Side-by-side rankings compare SEO exposure vs GEO exposure.
- Trend visualizations validate directionality.
- Correlation analysis assesses the relationship strength between SEO decline and GEO presence.
7. Interpretation Scope
This analysis measures industry-level visibility redistribution, not absolute traffic loss. A strong GEO presence does not imply equal traffic recovery, but it signals where user attention and answer delivery are increasingly occurring.
SEO Industry Landscape (Baseline System)
Purpose of this section:
Establish how industries perform inside traditional search before introducing AI/GEO. This is the baseline environment.
Industry Representation in SEO
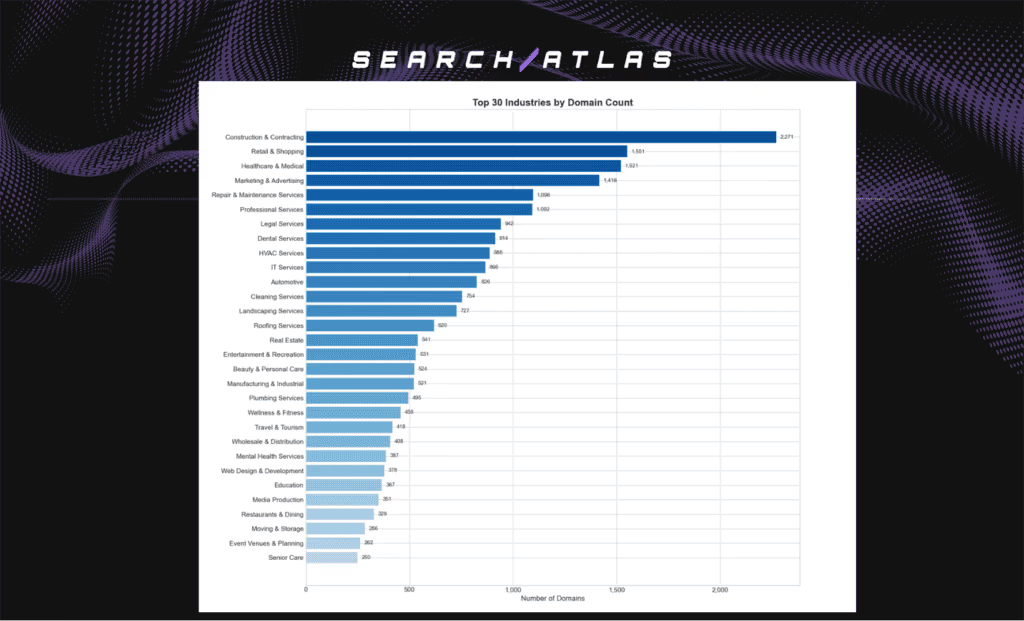
To contextualize performance comparisons, we first examine industry representation within the SEO dataset. Domain count serves as a structural indicator of how heavily industries are represented in the traditional search ecosystem.
Below is a chart that illustrates the distribution of domain representation across the top 30 industries within the SEO dataset (all 61 industries are included in other analyses).
Key Insights
- Industry participation in SEO is highly uneven, with domain representation varying nearly 10× between the largest and smallest industries shown.
- Construction & Contracting has the largest domain footprint, indicating broad digital presence in this sector.
- Retail and Healthcare also show substantial representation, reflecting industries with strong consumer-facing search activity.
- Service-based verticals (Legal, Dental, HVAC, Professional Services) form a large mid-tier, highlighting a strong SEO presence among local and service-driven industries.
SEO Visibility Distribution (Impressions & Traffic)
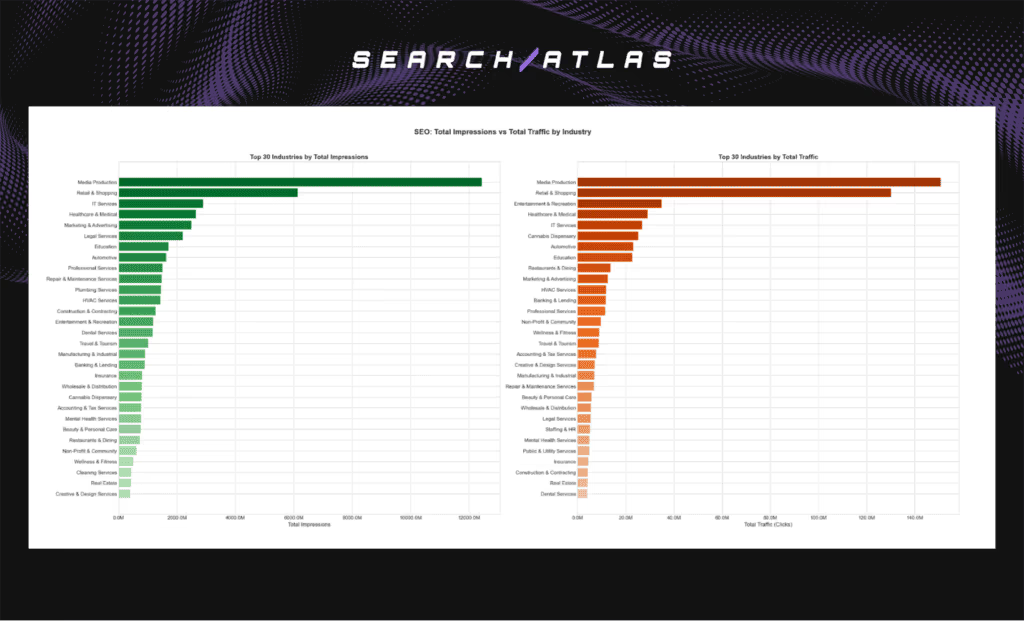
To understand how search visibility is distributed across industries, we examine total impressions (exposure) alongside total traffic (clicks). Together, these metrics show where search attention is concentrated and how effectively industries convert visibility into user engagement.
Below is a chart showing the Top 30 industries by total impressions and total traffic.
Key Insights
- Media Production and Retail & Shopping dominate both exposure and traffic, indicating strong presence and user engagement in traditional search.
- Several industries maintain deep impressions but comparatively lower traffic, suggesting that visibility does not always translate proportionally into clicks.
- Industries such as Entertainment & Recreation and Healthcare appear more prominently in traffic rankings than in impressions, indicating relatively stronger engagement efficiency.
- Organic search visibility is concentrated in a limited number of industries, indicating that a small set of sectors captures a disproportionate share of search demand and user engagement, while most industries operate within narrower keyword ecosystems.
SEO Engagement Efficiency (CTR)
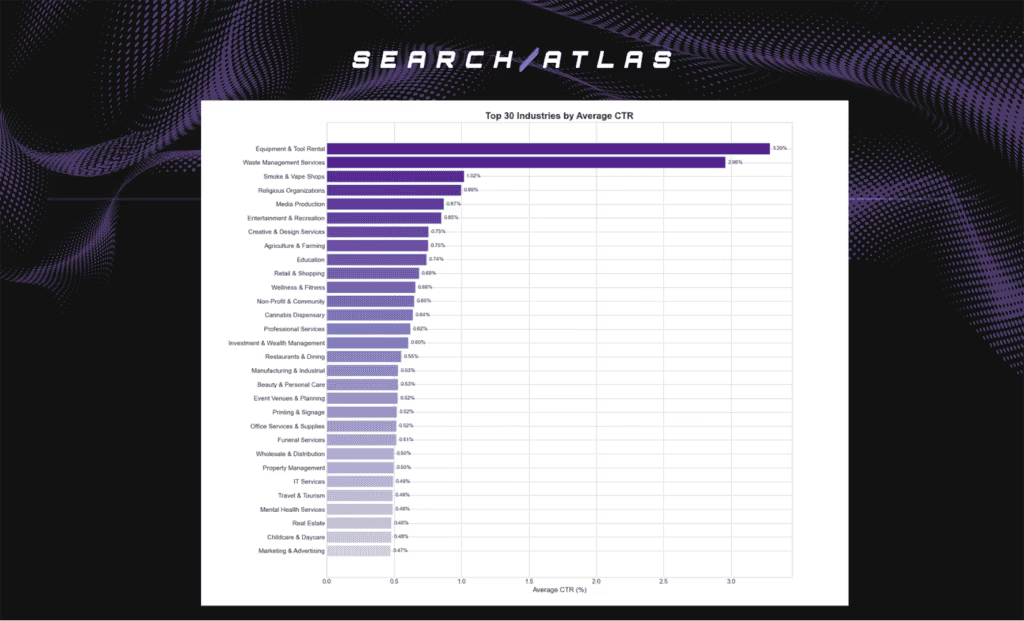
Click-through rate (CTR) reflects how efficiently industries convert search exposure into user engagement. Unlike impressions and traffic, which measure volume, CTR indicates how compelling or intent-aligned search results are for users within each industry.
Below is a chart showing the Top 30 industries by average CTR.
Key Insights
- CTR leaders differ markedly from high-impression industries, showing that visibility volume does not necessarily translate into engagement efficiency.
- Several niche or intent-specific industries rank higher in CTR than broad consumer sectors, suggesting stronger alignment between user queries and search results.
- High-volume industries such as Retail and Media do not dominate CTR rankings, indicating that scale and efficiency operate differently across sectors.
- Engagement efficiency varies more tightly across industries than impressions or traffic, highlighting CTR as a quality signal rather than a scale indicator.
SEO Performance Trends Over Time
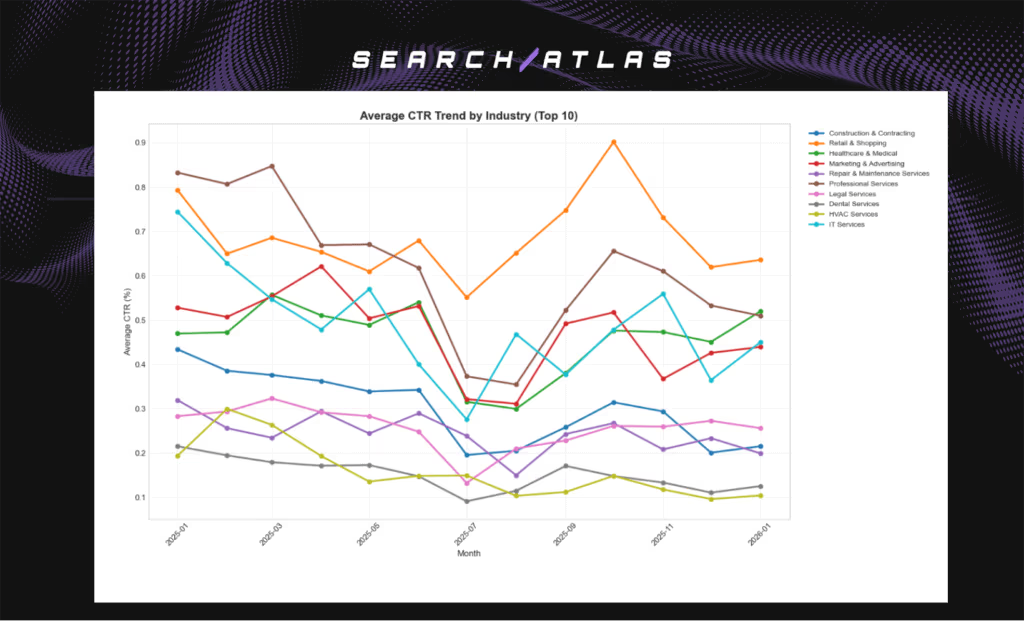
To examine how traditional search performance evolves over time, we analyze monthly trends in impressions, traffic, and CTR across the top-performing industries. These trends provide temporal context for understanding changes in SEO visibility and engagement.
Below are charts showing monthly trends for impressions, traffic, and CTR across the Top 10 industries by domain representation in the SEO dataset.
Impressions Trend
Traffic Trend
CTR Trend
Key Insights
- Most industries peak mid-year, then decline in both impressions and traffic
The majority of sectors show rising visibility early on, followed by a broad drop in impressions and clicks, indicating a cross-industry reduction in organic exposure rather than isolated sector-specific changes. - High-volume industries also experience declines
Retail & Shopping, despite having the largest traffic and impression volumes, shows a similar downward trajectory, indicating that this pattern is not limited to smaller industries. - Impressions and traffic vary more than CTR
Across several industries (e.g., IT Services, Legal Services), impressions and clicks exhibit larger swings over time, while CTR changes are comparatively smaller. This indicates that variation in organic exposure is more pronounced than variation in click-through behavior.
- CTR trends do not consistently mirror volume trends
In some industries, CTR remains stable or improves while impressions and traffic fall, showing that changes in organic exposure and click volume are not always accompanied by proportional changes in click-through behavior.
Industry SEO Performance Trend Rankings
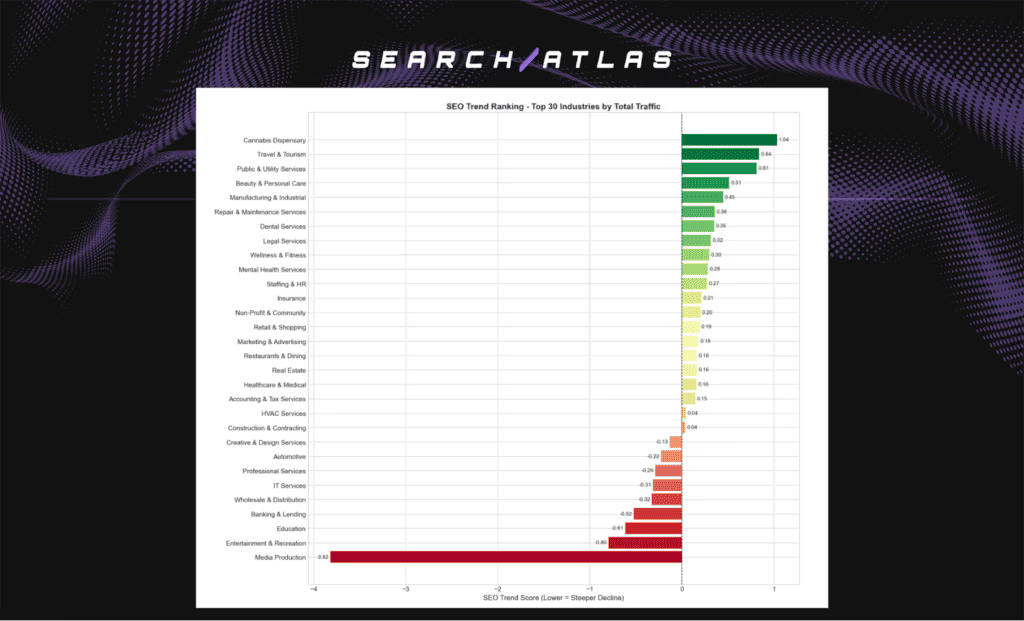
The SEO Trend Score (defined in Methodology) combines impression, traffic, and CTR trends to measure the direction and strength of each industry’s organic performance over time.
The chart below ranks the top 30 high-traffic industries using the SEO Trend Score, highlighting where SEO performance is improving versus where steeper declines are occurring. Because these sectors drive the majority of organic clicks, shifts here represent the largest potential business impact.
Key Insights
- SEO performance trends diverge significantly across industries, with a clear split between growth-oriented and declining sectors.
- Consumer and lifestyle industries (e.g., Travel, Beauty, Cannabis, Public Services) show the strongest upward SEO momentum, while essential service sectors (Manufacturing, Repair, Dental, Legal) reflect steady but moderate growth.
- Declines are concentrated in B2B, institutional, and media-heavy industries (e.g., Banking, Education, IT, Wholesale), indicating structural organic visibility pressure in these segments.
- Media Production stands out as a clear negative outlier, showing the steepest organic performance decline among high-traffic industries.
Industry GEO Landscape
GEO Presence Distribution Across Industries
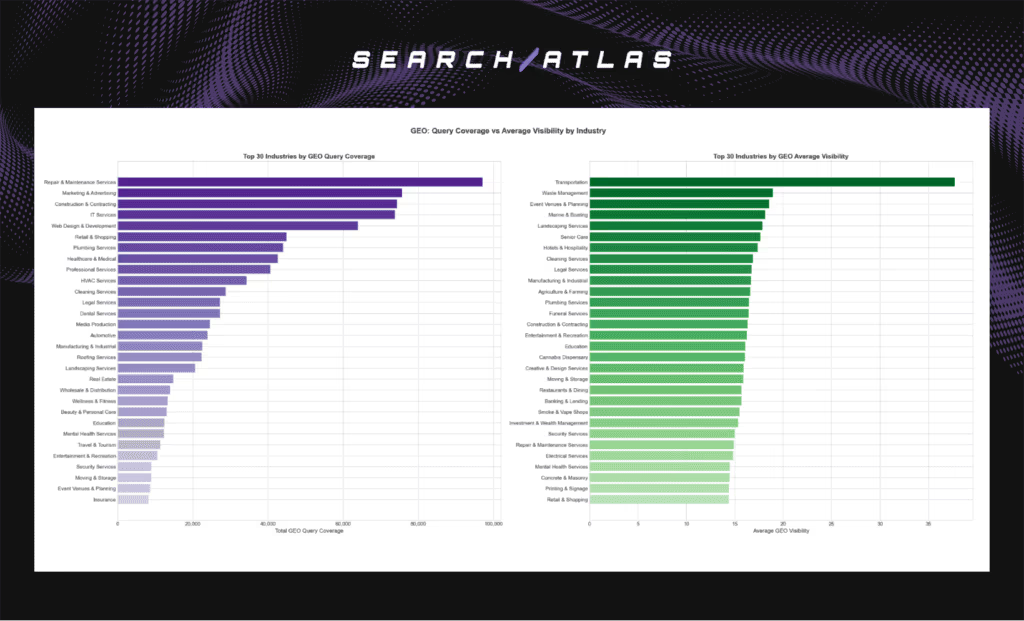
GEO presence varies across industries along two key dimensions:
• Query Coverage – how widely an industry appears across AI-generated responses
• Average Visibility – how prominently an industry is represented when it appears
Together, these metrics illustrate differences in how industries show up within AI-driven search environments.
Below is a chart showing industry performance across GEO Query Coverage and Average Visibility.
Key Insights
- Industries with the widest AI presence include Repair & Maintenance, Marketing, Construction, IT, and Web Services, indicating strong query-level exposure.
- Some industries stand out more for visibility strength than breadth, such as Transportation, Waste Management, and Event-related sectors.
- Several large commercial industries (e.g., Retail, Healthcare, Professional Services) appear in both charts, but not always at the very top, suggesting steady but not dominant GEO presence.
- GEO exposure is distributed unevenly: some industries appear frequently, others appear more prominently, and only a few show strength across both dimensions.
GEO Industry Presence Landscape: Total AI Mentions by Industry
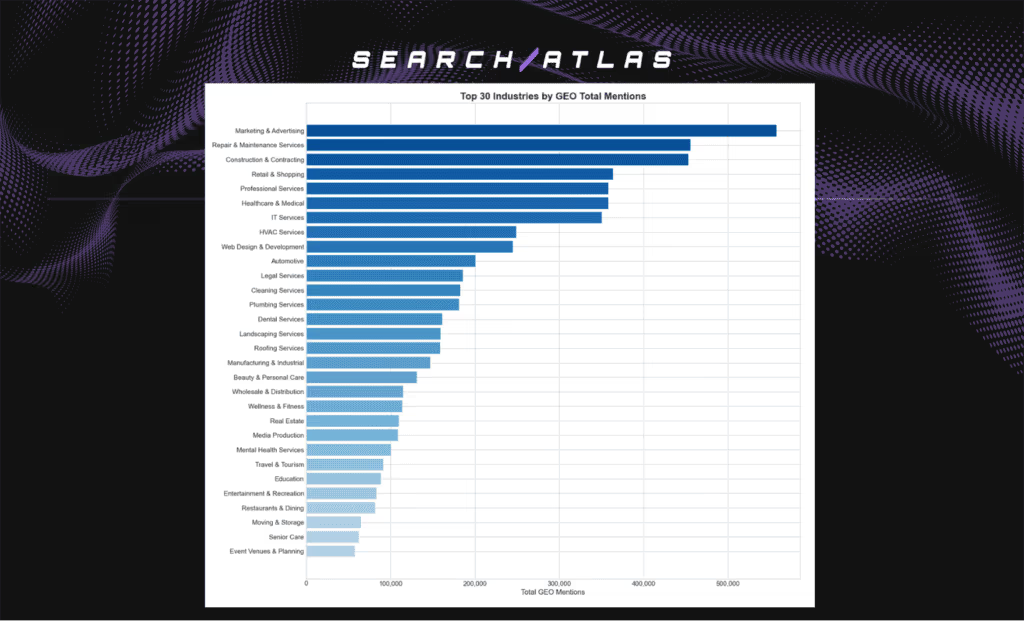
Below is a chart showing total GEO mentions by industry. This metric reflects how frequently industries appear in AI-generated responses, indicating where GEO presence is most concentrated across the ecosystem.
Key Insights
- GEO visibility is highly concentrated in a small group of industries, with Marketing & Advertising, Repair & Maintenance Services, and Construction & Contracting leading by a wide margin.
- Service-oriented and local-demand sectors (e.g., Retail, Professional Services, Healthcare, IT Services, HVAC) dominate AI mentions, showing that GEO exposure is strongest in industries tied to practical, problem-solving queries.
- Traditional content-heavy or institutional sectors (e.g., Education, Media Production, Travel, Entertainment) sit in the lower tier of mentions, indicating a weaker overall presence in AI answer ecosystems.
- The distribution shows a steep drop from the top tiers to the long tail, meaning GEO exposure is not evenly spread but concentrated among industries closely aligned with actionable consumer and service needs.
SEO to GEO Shift Analysis: Industry Channel Transition
This section examines how industries are transitioning between traditional organic search performance (SEO) and AI-driven visibility (GEO). Rather than analyzing SEO and GEO in isolation, we evaluate whether declines in SEO performance are being offset by gains in GEO presence, indicating a potential shift in visibility channels.
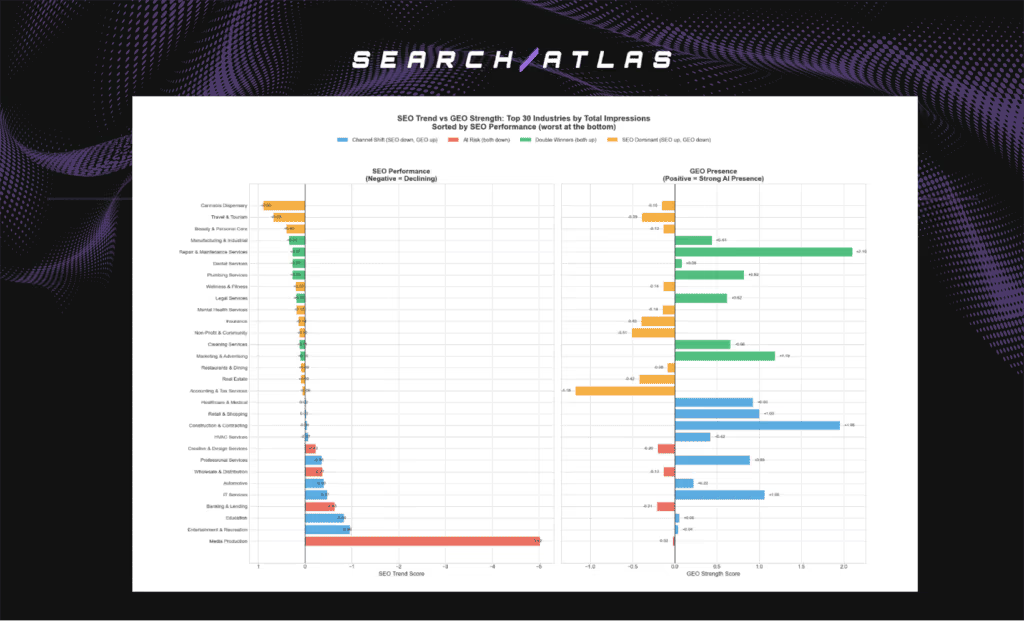
Below is a chart that maps each industry’s SEO performance trend against its GEO strength, showing where industries are maintaining visibility through AI platforms versus where overall digital visibility risk is emerging.
Metrics used:
• SEO Trend Score – A standardized composite of impression, traffic, and CTR trends over time (explained in Methodology).
• GEO Strength Score – A standardized composite of AI visibility indicators including mentions, visibility, and query coverage (see Methodology).
Together, these scores identify whether industries are:
- Sustaining visibility through GEO despite SEO decline
- Losing visibility across both channels
- Growing in both
- Still primarily SEO-dependent
Butterfly Chart – SEO Trend vs GEO Strength (Top 30 Industries by Total Impressions)
Key Insights
- Clear evidence of channel shift in high-impact industries.
Sectors such as Construction & Contracting, Retail & Shopping, IT Services, and Professional Services show negative SEO trends but strong positive GEO strength. Visibility is not disappearing; it is migrating to AI surfaces. - “Double winners” remain strong across both ecosystems.
Industries including Repair & Maintenance, Plumbing, Legal, and Manufacturing demonstrate positive performance in both SEO and GEO, indicating broad digital resilience rather than dependence on a single channel. - True risk is concentrated where both channels weaken.
Media Production, Education, and Banking & Lending show declining SEO with weak GEO strength, signaling net visibility loss rather than redistribution. - Some industries remain SEO-dependent and lag in GEO.
Sectors such as Cannabis Dispensary, Travel & Tourism, and Beauty & Personal Care show stable or improving SEO performance but weak GEO strength, suggesting they still rely heavily on traditional search and have been slower to establish visibility in AI-driven answer environments.
- GEO is functioning as a compensatory visibility channel, not just an additive one.
The pattern shows that GEO strength frequently appears where SEO declines are steepest, reinforcing that AI visibility is increasingly acting as a parallel discovery layer.
Conclusion
The shift from SEO to GEO is measurable but uneven across industries. The strongest impact appears in service-driven and consumer-action sectors such as Construction & Contracting, Retail & Shopping, IT Services, Professional Services, and Healthcare, where declining SEO performance is accompanied by strong AI visibility. In these industries, discovery is not disappearing but redistributing toward AI-generated answers, indicating a structural migration in how users find information and providers.
In contrast, informational, institutional, and content-heavy sectors such as Media Production, Education, and Banking & Lending show weakening performance across both SEO and GEO, signaling a visibility risk rather than channel shift. Overall, the transition from search engines to AI systems is industry-specific, with GEO functioning as a parallel discovery layer that compensates for SEO decline in some verticals while exposing others that have not yet adapted to AI-driven visibility models.