

Search Atlas LLM Visibility shows where brands appear and how they are represented in answers generated by large language models (LLMs). As AI platforms like ChatGPT, Gemini, Perplexity, and Claude shape the way users discover information, understanding brand visibility and sentiment in these channels becomes non-negotiable.
LLM Visibility enables teams to monitor trends, identify shifts in competitive presence, and interpret brand perception across major AI systems. The following guide covers setup, dashboard navigation, data interpretation, and practical strategies for using LLM Visibility.

What is an LLM?
An LLM (large language model) is an advanced artificial intelligence (AI) system that processes, understands, and generates human language by using deep learning techniques and transformer architectures.
LLMs process massive text datasets, which allows them to identify complex relationships between words, phrases, and sentences. LLMs excel at language generation, question-answering, summarization, translation, and powering chatbots or virtual assistants.
LLMs use transformer-based neural networks, are pre-trained on billions of words, and predict sequences in natural language. LLMs automate text-based tasks, enable human-like interactions with technology, and adapt for applications across multiple industries.
Popular LLMs include ChatGPT, Gemini, Perplexity AI, and Claude. LLMs now influence which entities appear in responses across major platforms.
What is the LLM Visibility Tool?
The LLM Visibility Tool in Search Atlas is an integrated analytics platform that measures how frequently and in what context your brand, website, or products appear in answers generated by large language models (LLMs) across major AI systems.
The LLM Visibility Tool aggregates real-time data, tracks sentiment, and catalogs citation sources from ChatGPT, Gemini, Perplexity, and Claude.
The LLM Visibility Tool displays information in 4 modular dashboards (Summary, Visibility, Sentiment, and Topics & Queries) so you analyze exposure, benchmark competitors, and review sentiment with precision.
The LLM Visibility Tool is built for reliability, scalability, and real-world usability. The platform features backend infrastructure for secure data collection, a responsive frontend dashboard, and API integrations for multi-platform data retrieval.
The LLM Visibility Tool allows you to achieve the 3 goals listed below.
- View real-time and historical brand visibility and sentiment metrics.
- Select and compare results in multiple LLM sources, with the dashboard updating instantly.
- Visualize trends, competitor rankings, and market share through charts, scores, and lists
The purpose of the LLM Visibility Tool is to provide a complete, real-time view of the presence, context, and sentiment of your brand in AI-generated answers. The LLM Visibility Tool quantifies and compares your visibility, enables early risk detection, and transforms complex LLM data into actionable benchmarks for informed decision-making.
How Do You Get Started With LLM Visibility?
To get started with LLM visibility, access the LLM Visibility Tool from the Site Metrics section within the Search Atlas dashboard. Once you select “Site Metrics” from the left-side navigation menu, it opens the Search Atlas Site Explorer. Find “LLM Visibility” listed under Site Metrics for any tracked project.
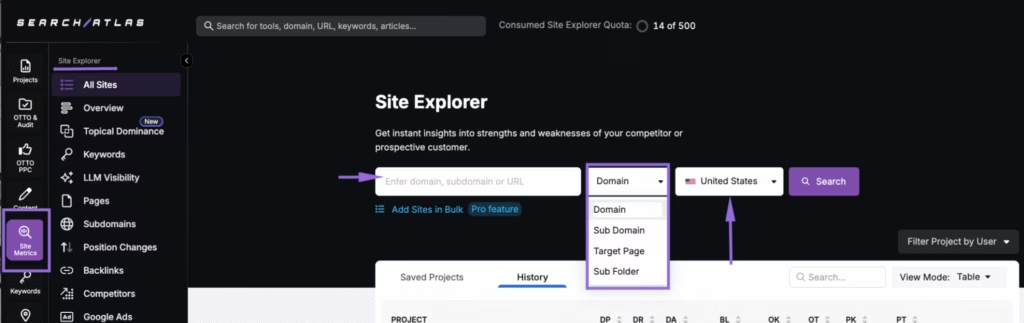
To begin analysis, enter your domain, subdomain, target page, or subfolder in the search bar at the top of Site Explorer.
Choose the type of property to analyze using the dropdown menu, then select the geographic market with the country picker. Click “Search” to load data for your selected property.
Initial Set-Up
Set up LLM Visibility by selecting the relevant site and confirming that data loads for your target property. Firstly, verify your project is visible in Site Explorer. Secondly, click on “LLM Visibility” in the Site Metrics menu to display the main dashboard.
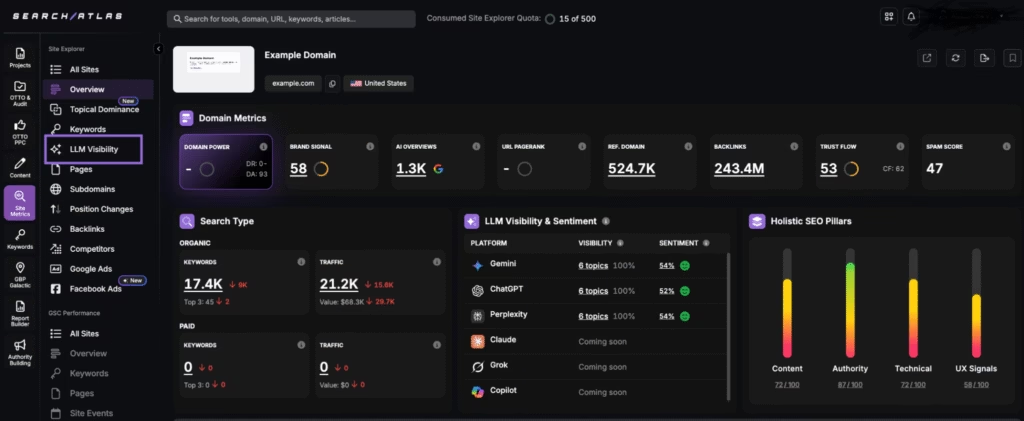
Review the overview panel to see high-level metrics, then use the dashboard tabs (Summary, Visibility, Sentiment, Topics & Queries) for deeper analysis. LLM data updates automatically when you switch properties or apply different filters.
What Will You See in the Dashboard?
LLM Visibility provides a modular set of dashboards called Summary, Visibility, Sentiment, and Topics & Queries, which allow users to analyze AI exposure and perception from every angle.
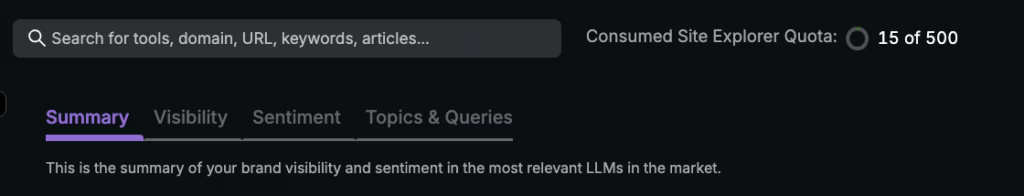
Summary Dashboard
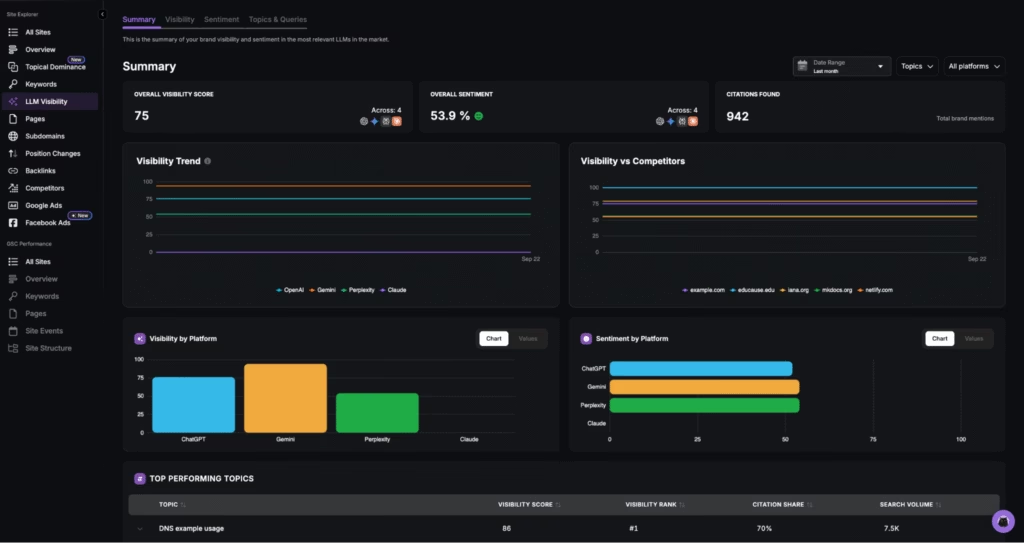
The Summary dashboard in the Search Atlas LLM Visibility tool consolidates all key findings. You see your overall visibility score, average sentiment, and total citations from major large language models, as shown below.
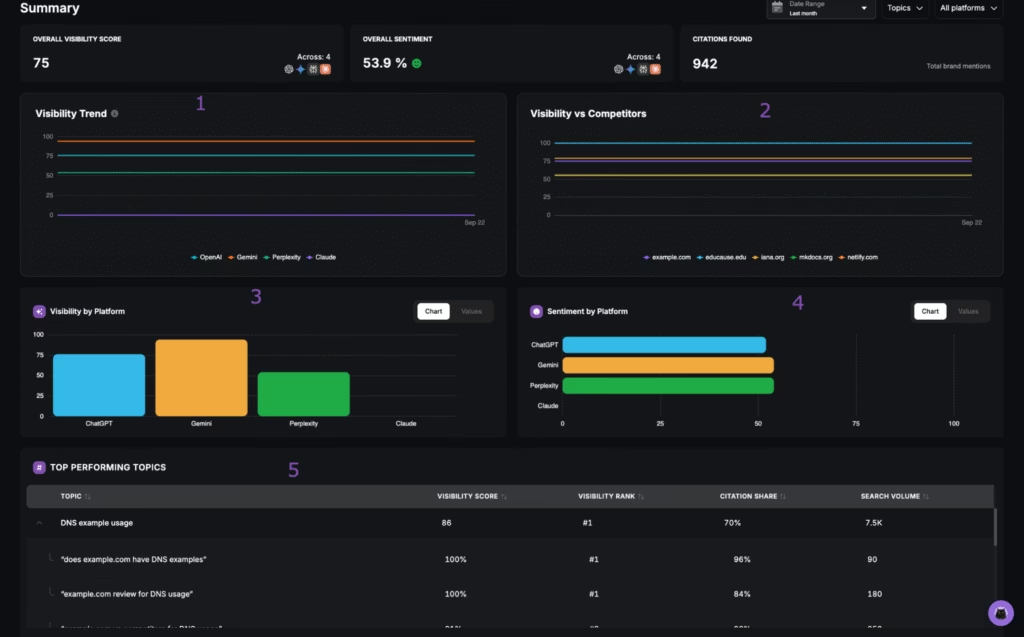
The Summary dashboard involves 5 important components outlined below.

- Visibility Trend. The Visibility Trend chart tracks changes in the AI presence of your brand over time, with each line representing results from OpenAI, Gemini, Perplexity, or Claude.
- Visibility vs Competitors. The Visibility vs Competitors graph compares your AI visibility against top competitors, showing side-by-side performance for the selected time frame.
- Visibility by Platform. The Visibility by Platform bar chart displays the distribution of brand mentions by LLM. It makes it easy to spot which AI platforms most frequently reference your brand.
- Sentiment by Platform. The Sentiment by Platform chart summarizes sentiment ratings for each LLM. It shows how positively or negatively your brand appears across platforms.
- Top Performing Topics. The Top Performing Topics table lists the topics, queries, or keywords that generate the most citations, including your visibility score, rank, citation share, and search volume for each entry.
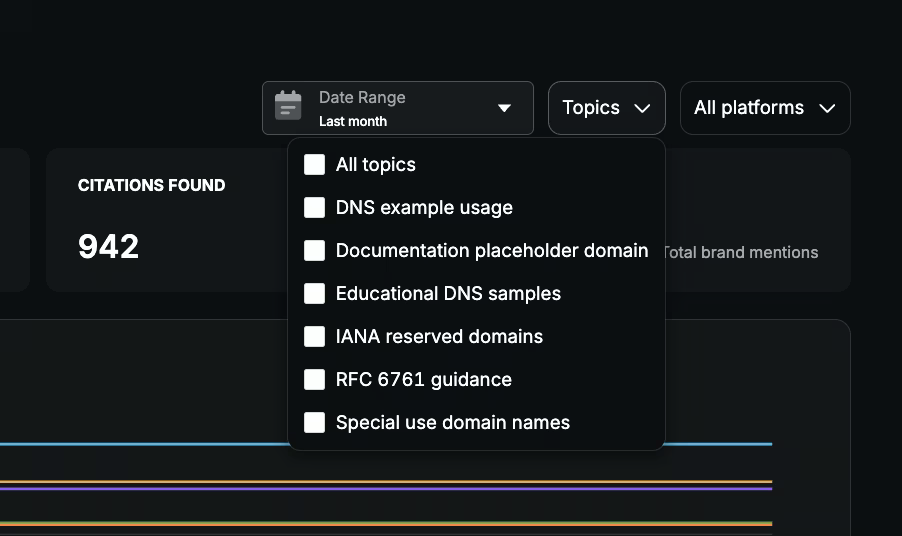
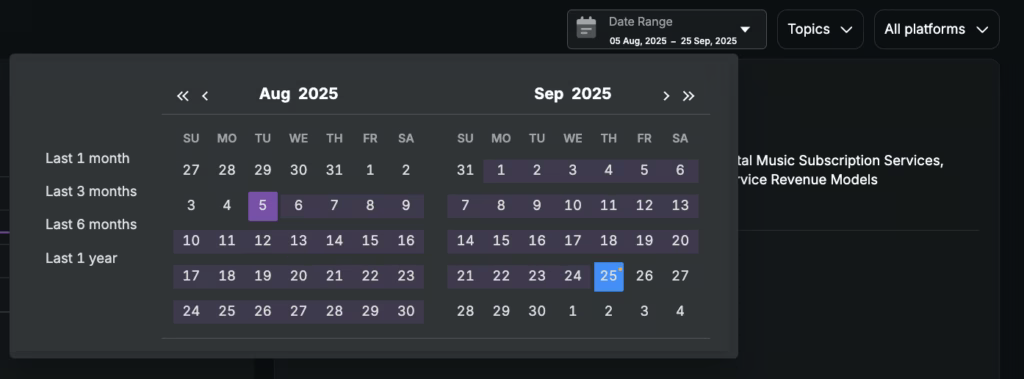
The Summary and every other dashboard in the Search Atlas LLM Visibility tool allow you to choose the date range, topics, and platforms you want the insights on.
Visibility Dashboard
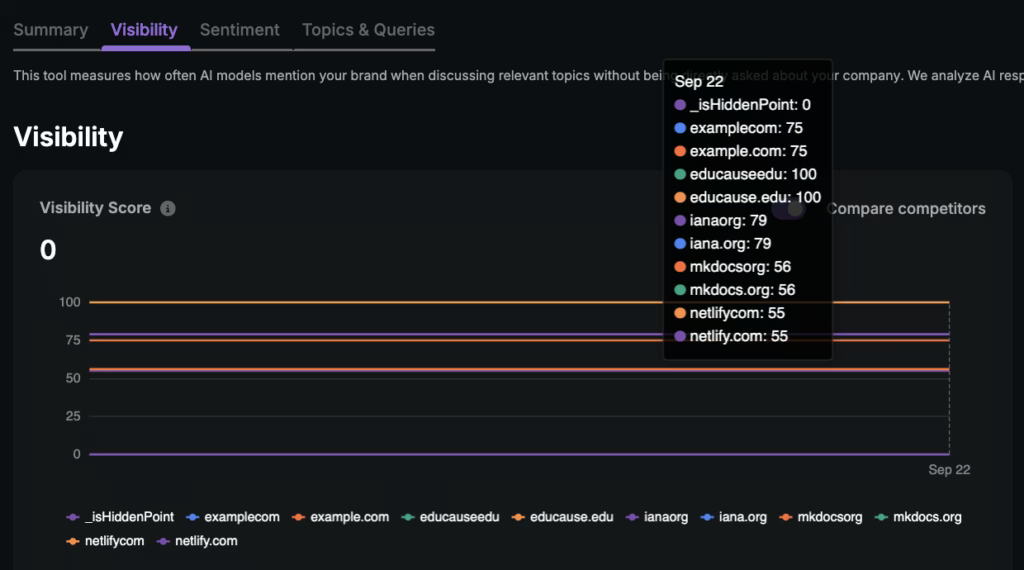
The Visibility dashboard in the Search Atlas LLM Visibility tool quantifies how often your brand appears in LLM-generated answers without being directly asked about your company.
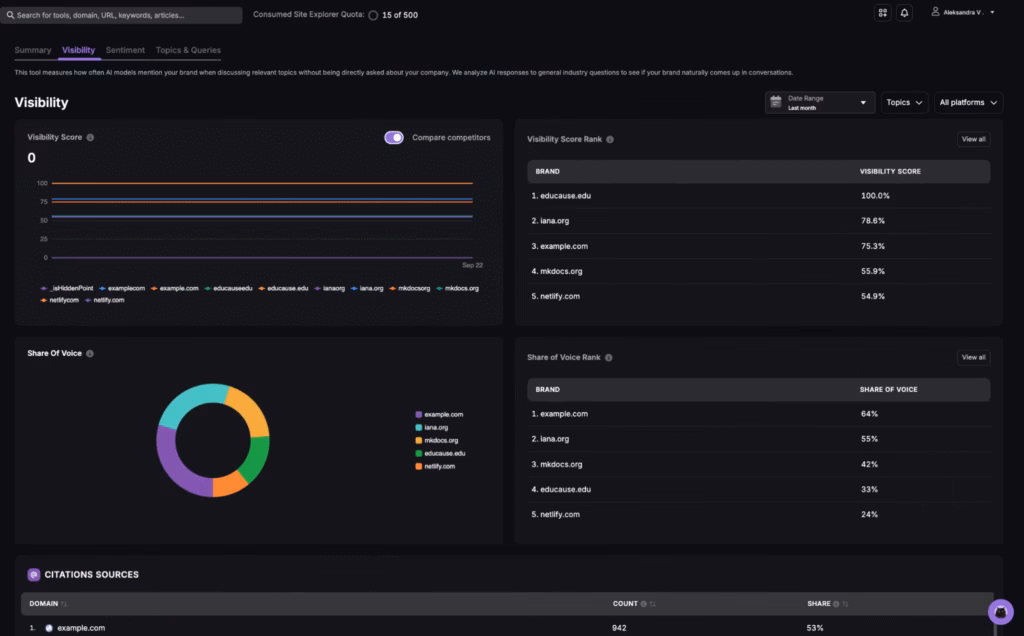
Use the Visibility dashboard to evaluate your visibility score, analyze mention trends, and benchmark against industry peers as explained below.
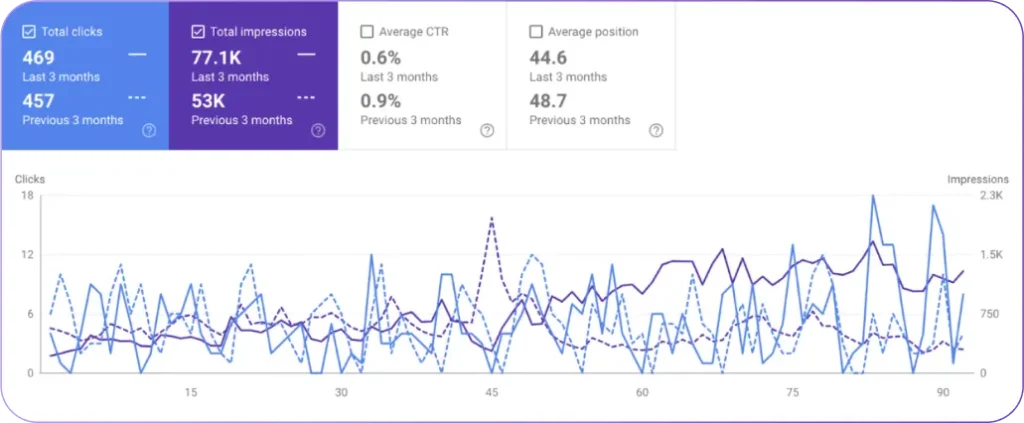
- Visibility Score. The main chart displays your visibility score over time, allowing you to track presence in AI-generated responses across selected brands or competitors. Each line represents a domain or brand, so you are able to see if and how visibility shifts during the chosen date range.
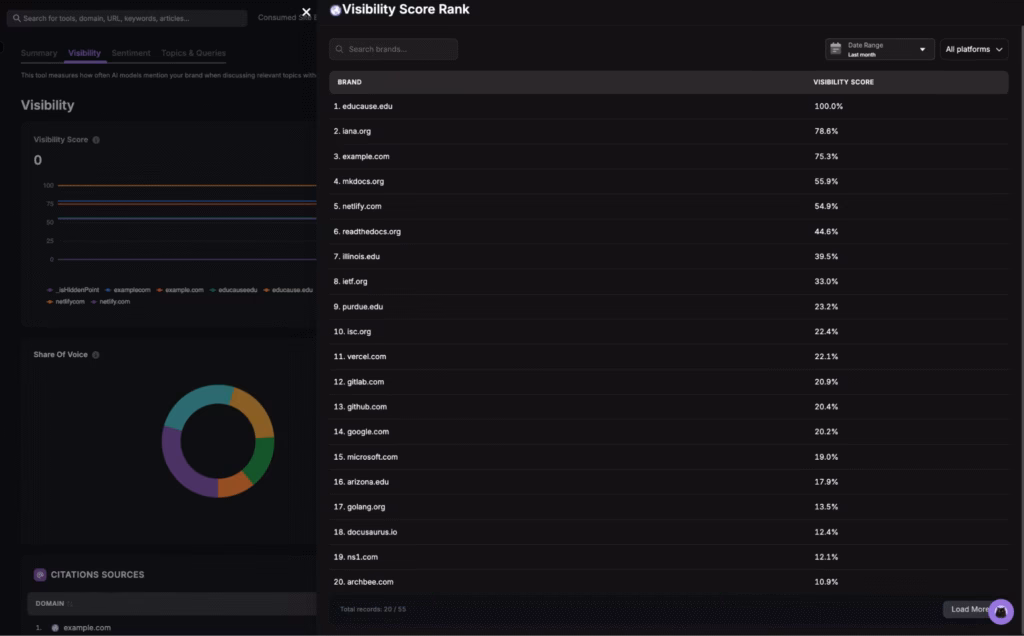
- Visibility Score Rank. The ranking table lists brands by visibility score, highlighting leaders and laggards for the selected time frame.
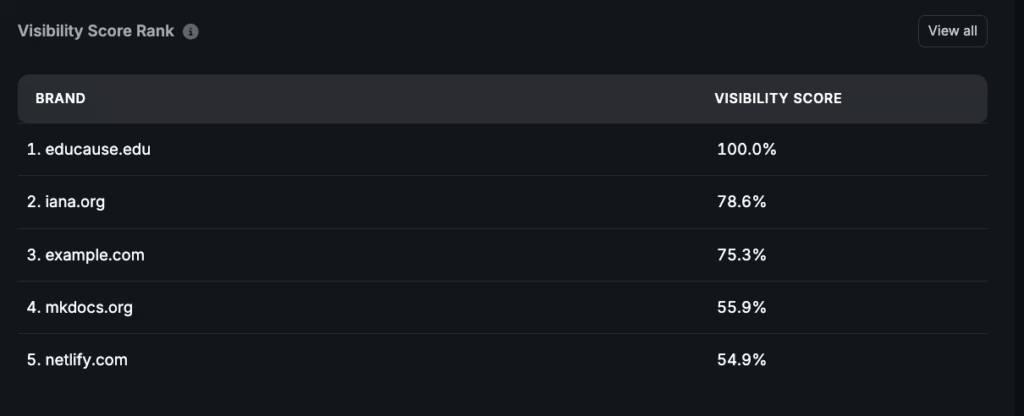
Once you click the “View all”, the list extends to 50+ competitors. Use this list to see exactly where your brand stands in relation to the top competition.
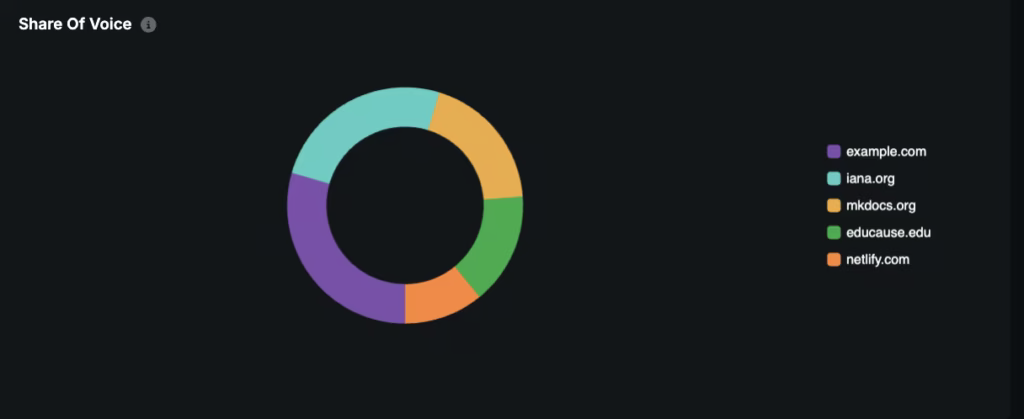
- Share of Voice Chart. The donut chart shows the share of AI mentions attributed to each brand, which gives a clear breakdown of overall voice distribution. Each segment represents the percentage of total mentions across platforms.
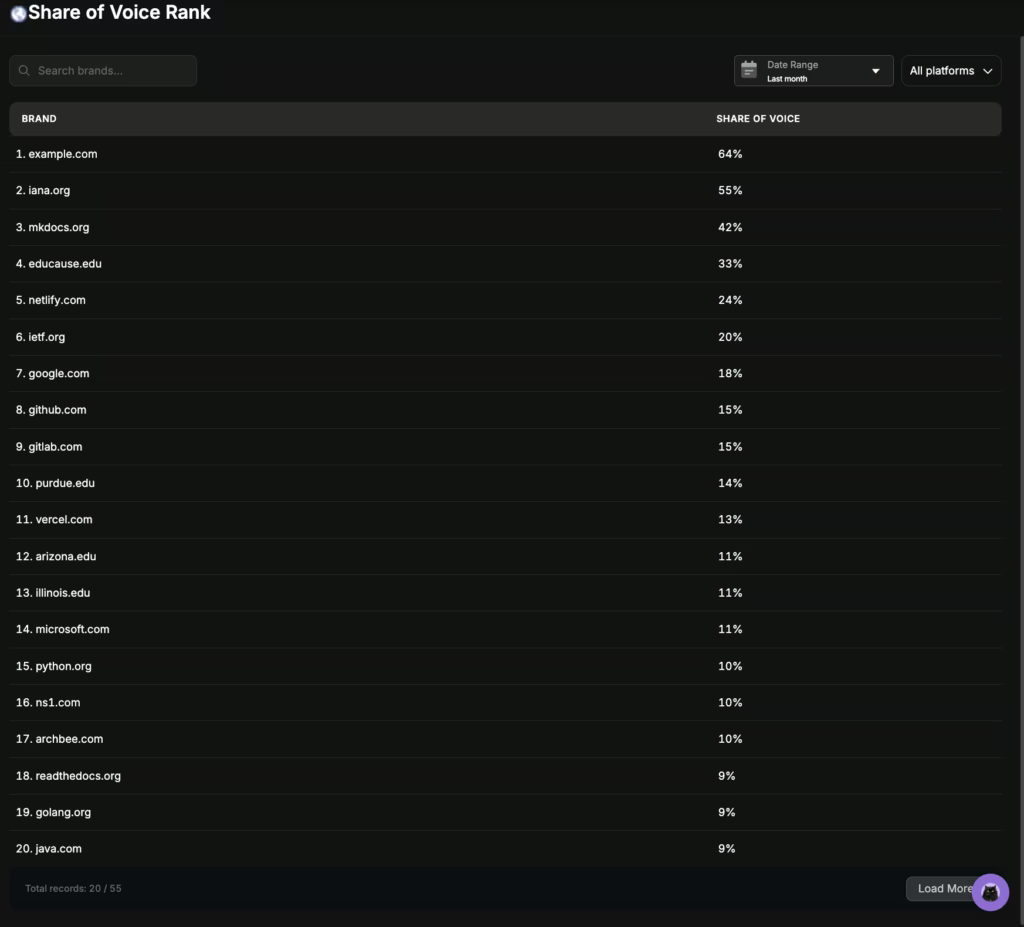
- Share of Voice Rank. This table displays brands sorted by share of voice, so you are able to compare the presence of your brand to others and monitor shifts in competitive standing.
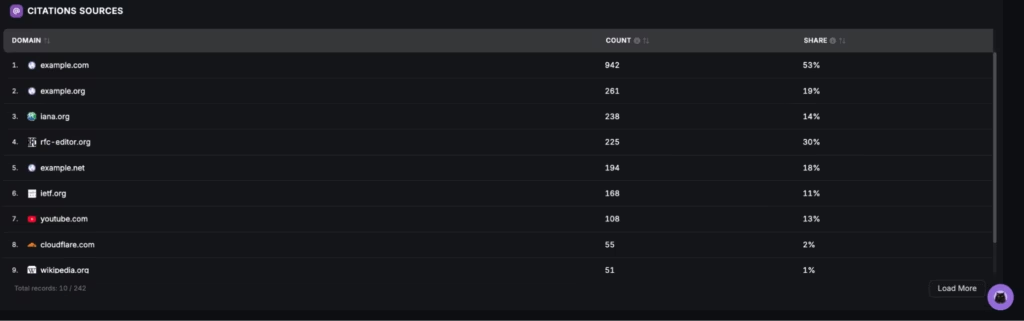
- Citation Sources. The Citation Sources table catalogs all domains referenced by LLMs, showing both total counts and share for each. Use this view to identify which sources drive recognition and where citation gaps may exist.
You are able to quickly identify underperforming queries and adjust your content strategies if the Visibility dashboard shows a low share of voice.
Sentiment Dashboard
The Sentiment dashboard in the Search Atlas LLM Visibility tool measures how LLMs describe your brand, products, and topics (in positive or negative terms).
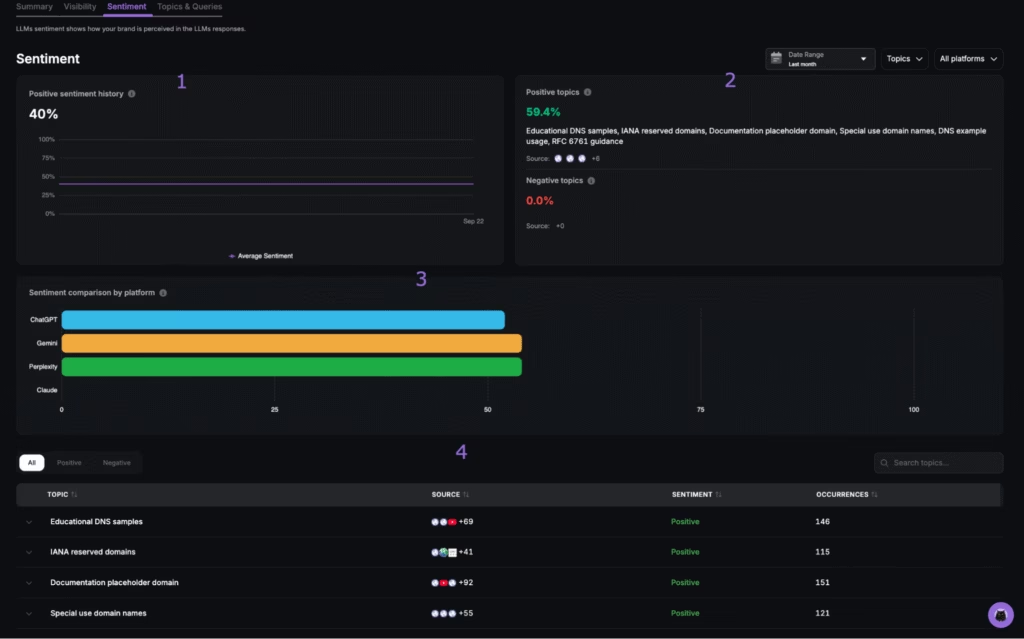
The 4 segments of the Sentiment dashboard are below.
- Positive Sentiment History. The sentiment trend chart displays the percentage of positive mentions over time, which makes it possible to track changes in how LLMs represent your brand.
- Positive and Negative Topics. The summary panel lists the percentage and main topics associated with positive and negative sentiment. Review which themes contribute most to a favorable perception and where potential issues might arise.
- Sentiment Comparison by Platform. The comparison bar chart shows how each LLM (ChatGPT, Gemini, Perplexity, Claude) rates your brand. It ensures you pinpoint which platforms describe you most favorably.
- Sentiment by Topic Table. The detailed table at the bottom breaks down each topic by source, sentiment type, and occurrence count. Analyze which queries or themes appear most frequently and how sentiment trends across multiple LLMs.
Use the Sentiment dashboard to review average sentiment history, identify leading topics, compare platforms, and analyze granular sentiment by topic.
Topics & Queries Dashboard
The Topics & Queries dashboard in Search Atlas LLM Visibility lists the topics and questions used to calculate the visibility score of your brand through AI assistants. Each row in the table displays a core topic or query, your visibility score, visibility rank, citation share, and related search volume.
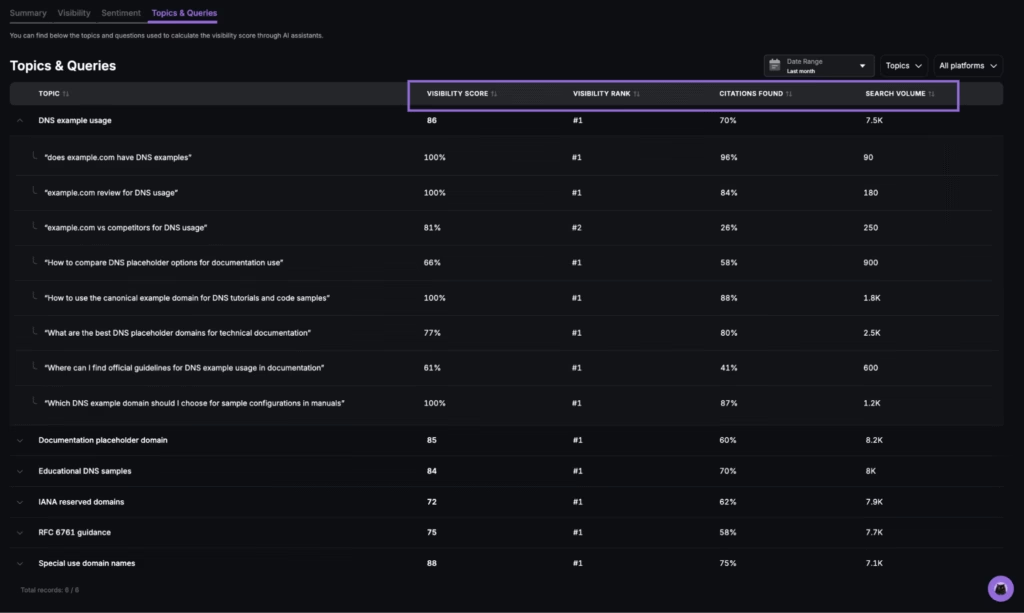
Review the Topics & Queries dashboard to identify which queries, prompts, or themes most often trigger LLMs to mention your brand. Expand each topic to see performance at the question level, pinpoint coverage gaps, and prioritize optimization for queries with high search demand or strategic value.
How Do You Use the Data?
Use the data from the Search Atlas LLM Visibility tool to improve your AI presence, manage reputation, refine your SEO strategy, and track progress. Each dashboard metric provides actionable insights for benchmarking, risk management, optimization, and ongoing measurement.
Benchmark Against Competitors
To benchmark against competitors, use the Visibility Score Rank and Share of Voice to determine where your brand stands with the LLMs. Compare your score and ranking to primary competitors for each LLM and date range.
Investigate areas where competitors have higher visibility, then review citation sources and top topics to identify which content or domains drive their leads. Prioritize campaigns that target underperforming topics or platforms where your presence is lower.
Protect & Manage Reputation
To protect and manage reputation, rely on sentiment trendlines, platform breakdowns, and topic-level sentiment tables to identify threats and opportunities in how LLMs describe your brand.
Track shifts in average sentiment and spot which queries, products, or topics produce the most negative mentions. Use this analysis to adjust FAQ language, update PDPs (product detail pages), or deploy targeted messaging to address recurring concerns. Respond to reputational risks before they affect wider brand perception.
Guide SEO & GEO Strategy
To guide your SEO (Search Engine Optimization) and GEO (Generative Engine Optimization) strategy, leverage the Topics & Queries dashboard and citation source tables to pinpoint which keywords, themes, or locations drive AI mentions.
Analyze which queries rank highest by volume and visibility, and cross-reference with your organic rankings. Update page titles, headings, and on-page content to address the exact prompts LLMs use. Target regional search gaps by tailoring content for markets or languages where LLM citation volume is lowest.
Measure Progress Over Time
To measure progress over time, use trend charts and historical dashboards to track the direct impact of your optimizations on AI visibility and sentiment. Record baseline metrics for visibility, sentiment, and citations, then review changes after each SEO or brand initiative.
Export month-over-month data for internal reporting or team review. Document improvement areas and identify which strategies most effectively improve your LLM footprint.
What Are the Quick Tips for Best Use of LLM Visibility?
The quick tips for the best use of the Search Atlas LLM Visibility tool are below.
- Review both LLM visibility data and traditional SEO rankings together to get a complete picture of your digital presence.
- Monitor the Visibility and Sentiment dashboards once a week to catch drops, spikes, or sentiment swings before they escalate.
- Cross-check competitor Share of Voice scores and citation sources when a new product, campaign, or brand update goes live.
- Filter by LLM platform to identify which AI system underrepresents your brand, then adjust content for the favored queries or language of that model.
- Compare trend lines for visibility and sentiment after site migrations, major PR events, or negative news cycles to quantify real-world brand impact.
- Export and annotate monthly reports. Flag areas where citation sources change, new competitors appear, or sentiment diverges across platforms.
- Track your baseline scores after initial setup, then record changes after each major optimization to connect actions with outcomes.
- Set team reminders for weekly dashboard reviews, using platform filters and historical comparisons to turn insights into clear to-dos.
Get started with Search Atlas and explore your LLM Visibility dashboard now. Review insights, spot trends, and take the next step toward a stronger brand presence in AI answers.