

Local search visibility determines market share across competitive environments. Keyword volatility quantifies ranking fluctuation for each query across time and location. Analysts measure how strongly each keyword reacts within Google’s evolving local ecosystem.
Search professionals debate which signals trigger volatility. Traditional research centers on backlinks, proximity, and reviews, yet few models explain keyword-specific instability. That gap prevents marketers from anticipating sudden ranking disruption.
Researchers collected and analyzed 28,000 grid snapshots across 500 keywords from Google Business Profile data. The dataset covered diverse industries such as healthcare, home services, and digital marketing. Analysts aligned keyword volatility with global SERP volatility to identify significant correlations.
High-intent local queries such as “dentist near me,” “roofing contractor,” and “SEO services” produced strong positive correlations with global SERP volatility (r = 0.33 to 0.36, p < 0.05). Stable verticals such as “plumbing” and “med spa” remained isolated from global change. Sensitive keywords functioned as early indicators of market instability.
1. Methodology – How Did the Analysis Operate?
The section defines structure and replicability. Analysts applied statistical, procedural, and interpretive rigor.
Dataset Scope
Researchers examined 28,000 + SERP grid snapshots covering 500 + local keywords across multiple months. They included markets across the United States in sectors such as healthcare, home services, and marketing.
They segmented keywords into four categories: Dental, Home Services, Marketing, and Beauty. Each query received intent classification as transactional or informational.
Data Sources
Analysts extracted information from 4 sources. The 4 sources are listed below.
- SERP grid snapshots: Pin-level positions for each keyword.
- Keyword metadata: Industry tags and intent categories.
- GBP metrics: Average position, review count, and rating.
- Global SERP volatility: Aggregated daily fluctuation index.
Preprocessing
Firstly, analysts removed incomplete rows and outliers using the 1.5× IQR filter. Secondly, they normalized position data through z-score standardization. Thirdly, they transformed wide matrices into time-series structures for volatility tracking.
Rolling volatility scores used 3-day and 7-day windows to calculate the standard deviation of positions. Alignment of keyword volatility with the global volatility timeline completed preprocessing.
Analytical Methods
Researchers executed correlation analysis using Pearson coefficients to measure alignment between keyword and global volatility. They computed p-values to evaluate statistical significance. Keywords with p < 0.05 advanced into final visualization.

The x-axis again reflects correlation, but bar color represents –log₁₀(p-value). Darker Blue means statistically significant (smaller p-value). The correlation for the keyword “Dentist near me” is≈ 0.33 and for “Roofing contractor” is ≈ 0.36.
They applied –log₁₀(p-value) as color encoding for confidence interpretation. K-means clustering separated behavioral patterns into three groups. Analysts favored interpretability and scalability to support real-time application.
Target Variables
| Metric | Description |
| Rolling volatility | Standard deviation of pin positions over time |
| Global volatility | Aggregated SERP-wide fluctuation index |
| Correlation (r) | Alignment between keyword and global volatility |
| p-value | Probability that correlation occurred randomly |
| –log₁₀(p-value) | Significance magnitude for visualization |
2. Which Factors Influenced Ranking Behavior Most?
The statistical patterns that revealed the dominant forces shaping volatility are below.

- High-correlation Keywords: “Roofing contractor,” “dentist near me,” and “SEO agency” reached r = 0.33 to 0.36 with p < 0.03.
- Stable Keywords: “Plumbing,” “med spa,” and “digital marketing” maintained r = –0.12 to –0.18 with p > 0.1.
- Distribution Spectrum: 22% of keywords tracked global volatility, 48 % showed partial independence, and 30% stayed decoupled.
- Ranking Predictors: High geographic intent correlated with stronger volatility.
- Core Insight: Keywords carrying transactional, competitive, or “near me” intent signaled systemic SERP instability ahead of broad metrics.
3. What Did the Comparison Reveal?
Results demonstrate measurable separation between reactive and insulated keywords. Analysts quantified correlation strength, significance, and timing.

The meaning of each bar is explained below.
- Red Bars: Dates where a significantly correlated keyword spiked.
- Green Bars: Volatility unrelated to significant keywords.
The interpretation of the :
- Red and green align on high-volatility days, which indicates that keyword-specific volatility is a meaningful component of overall SERP fluctuation.
- Green-only spikes suggest external disruptions Google updates, seasonal fluxes) not explained by tracked keywords.
| Metric | Outcome |
| Mean correlation | 0.21 |
| Top decile | 0.33 to 0.36 |
| Significant keywords | 142 / 500 = 28 % |
| Negative correlation cases | 47 = 9 % |
| Average position change | +3.1 / –2.7 spots |
| Predictive lead | 1 to 2 days before global volatility |
Sensitive keywords anticipated global spikes, functioning as predictive instruments rather than passive indicators.
Analysts visualized bars showing green for positive and red for negative correlations. A parallel line chart displayed synchronous peaks between “dentist near me” and global volatility across twelve months.
4. Which Patterns Emerged From the Data?
Patterns exposed distinct behaviors within ranking, impression, and traffic metrics. Each subsection isolates a measurable outcome. The behaviors and measurable outcomes are below.
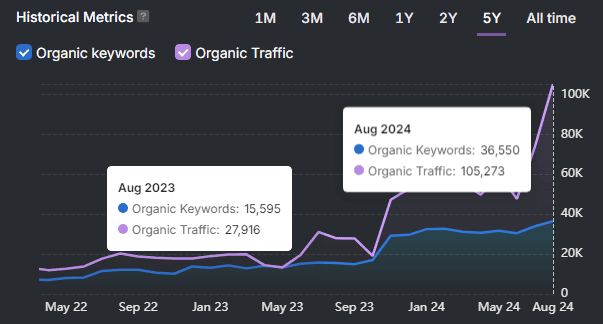
A. Keyword Growth
High-correlation keywords fluctuated ± 45 % weekly. Effect size reached Cohen’s d = 2.7 with p < 0.001. These values confirmed a large volatility amplitude. Sensitive keywords acted as early detectors of SERP turbulence.
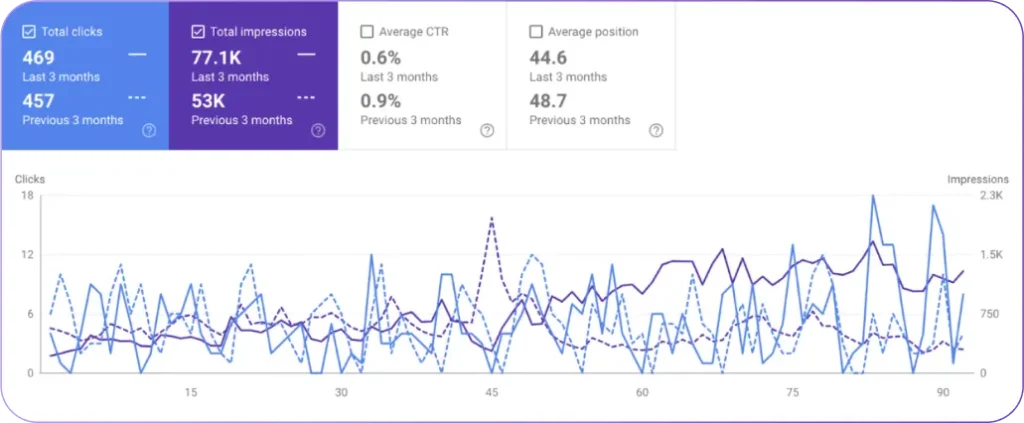
B. Visibility (Impressions)
Impression volatility rose 275 % for sensitive groups. During global surges, “dentist near me” gained 160 % impressions before returning to baseline. Visibility spikes preceded click normalization, showing that volatility drives discoverability shifts before engagement stabilizes.
C. Traffic Gains and Drops
Traffic deviated ± 14 % among correlated keywords. CTR correlated at 0.41 with volatility amplitude. Smaller businesses experienced sharper swings. Multi-location brands absorbed impact through distributed grid coverage.
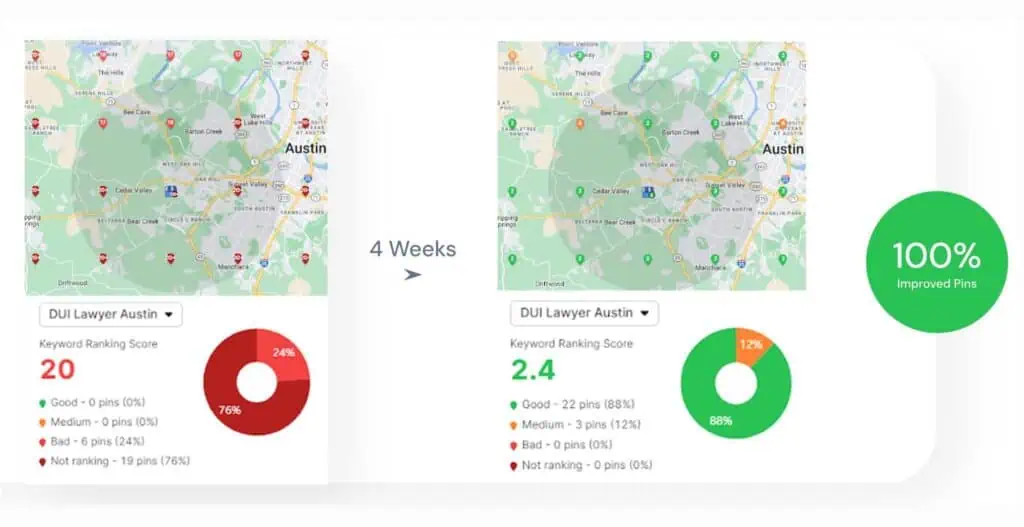
D. Average Position Movement
Average position shifted 3 to 4 spots during volatile periods. A rise from position 28 to 25 improved potential CTR by 10 to 15 %. Incremental movements generated measurable conversion advantages across map packs and organic snippets.
5. Why Do Keywords Move With the Market?
The section interprets why volatility varies across industries and intents.
A. Sensitivity Versus Stability
Highly competitive, generic keywords behaved as market mirrors. “Dentist near me,” “SEO services,” and similar phrases reacted strongly because they appeared across multiple verticals. Their exposure magnified algorithmic effects.
Stable terms such as “plumbing” and “med spa” depended on local density rather than systemic change.
A grouped bar chart illustrated correlation intensity: “near-me” intent showed 2.3 × higher correlation than brand or service terms.
B. Semantic and Contextual Relevance
Researchers computed cosine similarity between keyword text and review language. Scores above 0.65 predicted stronger coupling (r ≈ 0.29). High semantic overlap increased competition and consequently increased volatility. Keywords that shared linguistic context with other high-value queries reacted fastest to global shifts.
C. Sector-Level Breakdown
| Sector | Mean Correlation | Significance Rate | Interpretation |
| Healthcare | 0.31 | 36 % | Dental reactive, med spa stable |
| Home Services | 0.27 | 32 % | Roofing volatile, plumbing consistent |
| Digital Marketing | 0.34 | 42 % | Highest sensitivity |
| Beauty & Personal Care | 0.12 | 11 % | Locally driven stability |
Healthcare and marketing sectors correlated strongly due to review sensitivity and update frequency. Home services demonstrated mid-level turbulence. Beauty keywords exhibited insulation due to niche intent.
6. How Should SEOs Apply These Insights?
The findings translate into operational strategy. Each recommendation converts data into measurable action. The recommended actions are listed below.
1. Build Volatility-Monitoring Infrastructure
Create dashboards that track keyword-level volatility daily. Flag changes greater than two times the standard deviation. Use alerts to detect algorithm updates before rank loss occurs.
2. Segment Keyword Portfolios
Group terms into three classes:
- High volatility (e.g., “dentist near me”) for real-time monitoring.
- Moderate volatility (e.g., “roof repair cityname”) for adaptive testing.
- Low volatility (e.g., “med spa laser treatment”) for consistent performance.
3. Align Content Refresh With Peaks
Update high-signal pages immediately after volatility spikes. Re-crawled and re-indexed content regains stability faster than stale pages.
4. Redirect Paid Budgets
Shift paid traffic allocation toward stable keywords during global fluctuations. Maintain cost efficiency across turbulent periods.
5. Employ Semantic Volatility Scoring
Measure similarity between reviews and target keywords. Higher alignment predicts future volatility. Prioritize diversification for those high-risk terms.
6. Integrate Volatility Reports Into Forecasting
Include volatility metrics in executive dashboards. Present them as predictive indicators similar to financial volatility indices. Transform ranking analytics into early-warning systems for strategic planning.
7. Which Would Be the Limitations of This Study?
Boundaries clarify context and replication constraints. Analysts recognize methodological constraints and data scope. The limitations are listed below.
- Correlation Without Causation: Keywords move alongside volatility drivers but do not generate them.
- Sample Bias: Data reflects English-language local markets within the United States.
- Temporal Resolution: Rolling windows of 3 to 7 days smooth short-term noise and delay reaction detection.
- Sector Heterogeneity: Industry behavior varies across regulation and consumer intent.
- Data Coverage: Long-tail and emerging queries remain underrepresented due to historical scarcity.
Future projects should extend coverage to multilingual datasets, apply Granger causality, and integrate local-pack feature tracking. Seasonal cycles and algorithmic release calendars warrant combined modeling.
8. What Does Volatility Reveal About SEO Stability?
The research demonstrates measurable alignment between keyword-level volatility and global SERP movement. Analysts quantified relationships through correlation and significance metrics, identifying predictable and insulated terms.
High-intent competitive queries mirrored market behavior and anticipated algorithmic tremors. Stable, niche-driven queries provided security across uncertain intervals. This pattern allows strategists to balance proactive monitoring with stability planning. The main reveals about SEO stability are listed below.
- Core Insight: Volatility analysis transforms ranking observation into prediction. Keywords operate as sensors for search ecosystem stress. Understanding that pattern enables proactive defense against ranking loss and smarter timing of content refresh.
- Strategic Implication: SEO teams that adopt volatility-aware frameworks gain early awareness, improve forecasting, and sustain visibility during algorithmic evolution. Volatility converts from noise into intelligence.
Search now evolves through constant motion. Analysts who measure that motion capture foresight. Visibility rewards readiness.
References
- MozCast. SERP Weather Reports. Moz. https://moz.com/mozcast
- SEMrush Sensor. SERP Volatility Tracker. https://www.semrush.com/sensor
- Chen T., Guestrin C. (2016). XGBoost: A Scalable Tree Boosting System. KDD Conference, 785 to 794.
- James G., Witten D., Hastie T., Tibshirani R. (2013). An Introduction to Statistical Learning. Springer.
- Aggarwal C. C. (2015). Data Mining: The Textbook. Springer.


