

LLM (large language model) visibility for e-commerce impacts brand exposure, sentiment in AI recommendations, and the ability to defend or improve share of voice in commercial queries. The Search Atlas LLM Visibility tool addresses discovery, benchmarking, and optimization in one system, with four core data modules called Summary, Visibility, Sentiment, and Topics & Queries.

What is LLM Visibility?
LLM visibility is the measurement of how frequently and in what context a brand, product, or store appears in answers generated by large language models (LLMs) such as ChatGPT, Gemini, and Perplexity.
The Search Atlas LLM Visibility tool is an analytics dashboard that tracks, aggregates, and analyzes these AI-generated mentions.
The Search Atlas LLM Visibility tool quantifies visibility scores, sentiment, and citation sources across the most prevalent LLM platforms, which enables brands to monitor their AI-driven discoverability, benchmark competitive performance, and optimize content for higher inclusion in AI-powered shopping journeys.
How Does LLM Visibility Work?
The LLM Visibility in Search Atlas gives users a unified dashboard to monitor how often their brand, products, or store appear in answers from major large language models and how those mentions compare to key competitors.
The workflow begins when you select a brand, product, or URL within the Site Metrics dashboard of the Site Explorer in Search Atlas. The LLM Visibility tool automatically aggregates data from ChatGPT, Gemini, Perplexity, and Claude, then calculates visibility scores, sentiment ratings, and citation counts for the selected target.
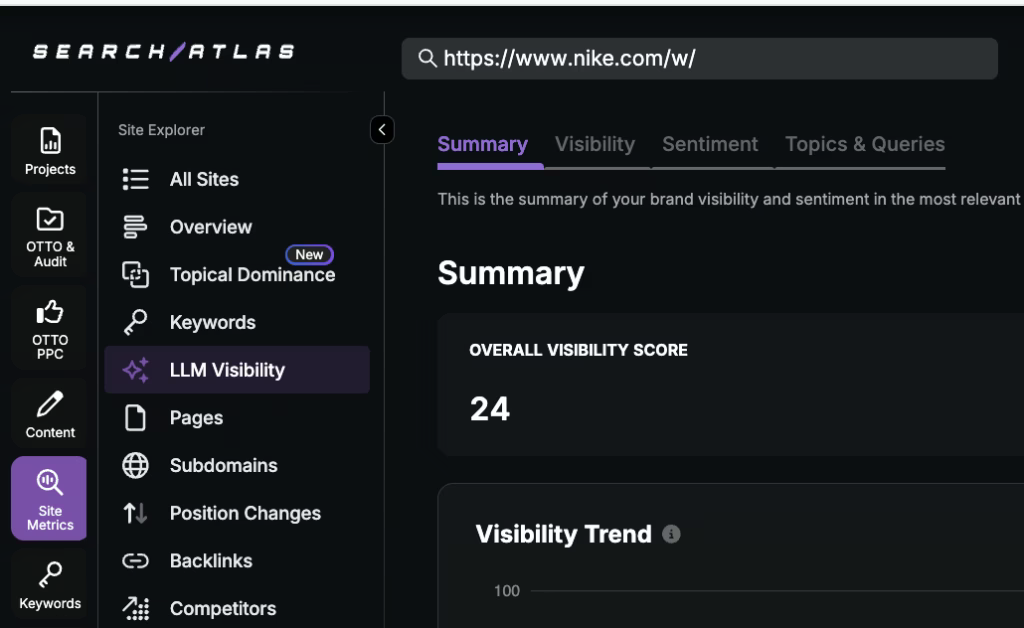
LLM Visibility provides a modular set of dashboards (Summary, Visibility, Sentiment, and Topics & Queries) that allow users to analyze AI exposure and perception from every angle.
Summary Dashboard
The summary dashboard in the Search Atlas LLM Visibility tool consolidates all findings. You see overall visibility and sentiment metrics, plus total citations found across all AI platforms. The Visibility Trend chart shows performance changes over time, while the side-by-side Visibility vs Competitors graph compares the AI presence of your brand against the most prevalent competitors.
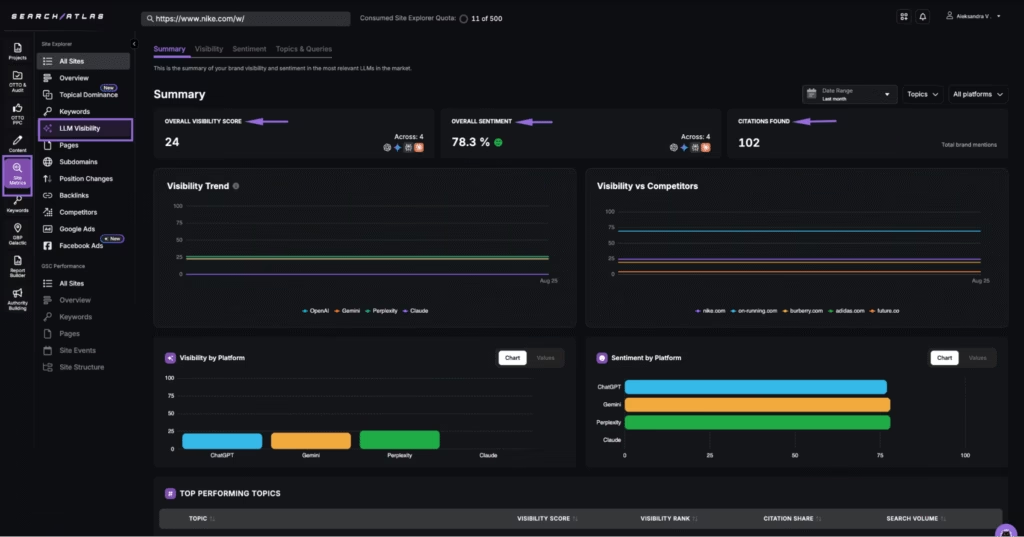
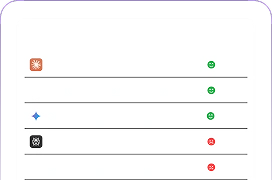
Platform breakdowns highlight which LLMs cite your brand most frequently, and sentiment analysis clarifies whether those mentions are positive, neutral, or negative.
Visibility Dashboard
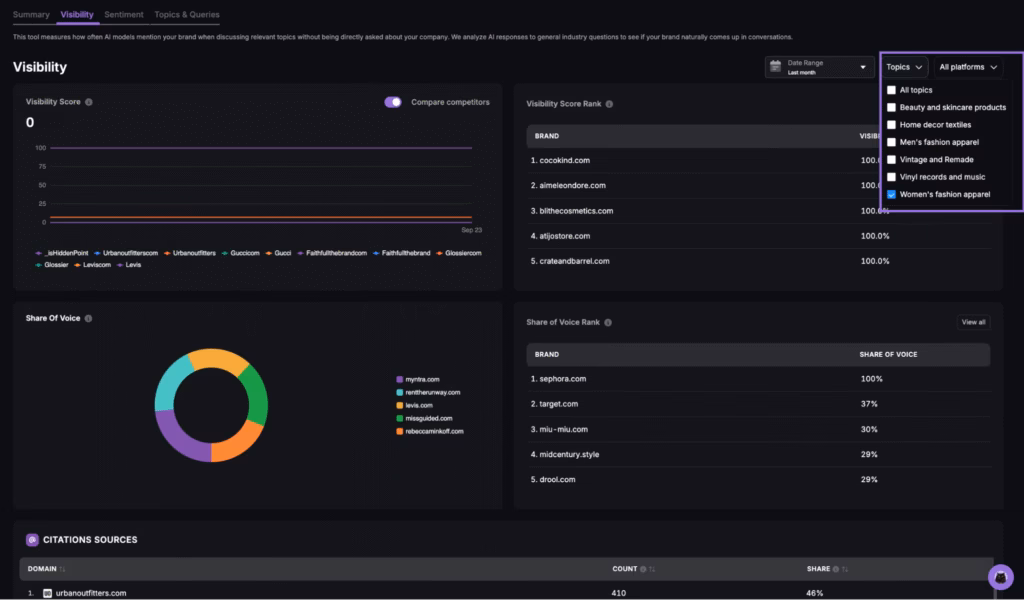
The Visibility dashboard in the Search Atlas LLM Visibility tool quantifies how frequently your brand, products, or competitors appear in LLM-generated answers. The LLM Visibility tool presents the overall visibility score, plots mention trends, and breaks down share of voice among top brands.
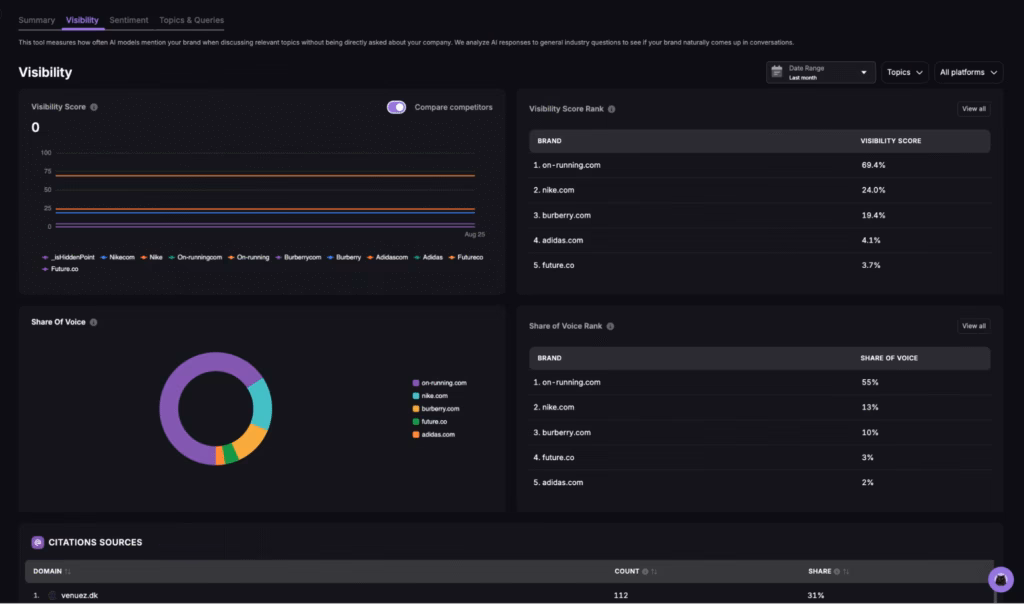
Visibility Score Rank lists who leads for brand exposure, while the donut chart visualizes which competitors claim the highest percentage of AI mentions (Share of Voice).
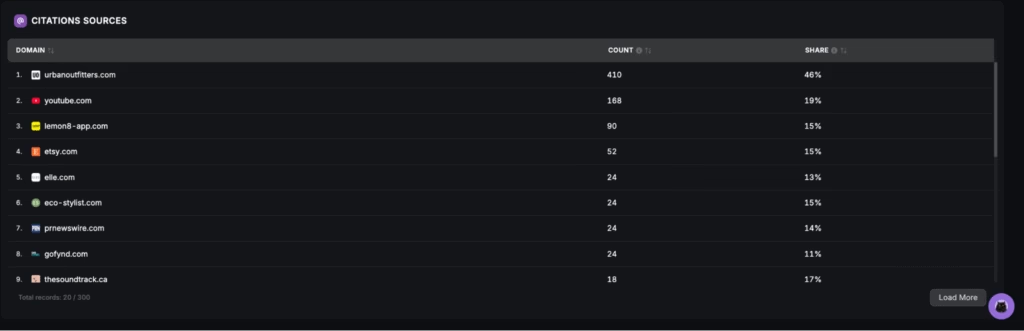
Citation sources are cataloged so you see which domains drive LLM recognition. Use this view to track which brands dominate conversations and where your own coverage lags.
If the dashboard shows a low share of voice or unfavorable sentiment for a critical product or category, you are able to quickly identify underperforming queries and adjust PDPs (product detail pages) or FAQ (Frequently Asked Questions) content.
Sentiment Dashboard
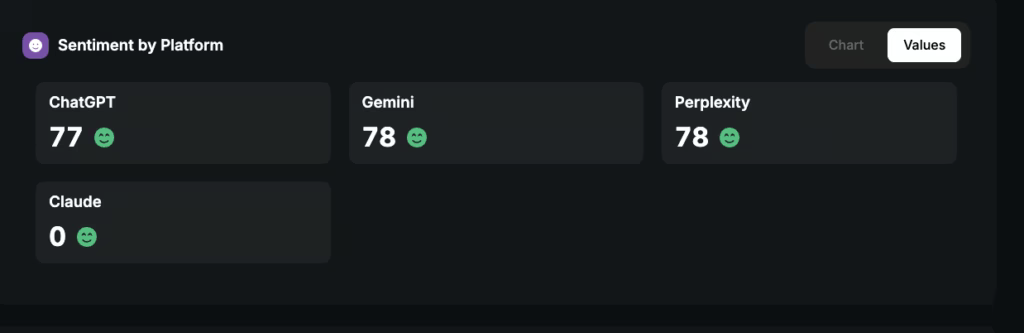
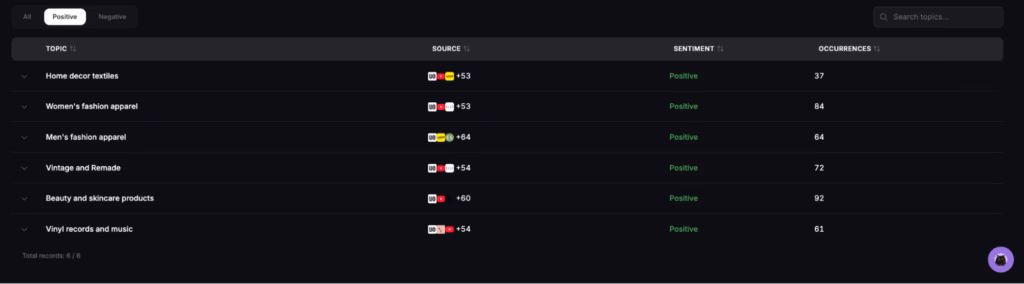
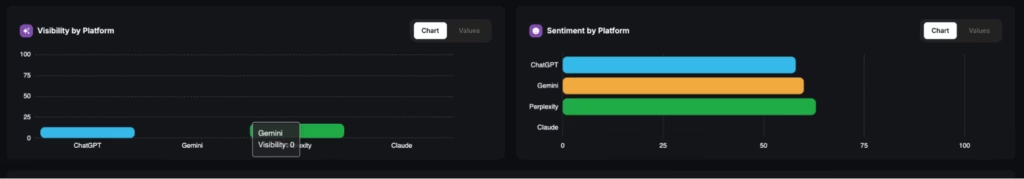
The Sentiment dashboard measures how positively or negatively LLMs describe your brand and products. You see both an average sentiment trend and a breakdown by AI platform, revealing which LLMs describe you most favorably.
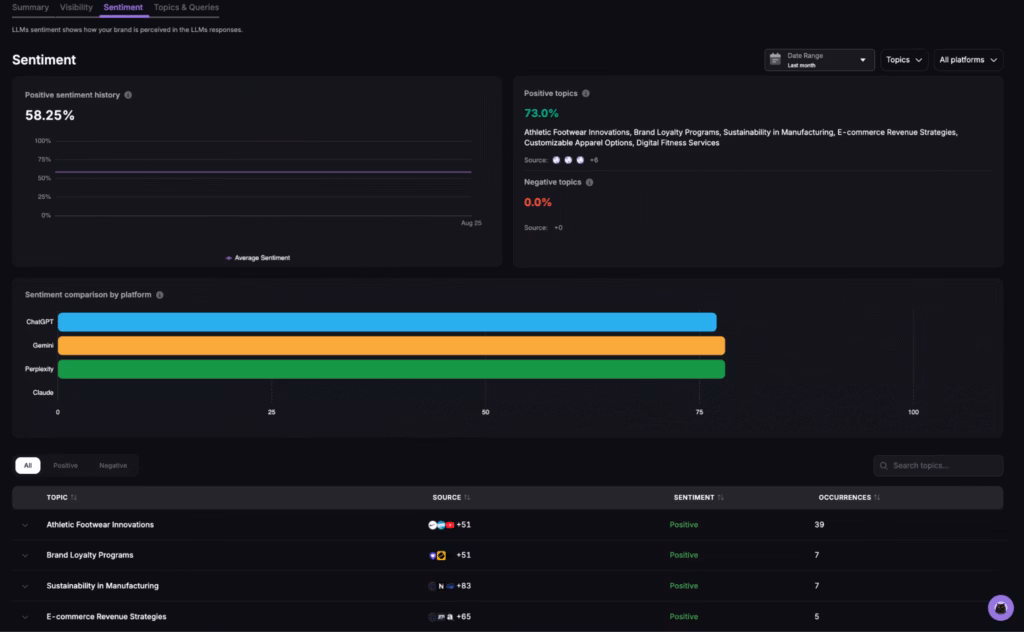
Positive topics are listed with their contribution percentages, so you know which attributes (such as “Athletic Footwear Innovations” or “Brand Loyalty Programs”) boost the image of your brand.
Below, sentiment by platform exposes where reputation risks or strengths concentrate. Topic-level sentiment details let you pinpoint the language and subjects that most affect public perception in AI responses.
Topics & Queries Dashboard
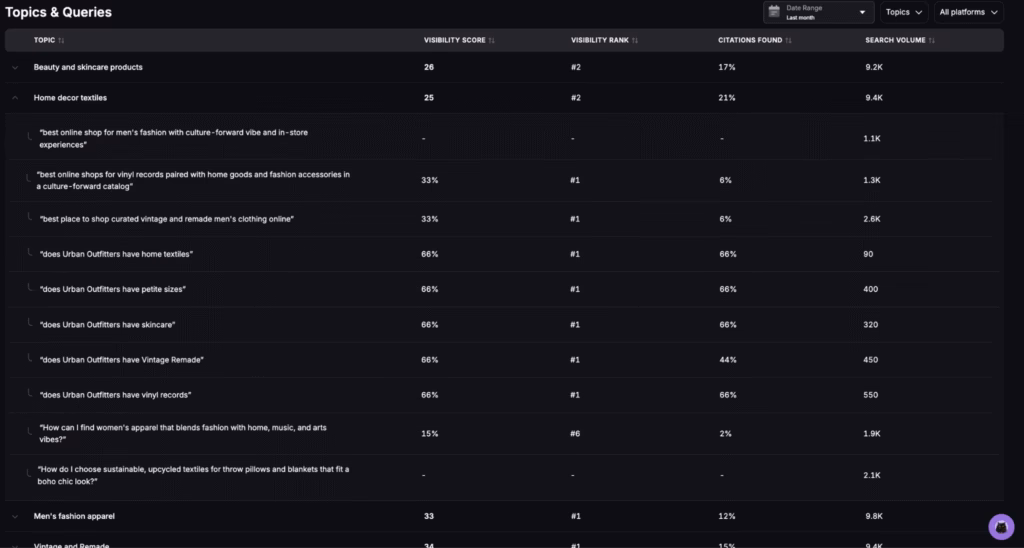
The Topics & Queries dashboard uncovers the exact prompts, questions, or keywords that trigger LLMs to mention your brand. Each topic includes a visibility score, rank, citation share, and associated search volume.
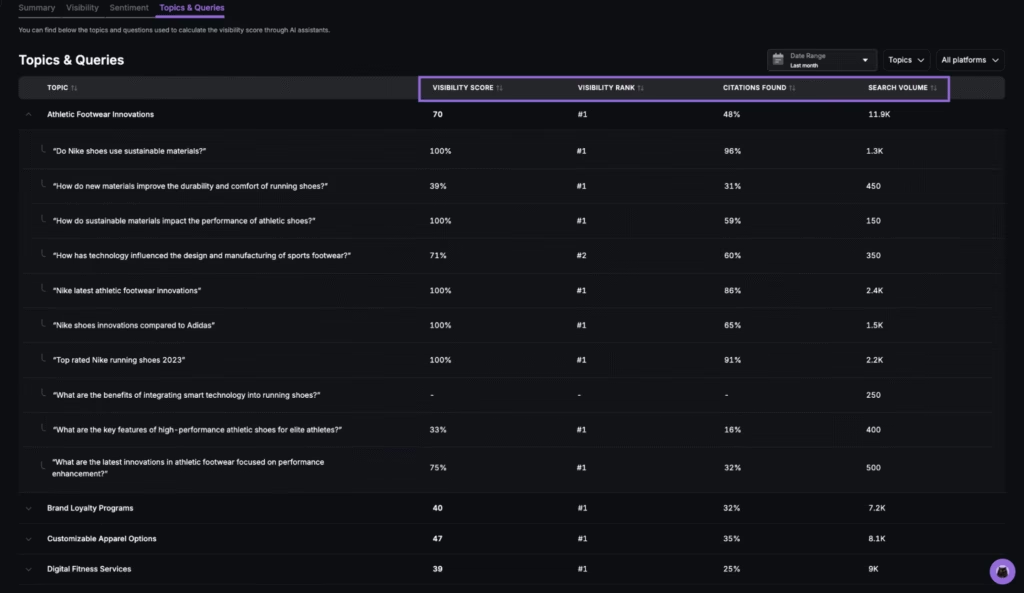
This view helps you identify which products, features, or themes generate the most AI citations and where to focus future optimization.
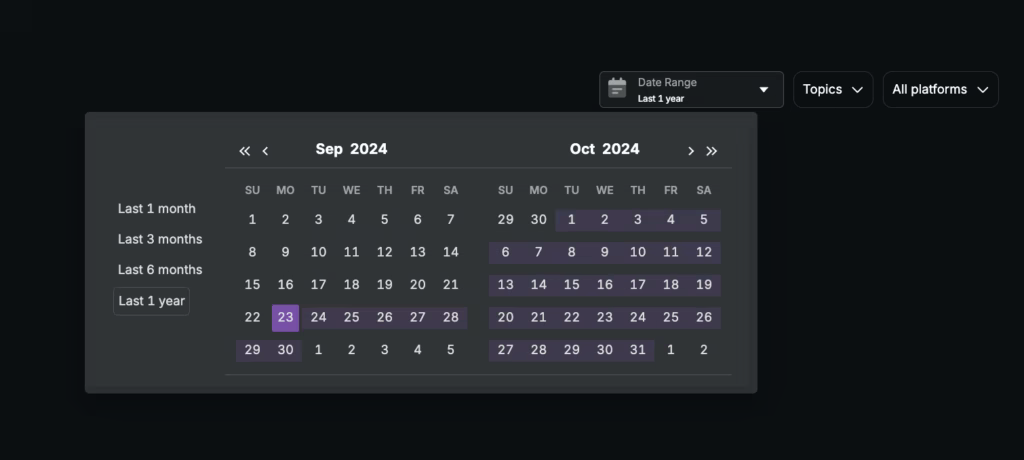
Drill down to see where you rank for critical commercial queries, track the share of voice against specific competitors, and filter for platform, time range, and topic to customize every analysis to current campaigns or seasonal trends.
Use exports and reports to coordinate efforts across SEO, marketing, and product teams.
Why Does LLM Visibility Matter for E-Commerce?
LLM visibility determines whether e-commerce brands, products, and offers are discoverable and trusted when consumers use AI-powered search and chat assistants for shopping decisions.
High LLM visibility means AI platforms recommend your store or products more often, describe them with positive sentiment, and position your brand competitively against rivals in response to buyer queries.
LLM visibility contributes to the 5 e-commerce goals listed below.
- Shaping product discovery in AI shopping. LLM visibility measures if your products appear in AI-generated answers to buyer queries. Higher mention frequency increases your inclusion in AI-driven lists and guides.
- Monitoring brand reputation and sentiment. LLM visibility reveals how AI platforms describe your pricing, reliability, and service. Positive sentiment draws buyers. Negative sentiment blocks conversions or signals reputation risk. Early warnings enable rapid action before problems escalate.
- Defending share of voice. LLM visibility benchmarking shows if DTC (Direct-to-consumer) competitors are overtaking your brand in AI recommendations. Maintaining a share of voice keeps your store prominent in AI-generated shopping results.
- Optimizing content for AI commerce. LLM visibility analytics identify which PDPs, FAQs, or category descriptions trigger AI mentions. Teams update content to match high-volume queries, which increases the odds that LLMs recommend your products.
- Reducing risk of missed sales and crisis amplification. Low or negative LLM visibility means lost demand and amplifies minor problems into major risks. Ongoing monitoring allows brands to fix weaknesses, protect their reputation, and regain market share.
What Are the Key Use Cases of LLM Visibility for E-Commerce?
The LLM Visibility tool unlocks practical use cases for e-commerce brands and operators by transforming raw AI analytics into actionable decisions for your e-commerce business.
Each use case below explains exactly how to use the dashboards, metrics, and filters to answer real commercial questions.
How Can I Track Product Discovery in AI Shopping Journeys?
To track product discovery in AI shopping journeys, use the Topics & Queries dashboard to review which of your products appear in LLM answers to commercial questions such as “vintage and remade men’s clothing online.”
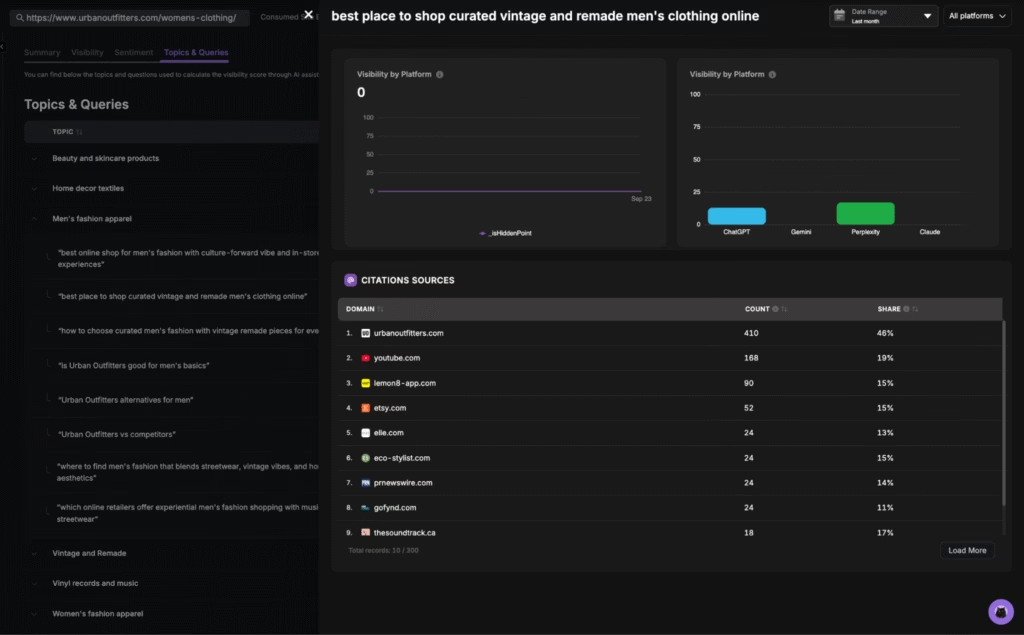
Check results by platform and date to see how you show up in AI recommendations, at what count, and which share of voice. Analyze changes in mention volume after content updates, product launches, or campaign pushes to validate whether your products are being discovered in real AI shopping journeys.
How Do I Understand the Sentiment of AI Recommendations?
To understand the sentiment of AI recommendations, open the Sentiment dashboard to see if LLMs describe your brand as affordable, premium, reliable, or problematic.
Sentiment metrics display both aggregate and platform-specific tone for your store and individual products. Review positive and negative topic clusters to understand what attributes or issues drive sentiment.

Use these insights to reinforce messaging that resonates or to correct issues that damage reputation in AI-generated content.
How Do I Benchmark Against Competitors?
Benchmarking against competitors with LLM Visibility uses real AI data to reveal which brands, stores, or products dominate generative answers and which fall behind.
The Visibility dashboard provides side-by-side rankings for your brand and top competitors, based on visibility score and share of voice.
The Visibility Score Rank table displays a direct comparison of mention frequency across LLMs. Share of Voice Rank shows the percentage of AI-generated mentions each brand claims within your category or for selected queries.
Use filters for platform, date range, or product topic, such as “women’s fashion apparel” or “home decor textiles”, to narrow the comparison to what matters for your market. Visual charts and rank tables reveal whether you lead or lag in visibility, which competitors are gaining traction, and which search prompts drive AI preference toward rival stores.
Citations Sources further expose which third-party domains include the mentions of your competitors.
Combine this with query-level data to uncover not only who dominates AI responses, but why, which enables you to adjust PDPs, campaigns, and content strategy to close the gap or defend your position. This approach transforms competitor benchmarking from static SEO monitoring into real-time, actionable insight for AI-driven commerce.
How Can I Monitor Crises Early?
To monitor crises early, review the Sentiment and Topics dashboards to spot negative mentions or spikes in unfavorable sentiment. Early crisis detection depends on reviewing dashboard trends, examining topic-level sentiment changes, and investigating citation sources for the origin of negative narratives.
Early crisis detection allows you to intervene with content updates, public statements, or operational fixes before problems escalate into reputation crises.
How Do I Optimize My Content Strategy?
Optimize your content strategy by using the Topics & Queries dashboard to identify the specific prompts and product attributes that trigger LLM mentions, and those that do not.
Firstly, review visibility scores and ranks for each query related to your products, categories, and features. High visibility for a prompt like “does Urban Outfitters have home textiles?” signals that your existing PDPs and descriptions align with how LLMs interpret user intent.
Low or missing visibility for queries with high search volume (e.g., “best place to shop curated vintage and remade men’s clothing online”) highlights gaps or content mismatches.
Secondly, compare citation counts and citation shares for critical topics. When you see high search volume but low citation share, your product copy or category page is not matching LLM expectations or is being outranked by competitors. Use this insight to revise content: update PDPs, add missing attributes, clarify category navigation, and answer buyer questions directly in page text.
Thirdly, filter queries by topic or platform to prioritize updates that address the most influential prompts in your category. Track the impact of your changes by monitoring shifts in visibility rank, sentiment, and citation share for targeted queries over subsequent crawls or data updates.
You maximize your likelihood of being included in AI-generated recommendations, guides, and shopping lists by aligning on-page content and PDP details with the high-impact queries and topics surfaced in the dashboard. This turns LLM analytics into concrete edits that drive new AI-driven sales and defend share of voice in your market.
How Do I Measure the Success of Product Launches in AI Search?
To measure the success of product launches in AI search, after introducing new SKUs or running a campaign, monitor the dashboards for increases in mention frequency and positive sentiment for the new products.
Track visibility trends immediately post-launch to confirm if LLMs recognize and recommend the new entries. Adjust messaging or outreach if results lag behind expectations.
How Do I Uncover Hidden Brand Advocates or Citation Sources?
Dive into the Citations Sources panel to find which third-party sites, blogs, or forums LLMs use as evidence for mentioning your brand. Identify influential advocates or high-impact domains and consider strategic outreach, co-marketing, or content collaboration with the Search Atlas Link Building Outreach and Digital PR Tool.
Secure features, reviews, or backlinks on high-impact domains using the Search Atlas Link Building Outreach and Digital PR Tool to increase the likelihood your brand is cited as authoritative in future AI-generated answers.
How Do I Use Platform-level Insights to Tailor Strategy?
Compare results across major LLM platforms (ChatGPT, Gemini, Perplexity, and Claude) using the platform breakdowns in every dashboard. See which AI systems mention your brand most frequently, where sentiment is strongest, and which competitors are favored by each LLM. Prioritize content, schema, and outreach updates to platforms where your market lags or where commercial opportunities are highest.
How do I support compliance and brand safety?
To support compliance and brand safety, monitor for unauthorized, outdated, or inaccurate product mentions in LLM answers. Use citation tracking and sentiment dashboards to identify risks, such as misinformation or off-brand claims. Coordinate with compliance, legal, or PR teams to issue corrections, update content, or request removals where necessary.
What Is an Example Scenario in E-Commerce?
An example scenario illustrates how the Search Atlas LLM Visibility Tool translates AI-driven discovery gaps into concrete action steps for e-commerce optimization.
Scenario Description
A user submits the query, “Which online store has the best deals on wireless earbuds?” to 3 major language models.
The responses are below.
- ChatGPT recommends Competitor A.
- Gemini lists Amazon and your store.
- Perplexity omits your store entirely.
Dashboard Findings
LLM Visibility aggregates 3 results and presents clear metrics as listed below.
- Share of Voice. Your brand appears in 1 out of 3 LLMs for this commercial query, which shows 33% visibility for the search intent.
- Sentiment. The description of your offer in Gemini is factual and lacks value positioning, while ChatGPT assigns strong positive language to Competitor A. Amazon is referenced with trust cues.
- Competitor Benchmark. Historical trend charts reveal Competitor A consistently leads in LLM-generated answers for wireless earbuds.
Data Interpretation
The insights from the Search Atlas LLM Visibility tool reveal weak brand coverage and insufficient persuasive language in AI recommendations for your store. The lack of mention in Perplexity signals missed technical or content alignment, while competitive data shows rivals securing top positioning for deal-seeking queries.
Remediation Actions
The direct actions to fix your LLM visibility based on your findings are below.
- Revise product detail pages to include price, deal, and value-focused language matching the query intent (“best deals on wireless earbuds”).
- Create or expand comparison content that addresses the strengths of your offer versus competitors, with clear, answer-focused formatting.
- Refine category and FAQ content to increase contextual triggers for LLMs to recommend your store for promotional and budget-conscious shopping queries.
- Monitor LLM Visibility for changes in share of voice, platform coverage, and the quality of brand language as updates are deployed.
This scenario illustrates a closed-loop process. Firstly, you identify coverage and positioning weaknesses. Secondly, you implement targeted improvements. Thirdly, you measure progress directly within the Search Atlas LLM Visibility tool dashboards to drive measurable gains in AI-driven e-commerce discovery.
Use the Search Atlas LLM Visibility tool to quantify the AI presence of your brand, benchmark against leading competitors, and turn insights into measurable growth for e-commerce discovery.
Optimize your product and content strategy now to secure top placement in AI-generated recommendations and drive new sales from the fastest-growing channel in commerce.