

How to Track Traffic from Google Gemini is the structured process of identifying, segmenting, validating, and optimizing website sessions and AI citations generated through Google Gemini-powered search environments. Google Gemini Traffic refers to visits, impressions, and brand exposure originating from Gemini AI Overviews and conversational AI responses inside Google Search. Tracking AI traffic matters because generative answers increasingly replace traditional link-based navigation, which shifts visibility from rankings to citation inclusion and engagement quality. Businesses that track Gemini traffic gain clarity on how AI-driven discovery influences sessions, conversions, and brand authority.
To track Gemini traffic accurately, businesses configure Google Analytics 4 (GA4) beyond default referral classification. Tracking AI traffic requires identifying gemini.google.com as a Session source, creating a Custom Channel Group labeled “Artificial Intelligence,” applying regex-based filters, and using UTM parameters to prevent misattribution as direct traffic. Data sources for tracking Google Gemini Traffic include GA4 referral data, server log analysis for raw request validation, Looker Studio dashboards for visualization, and specialized AI SEO & visibility trackers for citation monitoring. These combined sources reduce blind spots caused by zero-click AI consumption and incomplete referrer transmission.
The metrics that matter most when tracking Gemini traffic are volume metrics (sessions and growth rate), engagement metrics (bounce rate, average session duration, and event completion), visibility metrics (AI Overview Citation Frequency and AI Share of Voice), technical metrics (Gemini Code Assist adoption and deployment velocity), and GA4 attribution metrics (Source, Medium, and Campaign). Increasing Google Gemini Traffic requires targeting conversational long-tail queries, providing direct and concise answers, reinforcing E-E-A-T authority signals, building topic clusters, optimizing mobile performance, and monitoring AI citations regularly. Tracking AI traffic effectively combines attribution accuracy, behavioral analysis, and structured content optimization within generative search environments.

What is Google Gemini Traffic?
Google Gemini Traffic is an AI-powered conversational navigation feature integrated into Google Maps, allowing users to interact with Google Gemini through voice commands while navigating. Google Gemini Traffic refers to the implementation of Google Gemini, a generative artificial intelligence system, inside Google Maps to provide real-time information retrieval, task execution, and contextual recommendations during active routes. Google Gemini Traffic matters because it transforms navigation from static route guidance into AI-assisted interaction grounded in live geographic data.
Google Gemini Traffic is activated by saying “Hey, Google” or tapping the Gemini icon within Google Maps. Google Gemini Traffic was integrated into Google Maps in December 2025, according to CNET. Google Gemini Traffic leverages Google Maps street-level data, place databases, and Google artificial intelligence models to deliver route-aware responses. Google Gemini Traffic operates as a hands-free interface designed to enhance user experience during driving conditions.
What type of entity is Google Gemini Traffic? Google Gemini Traffic is a conversational AI navigation interface embedded within a mapping application. Conversational AI navigation interfaces are artificial intelligence systems that interpret natural language input and execute route-related tasks inside digital mapping environments. Google Gemini Traffic belongs to this entity class and connects directly to Google Maps infrastructure, which differentiates Google Gemini Traffic from peer voice assistants such as Siri and Alexa. Google Gemini Traffic accesses real-time traffic data, geographic metadata, and user route context to produce situationally relevant answers.
What are the core functionalities of Google Gemini Traffic? The core functionalities of Google Gemini Traffic are information retrieval, recommendations, task management, reporting, summarization, and visual context integration.
The functionalities of Google Gemini Traffic are listed below.
- Information Retrieval: Google Gemini Traffic answers complex questions during navigation, including route-based and contextual inquiries.
- Recommendations: Google Gemini Traffic suggests route-relevant options such as budget-friendly vegan restaurants along a selected path.
- Task Management: Google Gemini Traffic adds calendar events and creates to-do lists through voice commands.
- Reporting: Google Gemini Traffic allows users to report crashes and incidents using spoken input
- Summarization: Google Gemini Traffic summarizes sports results, emails, and news while navigation continues.
- Lens Integration: Google Gemini Traffic uses camera input to provide contextual information about location popularity and ambiance.
What are the defining characteristics of Google Gemini Traffic? The defining characteristics of Google Gemini Traffic are listed below.
- Grounded Data Access: Google Gemini Traffic is grounded in Google Maps’ street and place data, providing real-time location intelligence.
- Privacy Safeguards: Google Gemini Traffic does not use provided conversational information for targeted advertising, which preserves user privacy.
- Ecosystem Scale: Google Gemini Traffic operates within Google Maps, which serves over 2 billion monthly users worldwide, increasing its adoption potential.
How does Google Gemini Traffic function within the Google ecosystem? Google Gemini Traffic functions are listed below.
- Dependency: Google Gemini Traffic depends on Google Maps navigation systems, Google AI models, and user voice input.
- Enablement: Google Gemini Traffic enables hands-free access to information, route-aware personalization, and integrated task execution.
- Competition: Google Gemini Traffic competes with other navigation applications and AI voice assistants that provide real-time route assistance.
Google Gemini Traffic is tested in California and other regions across the United States. Google Gemini Traffic enhances navigation by combining generative artificial intelligence with geographic context, which positions Google Gemini Traffic as a scalable AI-assisted navigation interface within the global mapping ecosystem.
Why is Tracking Traffic From Google Gemini Important?
Tracking Traffic From Google Gemini is important because Google Gemini generates unattributed direct traffic, requires structured parameter tagging for accurate segmentation, and influences measurable performance through AI-referenced landing pages. Tracking Traffic From Google Gemini allows businesses to correctly attribute AI-driven discovery, measure engagement quality, and evaluate the impact of generative search visibility on conversions.
Why is direct traffic from Google Gemini significant? Direct traffic from Google Gemini is significant because users frequently copy and paste URLs from AI responses, which bypasses traditional referral attribution. Google Gemini and similar AI systems often present links inside generated answers. Users open those links in new tabs or paste URLs manually, which causes analytics platforms to record the session as “Direct” instead of “Referral.” This behavior distorts channel reporting and inflates direct traffic metrics. Tracking Traffic From Google Gemini corrects attribution gaps and clarifies how AI-generated answers contribute to website visits and user engagement patterns.
How can UTM parameters be used to track traffic? UTM parameters can be used to track Google Gemini Traffic by appending structured source identifiers to controlled links. UTM parameters (Urchin Tracking Module parameters) are URL query strings that define traffic source, medium, and campaign attributes inside analytics systems. When businesses distribute links that include utm_source=gemini or similar structured identifiers, Google Analytics 4 (GA4) segments that traffic accurately instead of classifying it as generic referral or direct traffic. Tracking Traffic From Google Gemini with UTM parameters enables campaign-level analysis, behavioral comparison, and conversion attribution tied specifically to AI-driven sessions.
What makes dedicated landing pages effective for tracking AI-driven traffic? Dedicated landing pages are effective for tracking Google Gemini Traffic because they function as measurable proxies for AI-referenced content. AI systems frequently cite specific definitions, guides, or explanatory pages. When businesses create focused landing pages designed for AI citation and monitor traffic spikes to those pages, they isolate AI influence patterns. Dedicated landing pages allow businesses to measure engagement metrics (bounce rate, session duration, conversion rate) specifically for AI-referenced content. Tracking Traffic From Google Gemini through landing-page monitoring provides structured evidence of AI-driven discovery impact, even when referrer data remains incomplete.
Tracking Traffic From Google Gemini improves attribution accuracy, clarifies AI performance contribution, and enables strategic optimization for generative search environments where referral signals do not follow traditional tracking patterns.
What Is the Difference Between ChatGPT and Gemini Traffic?
The difference between ChatGPT Traffic and Gemini Traffic is that ChatGPT Traffic reflects a mature, high-volume but stabilizing user base, while Gemini Traffic reflects a newer, rapidly expanding traffic pattern driven by Google ecosystem integration. ChatGPT Traffic and Gemini Traffic are both AI-driven conversational platform traffic sources, but they differ in origin, growth velocity, ecosystem integration, and market trajectory. This comparison matters because traffic behavior signals platform adoption trends and influences strategic decisions in AI visibility and marketing focus.
ChatGPT is a conversational AI platform launched in 2021 by OpenAI. Gemini is a conversational AI platform launched in November 2023 by Google. ChatGPT Traffic represents visits and user interactions within the OpenAI ecosystem, while Gemini Traffic represents visits and interactions within the Google-integrated AI ecosystem.
What are the measurable traffic differences between ChatGPT and Gemini? ChatGPT Traffic shows stabilization with a slight decline in specific periods, while Gemini Traffic shows aggressive growth following launch.
The comparison of traffic metrics is listed below.
| Feature / Aspect | ChatGPT | Gemini |
| Origin & History | Launched in 2021 by OpenAI | Launched in November 2023 by Google |
| December Traffic Change | Decreased by 5.6% | Increased by 28.4% |
| Year-over-Year Growth | Increased by 49.5% | Increased by 563.6% |
| December Site Visitors | 5.5 billion | 1.7 billion |
| Performance Trend | Stable traffic with a slight decline | Rapid growth post-launch |
| Ecosystem Size | Established a large user base | Rapidly growing new-user base |
| Community Support | Strong developer and community support | Emerging community support |
| Corporate Backing | Backed by OpenAI | Backed by Google |
When should businesses prioritize ChatGPT Traffic? Businesses prioritize ChatGPT Traffic when stability, large user volume, and a mature ecosystem support are primary decision factors.
The reasons to choose ChatGPT are listed below.
- You require a stable and established AI user base.
- Developer community resources are essential.
- Traffic consistency outweighs rapid growth potential.
When should businesses prioritize Gemini Traffic? Businesses prioritize Gemini Traffic when growth velocity, Google ecosystem integration, and expansion potential are strategic priorities.
The reasons to choose Gemini are listed below.
- You want exposure inside a rapidly expanding AI platform.
- Google integration aligns with your operational infrastructure.
- You prioritize innovation tied to Google AI development cycles.
How do performance and cost considerations differ? ChatGPT Traffic reflects operational stability, while Gemini Traffic reflects scaling dynamics that may influence cost structures over 3 to 5 years. ChatGPT benefits from ecosystem maturity and tooling depth. Gemini may offer integration advantages and cost efficiencies due to ecosystem bundling inside Google products. Total cost of ownership depends on deployment scale, integration complexity, and long-term user engagement stability.
ChatGPT Traffic and Gemini Traffic both represent viable AI-driven discovery channels. ChatGPT Traffic emphasizes scale and maturity. Gemini Traffic emphasizes growth and ecosystem expansion. Strategic choice depends on whether stability or expansion aligns with business objectives.
How to Measure Google Gemini Traffic in Google Analytics 4?
Measuring Google Gemini Traffic in Google Analytics 4 (GA4) requires structured source identification, AI channel segmentation, parameter tagging, advanced reporting, and internal AI usage monitoring. Google Gemini Traffic refers to sessions originating from Gemini-powered AI interactions, including AI Overviews and conversational responses. GA4 classifies most Gemini Traffic as referral or direct traffic by default, which makes configuration necessary for accurate attribution.
The 5 structured methods to measure Google Gemini Traffic in Google Analytics 4 are listed below.
- Identify Gemini Traffic in Google Analytics 4
- Create a Custom Channel Group for AI Traffic
- Use UTM Parameters
- Create an Exploration Report
- Monitor Gemini Code Assist Usage
1. Identify Google Gemini Traffic in the Traffic Acquisition Report
Identifying Gemini Traffic in Google Analytics 4 (GA4) is important because AI-driven sessions are frequently misclassified, aggregated, or stripped of referrer data, which prevents accurate measurement of AI impact. Identifying Gemini Traffic ensures that website owners measure AI-generated visits separately from organic, referral, or direct channels. Google Gemini Traffic refers to sessions originating from Gemini-powered interactions, including AI Overviews and conversational responses that lead users to external websites.
Why is it difficult to measure AI-driven traffic? AI-driven traffic is difficult to measure because Google Search Console (GSC) does not reliably attribute visits originating from AI-generated responses. Google Search Console groups AI-related clicks broadly, which prevents clear identification of Gemini-specific performance. Without isolating Gemini Traffic in GA4, website owners misinterpret AI influence as organic or referral traffic. Misinterpretation leads to inaccurate marketing decisions and distorted acquisition reporting.
Why are AI clicks often grouped? AI clicks are often grouped because Google Search Console aggregates most AI-driven sessions into broad “AI referral” or general search categories. Aggregation removes platform-level visibility and prevents granular analysis of Gemini Traffic versus other AI platforms. When Gemini Traffic is grouped with other sources, performance comparisons become unreliable and optimization priorities become unclear.
What is the impact of missing referrer data? Missing referrer data causes Gemini-driven visits to appear as direct traffic inside GA4. When users copy and paste URLs from Gemini responses, analytics platforms record the session as “Direct” instead of “Referral.” This misattribution inflates direct traffic metrics and obscures the true contribution of Gemini Traffic. Inflated direct traffic weakens channel attribution accuracy and reduces the ability to measure AI-driven discovery patterns.
How can Gemini Traffic be properly identified in Google Analytics 4? Gemini Traffic is properly identified in GA4 by filtering the Session source dimension using a regex match for gemini.google.com.
Follow the steps listed below.
- Navigate to Reports → Lifecycle → Traffic Acquisition.
- Change the primary dimension to Session source.
- Add a filter where the Session source matches a regex.
- Use the expression: gemini\.google\.com.
This method isolates Gemini Traffic from generic referrals and direct sessions. Identifying Gemini Traffic enables accurate AI channel reporting, clearer attribution modeling, and reliable evaluation of AI-driven user behavior.
2. Create a Custom Channel Group for AI Traffic
Creating a Custom Channel Group for AI Traffic in Google Analytics 4 (GA4) is important because it isolates Google Gemini Traffic from generic referral traffic, enables platform-level AI attribution, and allows retroactive historical analysis. A Custom Channel Group in Google Analytics 4 is a configurable traffic classification layer that groups sessions based on defined source or medium conditions. Creating a Custom Channel Group specifically for AI Assistants ensures that Google Gemini Traffic is measured as a distinct acquisition channel rather than merged with unrelated referrals.
Why is measuring traffic from AI Assistants important? Measuring traffic from AI Assistants is important because AI-driven sessions are frequently grouped under general referral or organic categories. AI Assistants such as Google Gemini generate traffic through conversational interfaces, AI Overviews, and answer-based interactions. Without a dedicated channel, Google Gemini Traffic becomes indistinguishable from other referral sources. Creating a channel group labeled “Artificial Intelligence” enables structured classification using source-level rules, which improves attribution accuracy and channel clarity.
How does identifying and tracking traffic from specific AI assistants benefit analysis? Identifying and tracking traffic from specific AI assistants benefits analysis by enabling granular segmentation of user behavior, engagement, and conversion patterns. When Google Gemini Traffic is isolated as its own channel, businesses compare bounce rate, session duration, landing page performance, and conversion rate against organic, paid, and direct channels. Platform-level segmentation reveals how users interact differently after arriving from Google Gemini compared to other AI assistants. This structured analysis supports AI-focused optimization strategies and more accurate ROI evaluation.
What makes the retroactive application of custom channel groups significant? The retroactive application of Custom Channel Groups is significant because Google Analytics 4 applies new channel definitions to historical data. Retroactive classification enables businesses to analyze past Google Gemini Traffic trends without losing previously collected session data. This capability provides longitudinal insight into AI-driven growth patterns, seasonal shifts, and citation-driven spikes. Historical visibility strengthens performance benchmarking and improves forecasting accuracy.
How should a Custom Channel Group for Google Gemini Traffic be configured in GA4? A Custom Channel Group for Google Gemini Traffic should be configured using a source-based regular expression rule.
Follow the steps listed below.
- Navigate to Admin → Data Display → Channel Groups.
- Click Create new channel group.
- Name the channel Artificial Intelligence.
- Set the rule condition to Source matches regex.
- Use the expression: gemini\.google\.com.
- Place the Artificial Intelligence channel above the default Referral channel.
This configuration ensures that Google Gemini Traffic is separated from generic referral sessions and consistently attributed as AI-driven traffic.
Creating a Custom Channel Group for AI Traffic strengthens Google Gemini Traffic measurement by improving attribution precision, enabling platform-level behavioral analysis, and preserving historical comparability across reporting periods.
3. Use UTM Parameters
Using UTM Parameters to track Google Gemini Traffic is important because UTM parameters define traffic origin, attribute campaign performance, enable precise channel segmentation, and prevent misclassification inside Google Analytics 4 (GA4). UTM parameters (Urchin Tracking Module parameters) are URL query strings that assign structured source, medium, and campaign identifiers to inbound traffic. UTM parameters matter for Google Gemini Traffic because AI-driven visits often appear as referral or direct sessions when no structured tagging exists.
Why is determining the origin of website traffic significant? Determining traffic origin is significant because accurate source attribution enables correct channel performance evaluation. Google Gemini Traffic may be classified as referral or direct when users copy and paste links from AI responses. The utm_source parameter explicitly defines the traffic origin, such as utm_source=gemini, which removes ambiguity inside GA4. Clear source labeling allows marketers to measure how much traffic originates from Google Gemini instead of attributing sessions to generic referral or direct channels.
How do UTM parameters track the effectiveness of campaigns? UTM parameters track campaign effectiveness by assigning campaign identifiers that connect traffic to measurable outcomes. The utm_campaign parameter labels specific initiatives, such as content experiments or AI-focused distribution efforts. When Google Gemini Traffic includes campaign-specific parameters, GA4 connects sessions to conversion events, engagement metrics, and revenue attribution. Campaign tagging enables comparison between AI-driven distribution strategies and other acquisition channels.
What makes precise tracking of sources and channels important? Precise tracking is important because AI-driven traffic behaves differently from traditional organic and paid channels. The utm_medium parameter defines the traffic type, such as ai, referral, or social. Structured medium tagging separates Google Gemini Traffic from paid search, organic search, or social traffic. Granular segmentation enables behavioral comparison across channels and supports AI-specific optimization strategies.
Why are UTM parameters recommended for social media posts and ads? UTM parameters are recommended for social media posts and ads because they prevent incorrect referral classification and preserve attribution clarity. Without UTM parameters, traffic from platforms such as Facebook or X may appear as generic referral sessions. The same misclassification risk applies to Google Gemini Traffic when links are distributed or reshared. Applying UTM parameters ensures that AI-referenced links maintain structured attribution inside analytics systems, which improves reporting accuracy and marketing decision-making.
How should UTM parameters be structured for Google Gemini Traffic? UTM parameters for Google Gemini Traffic should define source, medium, and campaign consistently.
Use the structure listed below.
- utm_source=gemini
- utm_medium=ai
- utm_campaign=ai_visibility_test
Example URL:
https://example.com/page?utm_source=gemini&utm_medium=ai&utm_campaign=ai_visibility_test
Using UTM parameters for Google Gemini Traffic strengthens attribution accuracy, enables campaign-level performance analysis, and reduces the risk of AI-driven sessions being misclassified as direct or generic referral traffic.
4. Create an Exploration Report
Creating an Exploration Report in Google Analytics 4 (GA4) is important because Exploration Reports enable granular segmentation, flexible analysis, custom reporting structures, ad hoc querying, and structured data export for Google Gemini Traffic. An Exploration Report in Google Analytics 4 is an advanced analytical workspace that allows users to build customized reports beyond standard acquisition dashboards. Exploration Reports matter for Google Gemini Traffic because AI-driven sessions require deeper behavioral analysis than default referral views provide.
Why does deeper analysis make Exploration Reports important? Deeper analysis is important because Google Gemini Traffic requires a multi-dimensional breakdown beyond standard Traffic Acquisition tables. Standard reports display sessions, users, and conversions in fixed formats. Exploration Reports allow segmentation by landing page, event count, engagement time, and conversion paths for Google Gemini Traffic. This expanded visibility reveals how AI-referred users behave differently from organic, paid, or direct visitors.
Why is report customization a key factor? Report customization is important because Google Gemini Traffic requires focused filtering and structured comparison against other channels. Exploration Reports allow each analysis component to operate in separate tabs. Users delete, duplicate, or modify tabs to test hypotheses about Google Gemini Traffic performance. Customized filters isolate the Artificial Intelligence channel group or session source matching gemini.google.com. This control enables tailored insights aligned with AI-driven traffic analysis.
What makes tab management significant? Tab management improves analytical clarity by organizing AI-specific experiments inside structured report layers. Each tab in an Exploration Report can be renamed and configured independently. For example, one tab analyzes engagement metrics, while another analyzes conversion rate or landing page performance for Google Gemini Traffic. Organized tabs reduce reporting confusion and improve interpretability when evaluating AI-driven sessions.
Why are ad hoc queries important for Google Gemini Traffic analysis? Ad hoc queries are important because AI-driven traffic patterns change rapidly and require flexible investigation. Exploration Reports support dynamic filtering, segmentation, and drill-down analysis without rebuilding reports from scratch. Users sort dimensions, adjust metrics, compare cohorts, and pivot views instantly. This flexibility allows analysts to react quickly to spikes or declines in Google Gemini Traffic performance.
How does data export enhance the Exploration Report value? Data export enhances value because Google Gemini Traffic insights often require cross-platform reporting and stakeholder sharing. Exploration Reports allow export in formats such as Google Sheets, CSV, TSV, and PDF. Exported data supports dashboard integration, executive reporting, and further statistical analysis outside GA4. Structured export preserves AI channel segmentation and supports long-term performance tracking.
How should an Exploration Report be created to track Google Gemini Traffic? An Exploration Report should be created by isolating Google Gemini Traffic using a filtered AI channel group and configuring relevant engagement and conversion metrics.
Follow the steps listed below.
- Open the Traffic Acquisition report.
- Click Open this report as an exploration in the top-right corner.
- Apply a filter where the Session custom channel group equals Artificial Intelligence or Session source matches the regex gemini.google.com.
- Add metrics such as Engaged sessions, Average engagement time, Conversions, and Landing page views.
- Create separate tabs for engagement analysis, conversion analysis, and landing page performance.
- Export the report for documentation or external analysis if needed.
Creating an Exploration Report strengthens Google Gemini Traffic analysis by enabling structured segmentation, flexible experimentation, and advanced behavioral insight beyond default acquisition reporting.
5. Monitor Gemini Code Assist Usage
Monitoring Gemini Code Assist usage is important because Gemini Code Assist metrics reveal developer adoption levels, measure trust in AI-generated outputs, and connect AI-assisted productivity to downstream digital performance signals. Gemini Code Assist is an AI-powered development assistant integrated into coding environments that generates suggestions, explanations, and code completions using Google Gemini models. Monitoring Gemini Code Assist usage matters because internal AI adoption influences content production velocity, product iteration speed, and technical SEO implementation efficiency, which indirectly affect Google Gemini Traffic growth and AI-driven discoverability.
Why is monitoring developer adoption significant? Monitoring developer adoption is significant because usage metrics indicate whether AI assistance is integrated into operational workflows. The metrics code_assist/daily_active_users and code_assist/twenty_eight_day_active_users track how many developers receive AI-generated responses within defined time windows. Increasing daily and 28-day active usage signals successful integration of Gemini Code Assist into development processes. Higher adoption correlates with faster deployment cycles, improved feature releases, and accelerated technical content updates, which strengthen AI citation eligibility and influence Google Gemini Traffic patterns.
How does assessing trust contribute to tracking effectiveness? Assessing trust is important because acceptance behavior determines whether AI-generated outputs are considered reliable. Metrics such as code_suggestions_accepted_count, acceptance rate, and lines of code accepted measure developer confidence in AI suggestions. Acceptance rate equals the number of accepted code suggestions divided by the total suggestions generated. Higher acceptance rates indicate stronger trust in AI-generated output. Trust in AI assistance accelerates development tasks such as schema implementation, landing page updates, and structured data deployment, which directly support generative visibility and Google Gemini Traffic growth.
What makes identifying acceleration opportunities important? Identifying acceleration opportunities is important because AI-assisted productivity improvements translate into measurable business impact. Monitoring productivity indicators such as DORA metrics (Deployment Frequency, Lead Time for Changes, Change Failure Rate, Time to Restore Service), story points completed, and ticket closures reveals whether Gemini Code Assist reduces development cycle time. Faster deployment of technical SEO enhancements, structured content updates, and performance improvements increases site readiness for AI retrieval. Connecting development velocity improvements to revenue growth, reduced time to market, and improved engagement metrics demonstrates how Gemini Code Assist usage supports broader AI visibility strategies.
How should Gemini Code Assist usage be monitored systematically? Gemini Code Assist usage should be monitored through structured metric tracking and performance correlation analysis.
Follow the steps listed below.
- Track code_assist/daily_active_users and code_assist/twenty_eight_day_active_users to measure adoption trends.
- Monitor acceptance rate and lines of code accepted to evaluate trust and output reliability.
- Compare AI adoption metrics with DORA indicators and development velocity metrics.
- Correlate productivity improvements with technical deployment frequency and structured data updates.
- Measure downstream impact by analyzing changes in AI visibility, citation frequency, and Google Gemini Traffic growth after deployment cycles.
Monitoring Gemini Code Assist usage strengthens AI-driven optimization strategies by aligning internal AI adoption with measurable improvements in technical execution, content readiness, and generative search performance.
What are the Data Sources for Tracking Google Gemini Traffic?
The data sources for tracking Google Gemini Traffic are Google Analytics 4 Referral Data, Server Log Analysis, Looker Studio dashboards, and Specialized AI SEO & Visibility Trackers. Google Gemini Traffic refers to sessions and visibility generated from Gemini-powered AI interactions, including AI Overviews and conversational responses. These 4 data sources provide layered attribution, validation, visualization, and citation-level measurement.
The 4 primary data sources for tracking Google Gemini Traffic are listed below.
1. Google Analytics 4 Referral Data
Google Analytics 4 (GA4) Referral Data can be used to track AI Traffic by isolating AI platform domains within the Session source dimension and categorizing them into a dedicated Artificial Intelligence channel group. Google Analytics 4 Referral Data refers to session-level acquisition data that records the originating domain of inbound traffic. AI Traffic refers to sessions generated from AI assistants such as ChatGPT, Google Gemini, Perplexity, Claude, Copilot, and other generative platforms. GA4 classifies these visits as referral traffic by default, which requires structured configuration to prevent misattribution.
AI platform visitors are frequently grouped under generic referral categories in GA4. This grouping obscures platform-level attribution and reduces clarity when analyzing AI-driven performance. Structured channel configuration improves segmentation precision and enables scalable AI traffic tracking.
How can custom channel groups be used to track AI traffic? Custom Channel Groups in GA4 can be used to define and isolate AI Traffic using domain-based rules. A Custom Channel Group is a configurable classification layer that groups sessions based on defined conditions.
Follow the steps below.
- Navigate to Admin → Data Display → Channel Groups.
- Click Create new channel group.
- Name the channel group Artificial Intelligence.
- Set the rule condition to Source matches regex.
- Apply the AI domain regular expression.
- Place the Artificial Intelligence channel above the default Referral channel.
Placing the Artificial Intelligence channel above Referral ensures proper attribution hierarchy.
What regular expression should be used to identify AI traffic sources? The following regular expression should be used to identify AI Traffic domains inside GA4.
chatgpt\.com|chat\.openai\.com|gemini\.google\.com|deepseek\.com|perplexity(?:\.ai)?|claude\.ai|copilot\.microsoft\.com|deepl\.com|character\.ai|(?:\w+\.)?meta\.ai|grok\.x\.com|grok\.com|x\.ai|bard\.google\.com|(?:\w+\.)?mistral\.ai|writesonic\.com|quillbot\.com|chat\.suno\.com|turing\.microsoft\.com|cosmos\.microsoft\.com|orca\.microsoft\.com|phi\.microsoft\.com|megatron\.microsoft\.com|jarvis\.microsoft\.com|maia\.microsoft\.com|aitastic\.app|bnngpt\.com|chat-gpt\.org|(?:\w+\.)?edgepilot|firefly\.adobe\.com|edgeservices|iask\.ai|(?:\w+\.)?neeva|nimble\.ai|open-assistant\.io|(?:\w+\.)?copy\.ai|openchat\.so|blackbox\.ai|ex\.ai|cohere\.ai|anthropic\.com|(?:\w+\.)?palm-ai\.google\.com|chatglm\.cn|gemini-api\.google\.com|palm\.google\.com|deeplearning\.google\.com|vertexai\.google\.com|ai\.google\.com|deepmind\.google\.com|ml\.googleapis\.com|tensor\.google\.com|t5\.google\.com|my-ai\.snapchat\.com|ai\.baidu\.com|xiaoice\.com|anthropic-api\.com|huggingchat\.com|deepmind\.com|alphacode\.google\.com|copilot\.azure\.com|felo\.ai|chat\.qwen\.ai|(?:\w+\.)?qwenlm\.ai|(?:\w+\.)?outlier\.ai|chat\.hotmart\.ai|customgpt\.ai|venice\.ai|bot\.ivy\.ai|chat\.chatbotapp\.ai|lmarena\.ai|wrtn\.ai|chat\.chaton\.ai|app\.chatboxapp\.ai|duck\.ai|sider\.ai|webpilot\.ai|ai21\.com|pi\.ai|zhipu\.ai|huggingface\.co|wordtune\.com|reka\.ai|syntesia\.io|jasper\.ai|uminal\.org|ai-coustics\.com|magical\.team|vicuna\.ai|floydhub\.com|forefront\.ai|komo\.ai|wav\.ai|d-id\.com|sap\.ai|useblackbox\.io|you\.com|chinchilla\.ai|openrouter\.ai|waldo|coze\.com|exa\.ai|spellbook\.rossintelligence\.com|yiyan\.baidu\.com|lighton\.ai|baichuan-ai\.com|hyperwriteai\.com|phind\.com|app\.loora\.ai
This expression captures a wide range of AI assistant domains.
How can AI traffic data be viewed in standard GA4 reports? AI Traffic can be viewed by selecting the “Session custom channel group” dimension in Traffic Acquisition reports.
Follow the steps listed below.
- Navigate to Reports → Acquisition → Traffic Acquisition.
- Open the dimension dropdown.
- Select the Session custom channel group.
This view segments sessions classified under Artificial Intelligence.
How can a customized report be created to analyze AI traffic? A customized report isolates AI Traffic by filtering the Artificial Intelligence channel group.
- Open Traffic Acquisition.
- Click Customize report.
- Add a filter where the Session custom channel group exactly matches Artificial Intelligence.
- Set the Session source as the default dimension.
- Save the report as AI Traffic and add it to a collection.
This configuration produces a reusable AI-specific dashboard.
How can Explorations be used for detailed AI traffic analysis? Explorations allow advanced segmentation, cohort analysis, and behavioral breakdown for AI Traffic.
- Open the AI Traffic report.
- Click Open this report as an Exploration.
Add dimensions such as Landing Page, Device Category, and Event Name. - Add metrics such as Engaged Sessions, Conversion Rate, and Average Engagement Time.
Exploration mode supports multi-tab experimentation and comparative analysis.
What is a quick solution for filtering AI traffic in reports? A quick solution is to apply a regex filter directly inside the Traffic Acquisition report.
Add a filter where:
- Session source matches regex
- Use a shortened expression such as:
chatgpt\.com|chat\.openai\.com|gemini\.google\.com|deepseek\.com|perplexity(?:\.ai)?|claude\.ai|copilot\.microsoft\.com|deepl\.com|character\.ai|(?:\w+\.)?meta\.ai|grok\.x\.com|grok\.com|x\.ai|bard\.google\.com|(?:\w+\.)?mistral\.ai|writesonic\.com
This method isolates AI Traffic without creating a new channel group.
What are the important considerations when tracking AI traffic? Important considerations include attribution hierarchy, channel group limits, and exposure gaps.
- Custom Channel Groups provide more scalability than report filters.
- Channel order determines correct attribution priority.
- GA4 limits the number of custom channel groups to 2 active versions.
- Not all AI exposure produces trackable referral traffic.
- Report filters reset when leaving the report
Using Google Analytics 4 Referral Data with structured channel configuration ensures accurate AI Traffic attribution, clearer performance measurement, and reliable segmentation across generative assistant platforms.
2. Server Log Analysis
Google Server Log Analysis can be used to track AI Traffic by examining raw server request records to identify AI-related referrers, user agents, and access patterns that Google Analytics 4 (GA4) may misclassify. Server Log Analysis refers to the process of reviewing web server log files that record every request made to a website, including IP address, timestamp, requested URL, referrer, and user-agent string. AI Traffic refers to sessions originating from AI assistants such as ChatGPT, Google Gemini, Perplexity, Claude, and Copilot.
Server Log Analysis matters because GA4 often categorizes AI Traffic as generic referral or direct traffic. This misclassification obscures the real impact of AI-driven interactions on engagement and conversion metrics. Server logs provide unfiltered, request-level visibility that analytics platforms aggregate or normalize.
What challenges exist when tracking AI traffic in GA4? The primary challenge is that GA4 groups AI-originated sessions under referral traffic or direct traffic without granular AI source labeling. AI assistants frequently open links in embedded browsers or through copied URLs, which removes referrer data. This behavior inflates direct traffic and prevents accurate source attribution. Standard GA4 reports cannot reliably distinguish AI-generated visits from traditional referral sessions without structured configuration.
How does Server Log Analysis improve AI Traffic identification? Server Log Analysis improves AI Traffic identification by examining raw referrer headers and user-agent strings directly from server requests.
Server logs allow analysts the list below.
- Inspect HTTP referrer fields for AI platform domains.
- Detect AI-related user-agent signatures.
- Identify patterns of traffic spikes aligned with AI mentions.
- Compare raw request counts against GA4-reported sessions.
Because server logs capture every request before GA4 processing, they reveal discrepancies between actual AI-originated hits and analytics-classified sessions.
How should AI traffic sources be identified inside GA4 after log validation? AI traffic sources should be consolidated using a Custom Channel Group in GA4 that matches AI platform domains via regex.
Follow the steps listed below.
- Navigate to Admin → Data Display → Channel Groups.
- Create a new channel group named Artificial Intelligence.
- Set the rule condition to Source matches regex.
- Apply the comprehensive AI domain expression.
- Move the Artificial Intelligence channel above Referral.
The regex used to capture AI sources includes domains such as:
chatgpt\.com|chat\.openai\.com|gemini\.google\.com|deepseek\.com|perplexity(?:\.ai)?|claude\.ai|copilot\.microsoft\.com|deepl\.com|character\.ai|(?:\w+\.)?meta\.ai|grok\.x\.com|grok\.com|x\.ai|bard\.google\.com|(?:\w+\.)?mistral\.ai|writesonic\.com|quillbot\.com|chat\.suno\.com|turing\.microsoft\.com|cosmos\.microsoft\.com|orca\.microsoft\.com|phi\.microsoft\.com|megatron\.microsoft\.com|jarvis\.microsoft\.com|maia\.microsoft\.com|aitastic\.app|bnngpt\.com|chat-gpt\.org|(?:\w+\.)?edgepilot|firefly\.adobe\.com|edgeservices|iask\.ai|(?:\w+\.)?neeva|nimble\.ai|open-assistant\.io|(?:\w+\.)?copy\.ai|openchat\.so|blackbox\.ai|ex\.ai|cohere\.ai|anthropic\.com|(?:\w+\.)?palm-ai\.google\.com|chatglm\.cn|gemini-api\.google\.com|palm\.google\.com|deeplearning\.google\.com|vertexai\.google\.com|ai\.google\.com|deepmind\.google\.com|ml\.googleapis\.com|tensor\.google\.com|t5\.google\.com|my-ai\.snapchat\.com|ai\.baidu\.com|xiaoice\.com|anthropic-api\.com|huggingchat\.com|deepmind\.com|alphacode\.google\.com|copilot\.azure\.com|felo\.ai|chat\.qwen\.ai|(?:\w+\.)?qwenlm\.ai|(?:\w+\.)?outlier\.ai|chat\.hotmart\.ai|customgpt\.ai|venice\.ai|bot\.ivy\.ai|chat\.chatbotapp\.ai|lmarena\.ai|wrtn\.ai|chat\.chaton\.ai|app\.chatboxapp\.ai|duck\.ai|sider\.ai|webpilot\.ai|ai21\.com|pi\.ai|zhipu\.ai|huggingface\.co|wordtune\.com|reka\.ai|syntesia\.io|jasper\.ai|uminal\.org|ai-coustics\.com|magical\.team|vicuna\.ai|floydhub\.com|forefront\.ai|komo\.ai|wav\.ai|d-id\.com|sap\.ai|useblackbox\.io|you\.com|chinchilla\.ai|openrouter\.ai|waldo|coze\.com|exa\.ai|spellbook\.rossintelligence\.com|yiyan\.baidu\.com|lighton\.ai|baichuan-ai\.com|hyperwriteai\.com|phind\.com|app\.loora\.ai
How can AI Traffic be viewed in standard GA4 reports after configuration?
AI Traffic can be viewed by selecting “Session custom channel group” in the Traffic Acquisition report.
- Navigate to Reports → Acquisition → Traffic Acquisition.
- Change the primary dimension to the Session custom channel group.
- Select the Artificial Intelligence channel.
How can a customized report focus specifically on AI Traffic? A customized report isolates AI Traffic by filtering for the Artificial Intelligence channel group.
- Open Traffic Acquisition.
- Click Customize report.
- Add a filter where the Session custom channel group exactly matches Artificial Intelligence.
- Set the Session source as the primary dimension.
- Save the report as AI Traffic.
How can Explorations enhance AI Traffic analysis? Explorations allow deeper segmentation of AI Traffic by landing page, engagement metrics, and conversion events.
- Open the customized AI report.
- Click Open as Exploration.
- Add metrics such as Engaged Sessions, Conversion Rate, and Average Engagement Time.
- Segment by AI platform source to compare Gemini, ChatGPT, and Perplexity traffic.
What is a quick filtering method inside standard reports? A quick method is to apply a Session source regex filter directly inside Traffic Acquisition.
Add a filter below.
- Session source matches regex:
chatgpt\.com|chat\.openai\.com|gemini\.google\.com|deepseek\.com|perplexity(?:\.ai)?|claude\.ai|copilot\.microsoft\.com|deepl\.com|character\.ai|(?:\w+\.)?meta\.ai|grok\.x\.com|grok\.com|x\.ai|bard\.google\.com|(?:\w+\.)?mistral\.ai|writesonic\.com
This filter resets upon page refresh, which makes Custom Channel Groups more scalable.
Server Log Analysis complements GA4 configuration by validating raw AI-originated requests before analytics classification, which ensures more accurate AI Traffic measurement across generative platforms.
3. Looker Studio
Looker Studio can be used to track AI Traffic by connecting a Google Analytics 4 (GA4) property and creating filtered dashboards that isolate AI-generated sessions for structured visualization and comparison. Looker Studio is a data visualization platform that transforms GA4 acquisition data into customizable dashboards. AI Traffic refers to sessions originating from AI assistants such as Google Gemini, ChatGPT, Perplexity, and Copilot. Looker Studio enables structured segmentation, comparative analysis, and stakeholder-ready reporting for AI-driven traffic patterns.
Looker Studio tracks AI Traffic by importing GA4 data and applying AI-specific filters based on source, medium, or custom channel group.
Follow the steps below.
- Open Looker Studio.
- Click Create → Report.
- Add a Google Analytics 4 data source.
- Select the GA4 property that includes the Artificial Intelligence custom channel group.
- Confirm the connection and add the data source to the report.
After connection, AI Traffic can be filtered using dimensions such as Session source or Session custom channel group.
What are the key visualizations for AI Traffic analysis in Looker Studio? The key visualizations for AI Traffic analysis are time-series charts, landing page tables, AI referrer breakdowns, conversion contribution charts, and comparative performance charts.
The recommended visualizations are listed below.
- Time-Series Chart: Displays AI session trends over time to identify growth patterns and spikes.
- Landing Page Table: Shows top-performing landing pages receiving AI Traffic.
- Traffic by LLM Referrer Chart: Breaks down sessions by AI platform domain, such as gemini.google.com or chat.openai.com.
- Conversion Contribution Chart: Measures how AI Traffic contributes to goal completions and revenue.
- AI vs Organic Comparison Chart: Compares engagement metrics between AI Traffic and organic search sessions.
These visualizations clarify behavioral differences between AI-driven users and traditional acquisition channels.
How can an AI Traffic filter be created in Looker Studio? An AI Traffic filter can be created by applying a source-based or channel-based condition inside each visualization.
Follow the steps below.
- Select a visualization element (scorecard, chart, or table).
- Navigate to the SET-UP panel.
- Scroll to the Filter section.
- Click Add a Filter → Create a Filter.
- Define the condition:
- Include → Session source → Matches regex →
chatgpt\.com|chat\.openai\.com|gemini\.google\.com|perplexity\.ai|claude\.ai|copilot\.microsoft\.com
- Include → Session source → Matches regex →
Alternatively, filter by:
- Session custom channel group = Artificial Intelligence
This configuration isolates AI Traffic within dashboards.
What are the benefits of using Looker Studio for AI Traffic analysis? Looker Studio improves AI Traffic analysis through visual clarity, cross-channel comparison, and shareable reporting structures.
The benefits are listed below.
- Centralized Visualization: Consolidates AI Traffic metrics into a unified dashboard.
- Segment Comparison: Compares AI Traffic against organic, paid, and referral channels.
- Stakeholder Sharing: Enables report sharing with clients, executives, and internal teams.
Custom Metrics: Supports calculated fields such as AI Conversion Rate or AI Engagement Ratio. - Export Capability: Allows export to PDF or scheduled email reports.
Looker Studio strengthens AI Traffic reporting by transforming GA4 segmentation into structured, stakeholder-ready dashboards that clarify how Google Gemini and other AI assistants influence acquisition and conversion performance.
4. Specialized AI SEO & Visibility Trackers
Specialized AI SEO & Visibility Trackers are used to track AI Traffic by monitoring citation frequency, AI Overview visibility, semantic ranking shifts, and competitive presence inside AI-generated answers. Specialized AI SEO & Visibility Trackers refer to platforms that analyze how brands appear inside AI Overviews, conversational search, and generative engine outputs rather than only measuring traditional rankings. AI Traffic refers to sessions and brand exposure generated through AI-powered search environments such as Google AI Overviews and Gemini.
Google Search Console (GSC) and Google Analytics 4 (GA4) do not provide a dedicated AI Overview traffic report. AI Overview sessions are typically grouped under “google / organic,” which requires indirect detection methods.
How can Google Search Console (GSC) be used to track AI Overview impact? Google Search Console can be used to track AI Overview impact through behavioral signal analysis rather than direct labeling.
Monitor the signals below.
- Impression spikes without CTR growth: A sudden increase in impressions with flat or declining click-through rate (CTR) suggests that content is surfaced in AI Overviews, but users are not clicking traditional links.
- Low CTR informational queries: Question-based queries with deep impressions and low CTR often indicate AI summarization above organic listings.
- Stable rankings with click decline: If average position remains stable but clicks drop, AI Overviews may be fulfilling intent before users visit the site.
These signals help estimate AI Overview exposure indirectly.
How do third-party SEO tools contribute to AI Overview tracking? Third-party SEO tools help monitor SERP volatility and ranking displacement linked to AI integration.
Tools such as SEMrush, Ahrefs, Sistrix, and Similarweb do not directly label AI Overview traffic, but they reveal:
- Keyword ranking volatility.
- Position drops linked to AI panel insertion.
- Traffic decline despite stable keyword positioning.
Keyword drop alerts combined with stable rankings suggest AI-driven displacement.
How does Google FastSearch relate to AI Overview visibility? FastSearch is Google’s internal retrieval system that powers AI Overviews by prioritizing semantic relevance over traditional backlink-based authority. FastSearch retrieves fewer but semantically precise documents to ground Gemini-generated answers. This retrieval method emphasizes contextual clarity rather than link popularity.
What are RankEmbed signals? RankEmbed signals are semantic ranking factors trained on approximately 70 days of search logs, human quality ratings, and click-query data. RankEmbed prioritizes natural language understanding and query–content relationship depth rather than surface-level keyword alignment. RankEmbed strengthens content that demonstrates entity clarity and topical completeness.
What are the strategic implications for content strategy? Content strategy must prioritize semantic clarity, entity consistency, and extractable structure to align with AI Overview retrieval models.
Effective strategy parameters are listed below.
- Conducting a semantic audit.
- Tracking AI performance separately from organic performance.
- Experimenting with structural formats such as definitions and Q&A blocks.
- Maintaining traditional SEO best practices alongside AI optimization.
What are the limitations of third-party access to FastSearch? FastSearch operates inside Google Cloud Vertex AI infrastructure and is not directly testable by external SEO professionals. Visibility is limited to observing AI Overview outputs rather than accessing internal retrieval signals.
What is the recommended action plan for implementing semantic AI tracking? The recommended action plan includes auditing semantic coverage, segmenting AI performance, monitoring SERP volatility, and maintaining technical excellence.
Follow the steps listed below.

- Conduct a semantic content audit focused on entity relationships.
- Create AI-specific tracking dashboards.
- Monitor ranking volatility alongside click trends.
- Separate AI citation monitoring from organic ranking reports.
- Maintain structured data, clear definitions, and topical completeness.
Specialized AI SEO & Visibility Trackers extend beyond traditional ranking analysis by focusing on citation presence, semantic retrieval behavior, and AI-driven brand exposure patterns inside generative search environments.
What are the Key Metrics to Monitor Google Gemini Traffic?
The key metrics to monitor Google Gemini Traffic are General Active User and Volume Metrics, Interaction and Engagement Metrics, Visibility and Brand Tracking Metrics (AI SEO), Technical and Performance Metrics (Gemini Code Assist), and Traffic Source Attribution Metrics in Google Analytics 4. Google Gemini Traffic refers to sessions and brand visibility generated from Gemini-powered AI Overviews and conversational responses. Monitoring these 5 metric categories ensures that AI-driven discovery translates into measurable adoption, engagement quality, AI citation presence, operational readiness, and accurate attribution.
The 5 key metric categories for Google Gemini Traffic are listed below.
- General Active User and Volume Metrics
- Interaction and Engagement Metrics
- Visibility and Brand Tracking Metrics (AI SEO)
- Technical and Performance Metrics (Gemini Code Assist)
- Traffic Source Attribution Metrics in Google Analytics 4
1. General Active User and Volume Metrics
General Active User and Volume Metrics are quantitative indicators that measure total user adoption, usage frequency, and funnel progression across defined stages of engagement. General Active User and Volume Metrics define how many users access a system, how frequently users engage, and how effectively users move from awareness to conversion. These metrics matter because Google Gemini Traffic growth must be evaluated not only by referral volume but by sustained adoption and progression across the acquisition funnel.
What are the key metrics for measuring active users and volume? The key metrics for measuring active users and volume are License Utilization, Weekly Active Users (WAU), and Funnel-Based Volume Metrics (Top-of-Funnel, Middle-of-Funnel, Bottom-of-Funnel).
The primary metrics are listed below.
- License Utilization
- Weekly Active Users (WAU)
- Top-of-Funnel (ToFu) Volume Metrics
- Middle-of-Funnel (MoFu) Volume Metrics
- Bottom-of-Funnel (BoFu) Volume Metrics
What is License Utilization? License Utilization is the percentage of assigned licenses actively used within a defined time period. License Utilization is calculated as:
(Active Users ÷ Total Assigned Licenses) × 100
License Utilization matters because adoption thresholds trigger operational playbooks.
- License Utilization below 50% within the first 30 days activates the Onboarding Risk from Early Usage Decline playbook.
- License Utilization below 60% of total potential users activates the Expansion Signal from the High Adoption and Low Seat Penetration playbook.
Metric-Specific Instruction: Monitor License Utilization weekly during onboarding and monthly after stabilization. Set automated alerts for thresholds below 50% (30-day onboarding window) and below 60% for expansion evaluation.
What is Weekly Active Users (WAU)? Weekly Active Users (WAU) measures the number of distinct users who engage with the system within 7 days. WAU indicates usage consistency and engagement retention.
A decline in WAU for 2 consecutive weeks during onboarding activates the Onboarding Risk playbook.
Metric-Specific Instruction: Track WAU using a rolling 7-day window. Compare WAU trend lines against onboarding cohorts and identify engagement drop-offs within the first 14 days.
What are Top-of-Funnel (ToFu) Volume Metrics? Top-of-Funnel Volume Metrics measure initial awareness and acquisition activity.
Top-of-Funnel metrics are listed below
- Website Traffic
- Social Media Impressions
- Content Downloads
These metrics quantify exposure and interest generation.
Metric-Specific Instruction: Monitor ToFu metrics weekly and correlate increases in Google Gemini Traffic with branded search growth and AI citation visibility.
What are Middle-of-Funnel (MoFu) Volume Metrics? Middle-of-Funnel Volume Metrics measure lead qualification and engagement depth.
Middle-of-Funnel metrics are listed below.
- Lead Conversion Rate
- Email Open Rate
- Email Click-Through Rate (CTR)
- Marketing Qualified Leads (MQLs)
These metrics evaluate whether awareness converts into qualified engagement.
Metric-Specific Instruction: Segment MoFu metrics by traffic source. Compare AI Traffic conversion efficiency against organic and paid channels to identify AI-driven lead quality.
What are Bottom-of-Funnel (BoFu) Volume Metrics? Bottom-of-Funnel Volume Metrics measure revenue-driving user actions and sales outcomes.
Bottom-of-Funnel metrics are listed below.
- Sales Qualified Leads (SQLs)
- Deal Closure Rate
- Revenue per User
These metrics directly measure monetization effectiveness.
Metric-Specific Instruction: Track BoFu metrics monthly and calculate Conversion Rate from AI Traffic by dividing AI-driven SQLs by total AI sessions.
General Active User and Volume Metrics define adoption health, engagement stability, and revenue progression across the entire funnel. Monitoring License Utilization, WAU, and Funnel Metrics ensures that Google Gemini Traffic growth translates into measurable business impact rather than isolated referral volume.
2. Interaction and Engagement Metrics
Interaction and Engagement Metrics are quantitative indicators that measure how deeply users interact with content after arriving from Google Gemini Traffic. Interaction and Engagement Metrics define behavioral intensity, content relevance, and conversion readiness by evaluating time, actions, and participation levels rather than traffic volume alone. Interaction and Engagement Metrics matter because Google Gemini Traffic often reflects high-intent discovery, which requires behavioral validation beyond session counts.
What are the core metrics defining Interaction and Engagement Metrics? The core Interaction and Engagement Metrics are Engagement Rate, Total Visits, Unique Visitors, Bounce Rate, Average Session Duration, Click-Through Rate (CTR), and Conversion Rate.
The primary metrics are listed below.
- Engagement Rate (%)
- Total Visits
- Unique Visitors
- Bounce Rate
- Average Session Duration
- Click-Through Rate (CTR)
- Conversion Rate
What is Engagement Rate? Engagement Rate is the percentage of total interactions relative to total reach. Engagement Rate is calculated as:
Engagement Rate (%) = (Total Interactions ÷ Reach) × 100
Total Interactions include clicks, shares, comments, video views, and conversions. Reach represents the total exposed users. A reasonable Engagement Rate typically ranges from 1% to 5%, depending on the platform and industry.
Metric-Specific Instruction: Calculate Engagement Rate separately for Gemini Traffic and compare it to organic and paid traffic. Identify whether AI-driven users exceed baseline engagement thresholds.
What is Total Visits? Total Visits represent the total number of sessions recorded during a defined period. Total Visits measure frequency and traffic intensity.
Metric-Specific Instruction: Track Total Visits from Gemini Traffic weekly. Compare month-over-month growth to identify sustained AI-driven adoption.
What are Unique Visitors? Unique Visitors represent the number of distinct users who visit the website during a defined period. Unique Visitors measure audience reach rather than repeat frequency.
Metric-Specific Instruction: Compare Unique Visitors from Gemini Traffic to Total Visits to evaluate repeat usage behavior.
What is Bounce Rate? Bounce Rate is the percentage of single-page sessions with no further interaction. Bounce Rate in Google Analytics is calculated as:
Bounce Rate = (Single-Page Sessions ÷ Total Sessions) × 100
A high Bounce Rate may indicate a mismatch between AI summary expectations and landing page depth.
Metric-Specific Instruction: Monitor Bounce Rate for Gemini Traffic. Identify pages with Bounce Rate above baseline thresholds and optimize for deeper content alignment.
What is Average Session Duration? Average Session Duration measures the average active time users spend during a session. In GA4 and SimilarWeb, a session lasts for 30 minutes of inactivity.
Metric-Specific Instruction: Segment Average Session Duration by traffic source. Compare Gemini Traffic duration against organic search to determine engagement quality.
3. Visibility and Brand Tracking Metrics (AI SEO)
Visibility and Brand Tracking Metrics (AI SEO) are quantitative indicators that measure how often and how prominently a brand appears inside AI-generated answers. Visibility and Brand Tracking Metrics define AI presence, comparative prominence, sentiment positioning, and performance impact across generative search platforms.
What are the key metrics defining AI search visibility? The key AI SEO visibility metrics are Brand Presence Rate, AI Share of Voice (SOV), Brand Sentiment Score, and AI Referral Performance.
The core metrics are listed below.
- Brand Presence Rate
- AI Share of Voice (SOV)
- Brand Sentiment Score
- AI Referral Performance Metrics
What is Brand Presence Rate? Brand Presence Rate measures the percentage of AI-generated answers that include a brand mention. AI citations are binary: a brand is either present or absent.
Metric-Specific Instruction: Calculate Brand Presence Rate by dividing AI answers containing the brand by total AI answers analyzed. Track weekly to detect citation fluctuations.
What is AI Share of Voice (SOV)? AI Share of Voice (SOV) measures brand prominence relative to competitors in AI-generated responses. AI Share of Voice is calculated as:
AI SOV (%) = (Brand Mentions ÷ Total Mentions Across All Competitors) × 100
Metric-Specific Instruction: Benchmark AI SOV monthly across defined intent clusters. Identify competitive displacement trends.
What is Brand Sentiment Score? Brand Sentiment Score measures how AI systems describe a brand as positive, neutral, or negative. Sentiment reflects perception and trust inside generated answers.
Metric-Specific Instruction: Classify AI responses into sentiment categories. Monitor negative sentiment spikes and adjust entity framing.
What are AI Referral Performance Metrics? AI Referral Performance Metrics measure traffic, engagement, and conversions originating from AI-generated citations. These metrics connect visibility with measurable business impact.
Metric-Specific Instruction: Filter GA4 data for AI referrals or UTM-tagged AI campaigns. Compare conversion rates from Gemini Traffic against baseline traffic sources.
4. Technical and Performance Metrics (Gemini Code Assist)
Technical and Performance Metrics (Gemini Code Assist) are quantitative indicators that measure developer adoption, AI suggestion reliability, workflow efficiency, and delivery acceleration enabled by Gemini Code Assist. Gemini Code Assist is an AI-assisted development tool that generates code suggestions, explanations, and completions inside integrated development environments (IDEs). Technical and Performance Metrics matter because Gemini Code Assist usage influences deployment speed, structured data implementation, and content update velocity, which indirectly affect Google Gemini Traffic growth and AI visibility readiness.
What are the key technical and performance metrics used to evaluate Gemini Code Assist? The key Technical and Performance Metrics are Daily Active Usage, Code Suggestion Volume, Chat Exposure Volume, Code Suggestions Accepted, Acceptance Rate, Lines of Code Accepted, Discrete Activity, DORA Measures, Story Points, and Ticket Closures.
The primary metrics are listed below.
- Daily Active Usage (DAU): Measures the number of developers actively using Gemini Code Assist per day.
- Code Suggestion Volume: Measures the total number of AI-generated code recommendations.
- Chat Exposure Volume: Measures the number of AI-assisted chat interactions inside development tools.
- Code Suggestions Accepted: Measures how many AI-generated suggestions are integrated into production code.
- Acceptance Rate: Calculates the percentage of accepted suggestions relative to total suggestions generated.
- Lines of Code Accepted: Measures total AI-generated code integrated into repositories.
- Discrete Activity: Tracks AI interaction by user, programming language, IDE client, and time window.
- DORA Measures: Tracks Deployment Frequency, Lead Time for Changes, Change Failure Rate, and Time to Restore Service.
- Story Points Completed: Measures development workload throughput.
- Ticket Closures: Measures completed development tasks within defined sprints.
What metrics measure AI code suggestion usage specifically? Code Suggestion Volume, Code Suggestions Accepted, Acceptance Rate, and Lines of Code Accepted define AI code usage intensity.
Acceptance Rate is calculated as:
Acceptance Rate (%) = (Code Suggestions Accepted ÷ Code Suggestion Volume) × 100
Metric-Specific Instruction: Track Acceptance Rate weekly. Identify thresholds below 40% as potential reliability concerns and above 60% as strong AI integration signals.
How is developer activity measured at a granular level? Developer Activity is measured through Discrete Activity tracking across user, language, IDE client, and session duration dimensions. Discrete Activity provides multi-dimensional insight into AI tool engagement patterns.
Metric-Specific Instruction: Segment Discrete Activity by programming language and IDE. Identify environments with low adoption and implement targeted enablement training.
How is the development workflow impact measured? Workflow impact is measured through DORA Measures, Story Points Completed, and Ticket Closures.
Metric-Specific Instruction: Compare DORA metrics before and after Gemini Code Assist implementation. Measure Deployment Frequency increases and Lead Time reductions to quantify acceleration.
5. Traffic Source Attribution Metrics in Google Analytics 4
Traffic Source Attribution Metrics in Google Analytics 4 (GA4) are structured dimensions that identify where users originate, how they arrive, and which campaigns drive sessions across User, Session, and Event scopes. Traffic Source Attribution Metrics matter because Google Gemini Traffic must be separated from organic, referral, and paid channels to ensure accurate AI-driven performance measurement.
What are the primary Traffic Source Attribution dimensions in GA4? The primary Traffic Source Attribution dimensions are Source, Medium, Campaign ID, and Campaign Name across User, Session, and Event scopes.
The core dimensions are listed below.
- Source: Identifies the referring domain or platform.
- Medium: Identifies the acquisition type (e.g., organic, referral, cpc, ai).
- Campaign ID: Identifies structured campaign identifiers.
- Campaign Name: Identifies marketing campaign labels.
What are the scope levels for Traffic Source Attribution Metrics? Traffic Source Attribution Metrics operate at User scope, Session scope, and Event scope.
- User Scope: Tracks firstUserSource, traffic_source.source, traffic_source.medium.
- Session Scope: Tracks sessionSource and session_traffic_source_last_click dimensions.
- Event Scope: Tracks collected_traffic_source fields such as manual_source and manual_medium.
What are the default traffic source and user acquisition dimensions? Default dimensions include traffic_source.name (campaign), traffic_source.medium, and traffic_source.source at User scope. These dimensions define baseline acquisition classification.
What are the key Event-Scoped dimensions? Event-scoped dimensions include collected_traffic_source.manual_campaign_id, manual_campaign_name, manual_source, manual_medium, manual_term, manual_content, gclid, dclid, and srsltid.
Event-scope availability dates:
- Available from May 3, 2023
- Additional dimensions available from July 11, 2024
What are the key Session-Scoped dimensions? Session-scoped dimensions include session_traffic_source_last_click, manual_campaign fields, and Google Ads campaign identifiers.
Session-scope availability date:
- Available from July 17, 2024
What calculated Traffic Source dimensions are available? Calculated dimensions include campaign (session-based), medium (session-based), source (session-based), source/medium (user-based), default channel grouping (user and session-based), and page referrer. These pre-calculated fields simplify analysis.
What date range should be used for accurate attribution queries? Queries should use the _table_suffix between ‘20240701’ and the current date minus one day to ensure data completeness for session-scoped dimensions.
Metric-Specific Instruction: Always segment Google Gemini Traffic using the Session custom channel group or the Session source. Validate that the Artificial Intelligence channel grouping is placed above Referral to prevent misclassification.
What Are the Key Optimization Tips for Better Tracking of Google Gemini Traffic?
The key optimization tips for better tracking Google Gemini Traffic are targeting conversational and long-tail queries, providing direct and concise answers, emphasizing E-E-A-T (Experience, Expertise, Authoritativeness, Trustworthiness), creating topic clusters, prioritizing page load speed, using descriptive headings and lists, ensuring mobile-friendly design, testing with AI on Google Search directly, and checking citations regularly. These optimization tips matter because Google Gemini Traffic depends on citation eligibility, structured extraction, and behavioral validation rather than ranking position alone.
The 9 key optimization tips for better tracking Google Gemini Traffic are listed below.
- Target Conversational and Long-Tail Queries
- Provide Direct and Concise Answers
- Emphasize E-E-A-T
- Create Topic Clusters
- Prioritize Page Load Speed
- Use Descriptive Headings & Lists
- Ensure Mobile-Friendly Design
- Test with AI on Google Search Directly
- Check Citations
Target Conversational & Long-Tail Queries
Targeting Conversational and Long-Tail Queries is important for tracking Google Gemini Traffic because Google Gemini prioritizes natural language prompts, complex intent resolution, and AI Overview synthesis over short keyword matching. Conversational and Long-Tail Queries are multi-word, intent-specific questions that mirror how users interact with generative AI systems. Google Gemini Traffic increases when content aligns with these query patterns because citation probability rises in AI-generated answers.
How do Conversational Queries increase citation probability? Conversational Queries increase citation probability because they match the structure of user prompts inside Google Gemini. Queries such as “How to rank SaaS in Google Gemini AI” (1,200 monthly searches) reflect natural AI interaction patterns. Google Gemini synthesizes answers by retrieving structured explanations that directly resolve such prompts. Broad keyword targeting produces lower alignment because generative systems evaluate semantic completeness instead of keyword density.
Why are specific and complex questions important? Specific and complex questions are important because AI-generated answers require nuanced, structured explanations. Queries such as “Best SaaS lead generation strategies for 2025” (850 searches) and “SaaS Gemini AI optimization strategies” (680 searches) demand in-depth context. Targeting these Long-Tail Queries increases the likelihood that Google Gemini cites the source when constructing comprehensive AI Overviews.
What is the impact of Google Gemini AI Overviews on search behavior? Google Gemini AI Overviews are projected to influence 30% of SaaS-related searches in 2026, which reduces reliance on traditional link-based navigation. As AI Overviews expand, ranking position alone does not guarantee visibility. Optimizing for Conversational and Long-Tail Queries ensures presence inside AI-generated summaries rather than only within standard SERPs.
Provide Direct and Concise Answers
Providing Direct and Concise Answers is important for tracking Google Gemini Traffic because Google Gemini extracts complete answer blocks for AI summaries, and organic click-through rates decline significantly when AI Overviews appear. Direct and Concise Answers are structured responses that resolve user intent within the first 1 to 2 sentences of a section. Google Gemini prioritizes content that is immediately extractable without inference.
How does the decline in organic CTR impact tracking? Organic CTR for informational queries with AI Overviews has dropped by 61% since mid-2024, and paid CTR has declined by 68%. When an AI summary appears, the top organic link’s CTR drops by approximately 79%. This decline means visibility must shift from click-based performance to citation-based presence.
Why do users rely on AI summaries instead of clicking? Users increasingly consume answers directly inside AI summaries, which reduces traditional website visits. Desktop traffic declines by 56.1% and mobile traffic declines by 48.2% when AI summaries appear. This shift requires content that can be extracted accurately inside AI responses.
Why does concise structuring increase Gemini Traffic? Concise structuring increases Gemini Traffic because AI systems prefer clearly segmented, definitive explanations. Content that provides immediate clarity is more likely to be cited and reused inside AI Overviews.
Emphasize E-E-A-T
Why Is Emphasizing E-E-A-T Important for Tracking Google Gemini Traffic?
Emphasizing E-E-A-T (Experience, Expertise, Authoritativeness, Trustworthiness) is important for tracking Google Gemini Traffic because generative AI systems prioritize credible, verifiable, and consistently authoritative sources. E-E-A-T defines content reliability signals that influence AI citation eligibility. Google Gemini selects sources that demonstrate structured authority and factual stability.
How does E-E-A-T influence AI-generated summaries? Content aligned with E-E-A-T standards is more likely to be cited inside AI-generated summaries. Clear author attribution, structured headers, up-to-date data, and verifiable references increase retrieval confidence. AI systems evaluate cross-source agreement before selecting content for answer generation.
Why is human experience increasingly valuable? Human experience increases citation eligibility because large language models rely on existing indexed content rather than firsthand expertise. Content rooted in real-world application, documented case studies, and practical insight differentiates authoritative sources from generic summaries.
Why does following E-E-A-T strengthen long-term visibility? Following E-E-A-T builds sustained trust, improves brand authority, and stabilizes AI citation frequency over time. Trustworthiness protects against volatility in generative ranking shifts and strengthens semantic authority signals across related queries.
Create Topic Clusters
Creating Topic Clusters is important for tracking Google Gemini Traffic because Google Gemini prioritizes semantic relationships, entity depth, and structured topical authority over isolated keyword pages. Topic Clusters are structured content frameworks where one pillar page covers a broad subject and multiple cluster pages expand related subtopics through internal linking. Topic Clusters matter because AI-driven search engines evaluate subject completeness and entity relationships rather than keyword frequency alone.
Why do AI-driven search engines rank relationships instead of isolated keywords? AI-driven search engines rank relationships because generative systems retrieve semantically connected concepts when building answers. Topic Clusters demonstrate contextual breadth and entity alignment. Sites structured into entity-based clusters are cited up to 3× more frequently in AI Overviews compared to flat content structures.
How do Topic Clusters demonstrate subject matter expertise? Topic Clusters demonstrate subject matter expertise by connecting a central pillar topic with multiple subtopic expansions. This structure signals depth, consistency, and contextual authority. AI systems identify entity repetition and topical reinforcement across interconnected pages.
Why do connected pages improve indexing and citation frequency? Connected pages improve indexing because bidirectional internal links clarify content hierarchy and semantic relationships. Implementing bidirectional linking can produce a 2.7× boost in AI citations and approximately 30% lift in organic traffic across the cluster.
How do Topic Clusters impact organic and AI-driven traffic? Topic Clusters drive 30% to 85% more organic traffic across the entire cluster because structured authority increases both ranking stability and AI reuse probability. Increased topical cohesion improves both traditional SEO visibility and generative citation eligibility.
Prioritize Page Load Speed
Prioritizing Page Load Speed is important for tracking Google Gemini Traffic because slow-loading pages reduce crawl reliability, decrease engagement, and distort analytics measurement accuracy. Page Load Speed refers to the time required for a page to render usable content for users and crawlers. Page Load Speed affects both indexing eligibility and behavioral metrics that influence AI citation stability.
Why does tag implementation affect performance? Tracking tags can slow page load speed by up to 10 seconds on slow connections when excessive scripts are deployed. Adding 8 tracking tags increased load time by approximately 3 seconds on Fast 3G and 10 seconds on Slow 3G. DOM manipulation can increase Time to Interactive by approximately 3 seconds.
How does delaying tag firing improve performance? Delaying tag firing reduces render-blocking impact because scripts execute after critical content loads. Delaying tags by 1.5 seconds after Window Loaded reduced load time by 6 seconds on Slow 3G and 600 milliseconds on Fast 3G.
Why is server-side tagging beneficial? Server-side tagging improves performance by reducing client-side script execution and minimizing browser processing load. Removing unnecessary containers and consolidating tags improves Core Web Vitals and reduces bounce rates.
Use Descriptive Headings & Lists
Using Descriptive Headings and Lists is important for tracking Google Gemini Traffic because Google Gemini extracts clearly segmented answer blocks and mirrors real user query phrasing. Descriptive Headings are structured section titles that match conversational search patterns. Lists provide hierarchical clarity that improves extractability and AI reuse.
Why do Descriptive Headings improve query matching? Descriptive Headings improve query matching because they replicate natural language questions users type into Gemini. Headings such as “What Are the Key Benefits?” or “Pros vs. Cons” align directly with conversational prompts.
Why does extractable structure improve AI reuse? Extractable structure improves AI reuse because clearly segmented answers reduce interpretation ambiguity during answer synthesis. Lists, bullet points, and clearly defined sections allow Gemini to retrieve specific information blocks with minimal distortion.
Why do Lists increase skimmability and comprehension? Lists increase skimmability because they separate key ideas into consistent patterns that both users and AI systems process efficiently. Structured formatting reduces cognitive load and improves citation probability.
Ensure Mobile-Friendly Design
Ensuring Mobile-Friendly Design is important for tracking Google Gemini Traffic because Google uses mobile-first indexing, more than 50% of Google searches occur on mobile devices, and non-mobile-friendly pages increase bounce probability by up to 5×. Mobile-Friendly Design refers to responsive layout, readable typography, optimized tap targets, and fast-loading content across mobile devices. Google Gemini Traffic increasingly overlaps with mobile AI interactions, which makes mobile usability a direct performance factor.
Why does mobile-first indexing affect Gemini Traffic? Mobile-first indexing affects Gemini Traffic because Google ranks and evaluates pages based on mobile rendering first. Mobile-friendly pages receive higher visibility, which increases impressions and potential AI citation opportunities. Non-mobile-optimized pages reduce crawl efficiency and weaken structured extraction reliability.
Why does mobile search prevalence matter? Mobile search prevalence matters because over 53% of Google.com searches originate from mobile devices. Google Gemini Traffic intersects with this behavior as users interact with AI Overviews and conversational interfaces on smartphones. If mobile layout degrades readability or performance, tracking accuracy declines due to higher bounce rates and reduced session depth.
Why does user behavior influence tracking accuracy? User behavior influences tracking accuracy because poor mobile experience increases exit likelihood by up to 5×. High bounce rates distort engagement metrics and reduce measurable conversions from Gemini-driven sessions.
Test with AI on Google Search Directly
Testing with AI on Google Search directly is important because AI Overviews appear in approximately 30% of searches, Gemini 3 processes complex intent with advanced reasoning, and AI-referred users demonstrate higher engagement metrics. Testing directly in AI Mode validates citation presence and answer framing rather than relying only on analytics dashboards.
Why does AI Overview prevalence require direct testing? AI Overviews appear in about 30% of all searches and nearly 75% of problem-solving queries, which significantly alters click behavior. The CTR for the #1 organic result dropped from approximately 7.3% to 2.6% within one year when AI summaries appear, representing a 34.5% relative decrease. Google click volume for affected queries declined by approximately 30% year-over-year.
Why does Gemini 3 architecture influence tracking? Gemini 3 improves intent understanding and generates interactive responses with deeper contextual reasoning. Gemini 3 routes complex questions into AI Mode and produces dynamic visual layouts, which changes how users consume information and affects click-through probability.
Why do AI-referred users require behavioral monitoring? AI-referred users exhibit 23% lower bounce rates, 41% longer session duration, and approximately 12% more pages per visit compared to traditional organic users. Conversion rates from AI referrals are only 9% lower than traditional organic, which demonstrates high intent.
Check Citations
Checking Citations is important for tracking Google Gemini Traffic because AI Overview referrals can increase by 150%, citation-driven sessions convert at 4.4× higher rates than standard organic, and Google Gemini uses Retrieval-Augmented Generation (RAG) to extract and cite structured content. Citation monitoring shifts focus from ranking position to AI answer inclusion.
Why does referral growth from AI Overviews matter? Referral traffic from AI Overview sources has increased by 150%, which demonstrates growing AI-driven discovery influence. Monitoring citations identifies which pages generate these increases.
Why do AI citation conversions require tracking? Conversion rates from AI citation referrals are 4.4× higher than standard Google organic conversion rates. Users arriving from AI citations already perceive the source as authoritative, which shortens decision cycles.
How does RAG architecture affect citation importance? Retrieval-Augmented Generation (RAG) enables Google Gemini to retrieve documents, extract relevant passages, and cite them within generated answers. Content architecture must support extractable segments and clear entity definitions to improve citation stability.
Why does content architecture optimization matter? Content architecture optimization improves AI extraction reliability and increases AI Presence Rate. AI Presence Rate measures the percentage of relevant prompts where a brand appears.
What are the Limitations of Tracking Google Gemini Traffic?
The limitations of tracking Google Gemini Traffic are incomplete referral attribution, zero-click answer consumption, aggregation inside analytics systems, a lack of direct AI Overview labeling, and restricted visibility into AI conversation context. Google Gemini Traffic refers to sessions and brand exposure generated through Gemini-powered AI Overviews and conversational responses. Tracking Google Gemini Traffic remains partially inferential because generative search environments do not transmit complete attribution signals to analytics platforms.
What is the limitation caused by incomplete referral attribution? Incomplete referral attribution occurs because Google Gemini Traffic frequently appears as direct or generic referral traffic in Google Analytics 4 (GA4). When users copy and paste URLs from AI responses, referrer headers are not preserved. This behavior inflates direct traffic metrics and obscures true AI-driven session volume. Attribution models cannot fully separate Gemini-originated sessions from other direct entries.
What is the limitation caused by zero-click behavior? Zero-click behavior limits measurable traffic because AI Overviews often provide answers without requiring a website visit. Users consume summarized responses inside Google Search. This interaction generates brand exposure but produces no session inside GA4. Tracking systems measure clicks, not impressions inside AI summaries, which creates visibility gaps.
What is the limitation of aggregation inside analytics platforms? Aggregation inside analytics platforms reduces platform-level clarity because AI sessions are grouped under broad “Google/organic” or “referral” categories. Google Search Console (GSC) does not provide a dedicated AI Overview traffic label. GA4 requires custom channel grouping and regex filters to isolate Gemini domains, which introduces configuration dependency and potential misclassification risk.
What is the limitation of missing AI conversation context? Missing AI conversation context prevents tracking of brand mentions, sentiment, and prompt-level influence. Analytics tools record only referral sessions, not conversational exposure inside Gemini responses. Businesses cannot directly measure how often a brand appears in AI answers without specialized AI visibility tools. This creates a brand visibility blind spot.
What is the limitation related to AI model variability? AI model variability limits tracking stability because citation sources can change week-to-week. Generative systems re-rank and re-select sources dynamically. Citation volatility reduces consistency in referral patterns and complicates longitudinal measurement.
What is the limitation of relying only on traffic metrics? Relying only on traffic metrics underestimates AI influence because impressions and citations do not always generate clicks. AI Share of Voice and Citation Frequency provide complementary visibility signals that traffic reports alone cannot capture.
Tracking Google Gemini Traffic remains partially constrained because generative search environments prioritize answer delivery over click transmission, which limits direct attribution and requires indirect measurement through segmentation, citation monitoring, and behavioral analysis.
What Does the Future of Google Gemini Traffic Look Like?
The future of Google Gemini Traffic is sustained high growth driven by deep Google ecosystem integration, rapid mobile adoption, and expanding generative AI usage. Google Gemini Traffic refers to user interactions and referral sessions generated through Gemini-powered AI search and conversational interfaces. Google Gemini powered 21% of global generative AI search interactions by Q2 2025, reached approximately 450 million monthly active users, and grew mobile app usage by 210% year-over-year. These metrics confirm structural expansion rather than temporary adoption.
Google Gemini Traffic growth is reinforced by ecosystem distribution. Google Gemini integrates across Google Search, Chrome, Android, Workspace, and Maps, which increases default exposure. Gemini Traffic to gemini.google.com increased by 28.9%, and the platform’s daily active users reached approximately 35 million. Generative AI Interaction share is expected to increase further with the rollout of Gemini 3.0 in Q1 2026 and Gemini 4, which focuses on AI agents, multimodal reasoning, and persistent memory.
Google Gemini Traffic depends on 3 structural drivers listed below.
- Ecosystem Integration: Google Search routing of AI Mode queries increases exposure scale.
- Mobile Acceleration: 210% mobile growth shifts usage toward mobile-first AI interaction.
- Model Advancement: Gemini 3 and Gemini 4 expand reasoning depth and multimodal capabilities.
Google Gemini Traffic is positioned for continued expansion because generative AI search increasingly replaces link-based navigation with synthesized responses.
Is Gemini Traffic the Same as AI-Assisted Search Traffic?
No, Gemini Traffic is not the same as AI-Assisted Search Traffic, but Gemini Traffic is a subset of AI-Assisted Search Traffic. Gemini Traffic refers specifically to sessions and interactions generated through Google Gemini-powered environments. AI-Assisted Search Traffic refers to all traffic originating from AI-driven platforms, including ChatGPT, Copilot, Perplexity, and Gemini.
Gemini Traffic operates inside the Google ecosystem, including Google Search AI Mode, Google Maps integration, Chrome, Android, and Workspace. AI-Assisted Search Traffic includes traffic from non-Google generative engines. Gemini’s share of generative AI web traffic increased from 6% to 22% within one year, while ChatGPT’s share decreased from 87% to 65%. This distribution confirms that Gemini Traffic represents one component of a broader AI-Assisted Search Traffic category.
Will Google Improve Gemini Traffic Attribution Over Time?
Yes, Google is likely to improve Gemini Traffic attribution over time because Gemini usage and market share are expanding rapidly. Gemini’s traffic share increased by approximately 3.3% month-over-month, and web traffic grew more than 28% in December 2025. Gemini reached roughly 21.5% market share in the generative AI category by the end of 2025.
Improved attribution is probable because advertising, publisher reporting, and enterprise analytics require clearer AI-driven segmentation. Google’s infrastructure advantages, including TPU-based model deployment and integrated search routing, enable scalable tracking refinement. Average session duration of approximately 7 minutes 20 seconds and increased pages per visit demonstrate sustained engagement, which increases pressure for clearer attribution models.
How Reliable Are ChatGPT Traffic Metrics Today?
ChatGPT Traffic Metrics are directionally reliable for trend analysis but structurally incomplete for full attribution measurement. ChatGPT Traffic converts at approximately 24%, which is 6× higher than traditional Google traffic in some cases. Approximately 66% of conversions from LLM referrals occur within 7 days, which indicates high-intent behavior.
ChatGPT generates approximately 5% of website traffic for some brands, and 91% of Webflow’s LLM referrals originate from ChatGPT. However, ChatGPT click-through rates range between 1% and 5%, compared to 35% to 40% for Google Search. AI search rankings are volatile, and citation sources change frequently.
ChatGPT Traffic Metrics are reliable for measuring conversion efficiency and directional growth. ChatGPT Traffic Metrics are less reliable for measuring full exposure because zero-click AI consumption is not captured in referral analytics.
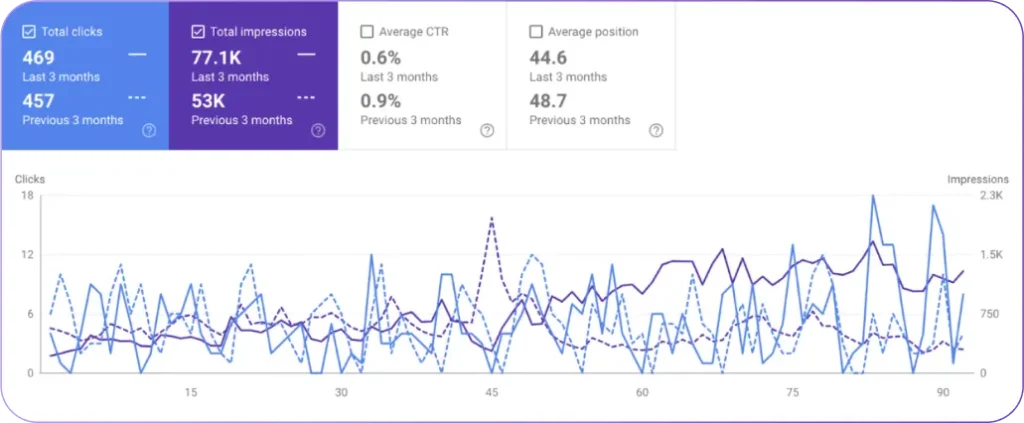
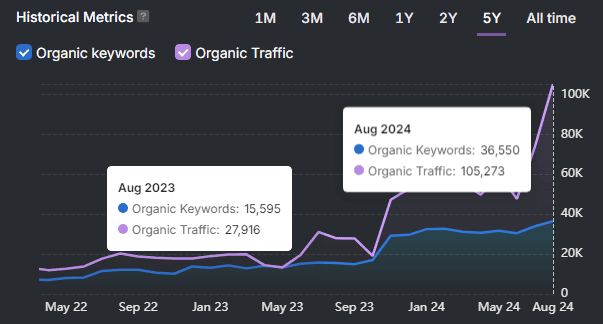
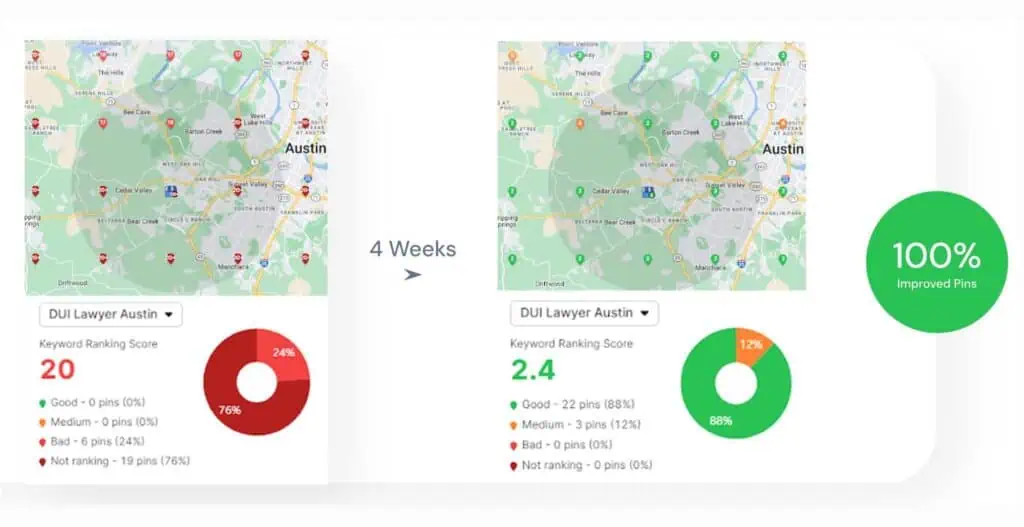
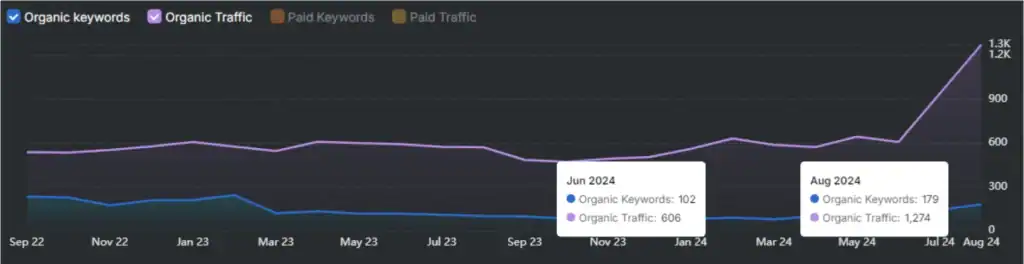