

SEO statistics and facts in 2025 define how websites rank, how content reaches users, and how businesses compete in search engines. The latest SEO statistics in 2025 reflect real search algorithm behavior, not speculation. Search engine optimization statistics reveal how Google applies E-E-A-T signals, how ranking factors shift, and how performance signals drive visibility across industries.
These SEO facts include expert-vetted platform data, peer-reviewed studies, and verified industry benchmarks on every key SEO domain. Readers will find updated benchmarks for local SEO, video SEO, mobile usability, technical performance, AI-driven tools, international rankings, ecommerce visibility, ROI tracking, SEO software adoption, and more.
The ultimate collection of 300 SEO statistics and facts for 2025 is listed below.
What Are the Top 10 SEO Statistics You Should Know in 2025?
The top 10 SEO statistics for 2025, curated and powered by Search Atlas experts, highlight the central role of search engine optimization in digital marketing strategies. These SEO stats demonstrate the measurable impact of SEO on business growth, user behavior, and marketing ROI.
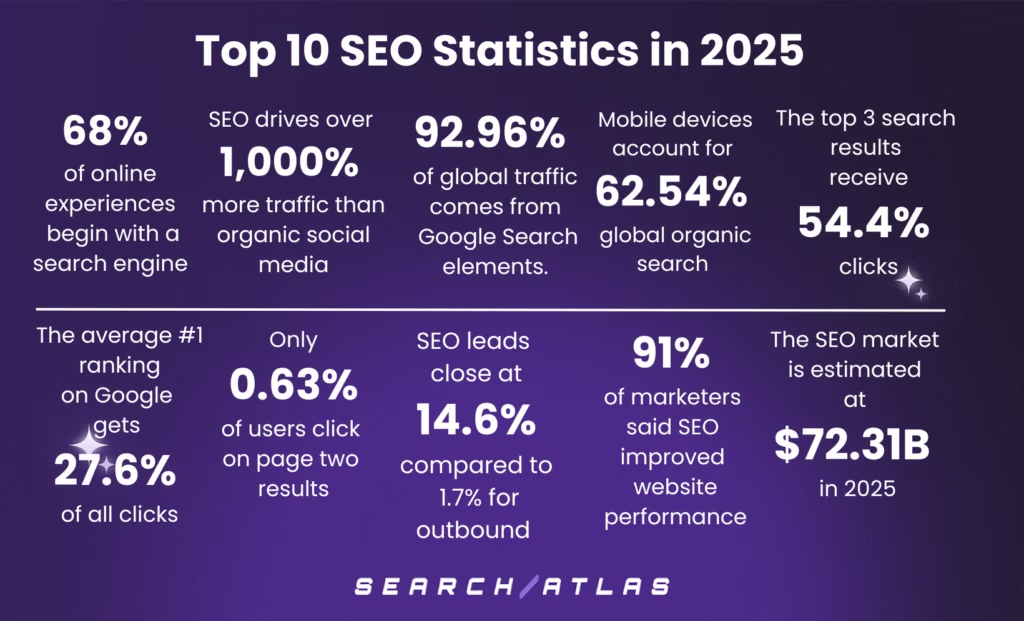
- 68% of online experiences begin with a search engine, according to BrightEdge. Search engines remain the primary gateway for users discovering new websites, products, and services.
- SEO drives over 1,000% more traffic than organic social media, according to BrightEdge.The average website receives 53.3% of its traffic from organic search compared to 5% from social media.
- 92.96% of global traffic comes from Google Search, Google Images, and Google Maps, according to SparkToro’s market share analysis. Google maintains its dominant position as the world’s leading search engine.
- Mobile devices (excluding tablets) accounted for 62.54% of global organic search traffic in Q4 2024, according to Statista. Mobile-first indexing makes mobile SEO imperative for visibility and traffic.
- The average #1 ranking on Google receives 27.6% of all clicks, according to Advanced Web Ranking. The top position attracts more traffic than all lower-ranked listings combined.
- The top 3 search results receive 54.4% of clicks, according to Backlinko. Higher rankings deliver the bulk of engagement in Google SERPs.
- Only 0.63% of users click on page two results, according to Backlinko’s SERP CTR study. Over 99% of organic traffic goes to page one listings.
- SEO leads close at 14.6% compared to 1.7% for outbound leads, according to Doyen Digital research. SEO delivers leads that are 8.5 times more likely to convert.
- 91% of marketers said SEO improved website performance in 2024, according to Conductor’s 2025 State of SEO Survey. Most digital teams credit SEO with achieving search visibility and revenue goals.
- The SEO market is estimated at $72.31 billion in 2025 and projected to reach $106.15 billion by 2030 at a CAGR of 7.98% during the forecast period (2025-2030), according to Mordor Intelligence industry report. SEO continues to scale as a core driver of long-term digital growth.
What Are the Local SEO Statistics?
Local SEO statistics demonstrate the importance of location-based optimization for businesses serving specific geographic areas. Local SEO stats reveal how consumers use local search to find nearby products and services.
The top local SEO statistics are below.
- 46% of all Google searches have local search intent, according to Search Engine Roundtable. Optimizing for local search can help you capture nearly half of Google’s daily search traffic.
- “Near me” searches have grown 500% over the past 5 years, as reported by Think with Google. Mobile users increasingly rely on proximity-based searches.
- 97% of consumers use online search to find local businesses, based on Central Street Digital reports. Online visibility directly impacts foot traffic and local sales.
- 64% of small businesses have a local SEO presence, according to Miromind. There is a growing adoption of local SEO practices in SEO for small businesses.
- Customers are 2.7x more likely to view a business as reputable if it has a complete Google Business Profile, according to Google.
- Verified businesses receive over 21,643 views annually in Google Search, according to Birdeye.
- Businesses with complete Google Business Profile listings are 70% more likely to attract location visits based on Google’s internal data. Google Business Profile completeness significantly impacts local search performance.
- Verified Google Business Profiles generate around 200 clicks or interactions per month, according to Birdeye. Optimized listings drive meaningful user actions through calls, directions, and website visits.
- Local search drives about 105 website visits per month through verified Google Business Profiles, according to Birdeye. GBP traffic contributes measurable referral traffic from local search results.
- Over half of consumers call a business directly from its Google Business Profile, according to RedLocalSEO. Direct actions from listings show the transactional intent behind local queries.
- Businesses receive around 595 calls annually from verified Google Business Profiles, according to Birdeye. Local listings produce consistent inbound call volume throughout the year.
- 75% of marketers say using Google Business Profile features influences local search rankings, according to MOZ. Feature adoption (such as Q&A, images, and attributes) plays a role in SERP visibility.
- Businesses that include images in their Google Profiles receive 42% more direction requests and 35% more clicks to their websites, according to Google. Visual content improves engagement and navigation from local listings.
- The top 3 local SEO services valued by businesses are Google Business Profile management (52%), content creation (39%), and website design (34%), according to BrightLocal. Local business owners prioritize local SEO tools that improve search visibility and customer experience.
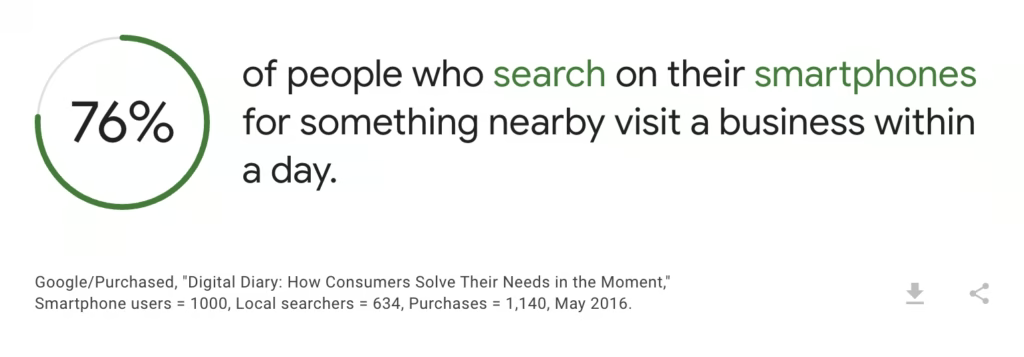
- 76% of people who search for something nearby on their smartphone visit a business within a day, according to Google. This local SEO statistic highlights the immediate action consumers take following local searches.
- 28% of local searches result in a purchase, according to Google. The 28% conversion rate emphasizes the high commercial intent behind local queries.
- 97% of people learn more about a local company online than anywhere else, according to SEO.com. This shows the critical role of online presence in local business discovery.
- 30% of all mobile searches relate to location, according to Google. Mobile users rely on search engines to find nearby services while on the move.
- 80% of local mobile searches convert, according to LocaliQ. The high conversion rate demonstrates the value of mobile optimization in local SEO strategies.
- 78% of local mobile searches result in offline purchases, according to Search Engine Land. This statistic underscores the influence of local SEO on in-store sales.
- 40% of local SEO campaigns achieve a 500% or better ROI, according to Finances Online.
- 88% of consumers use Google Maps for local business discovery, according to BrightLocal. Google Maps SEO dominates local search navigation, while only 12% of users rely on Apple Maps.
- 40% of consumers search for a local business’s opening hours at least several times per month, according to BrightLocal. Search behavior often centers around practical, time-based decision-making.
- 39% of consumers check if a local business is dog-friendly, child-friendly, or accessible at least once per month, according to BrightLocal. Attribute-based searches influence which local businesses users visit.
- .42% of users who perform a local search click on a result in the Google Map Pack, according to Backlinko. Local map visibility captures nearly half of searcher clicks for geographically tagged queries.
- 68% of users prefer to click on local 3-pack results in Google, according to RedLocalSEO. Ranking in the top 3 local listings leads to dominant click-through behavior.
- Businesses that rank in the Google 3-pack receive 126% more traffic than those ranked between 4 and 10, according to RedLocalSEO. Appearing in the local pack significantly boosts traffic and on-site actions compared to lower-ranked competitors.
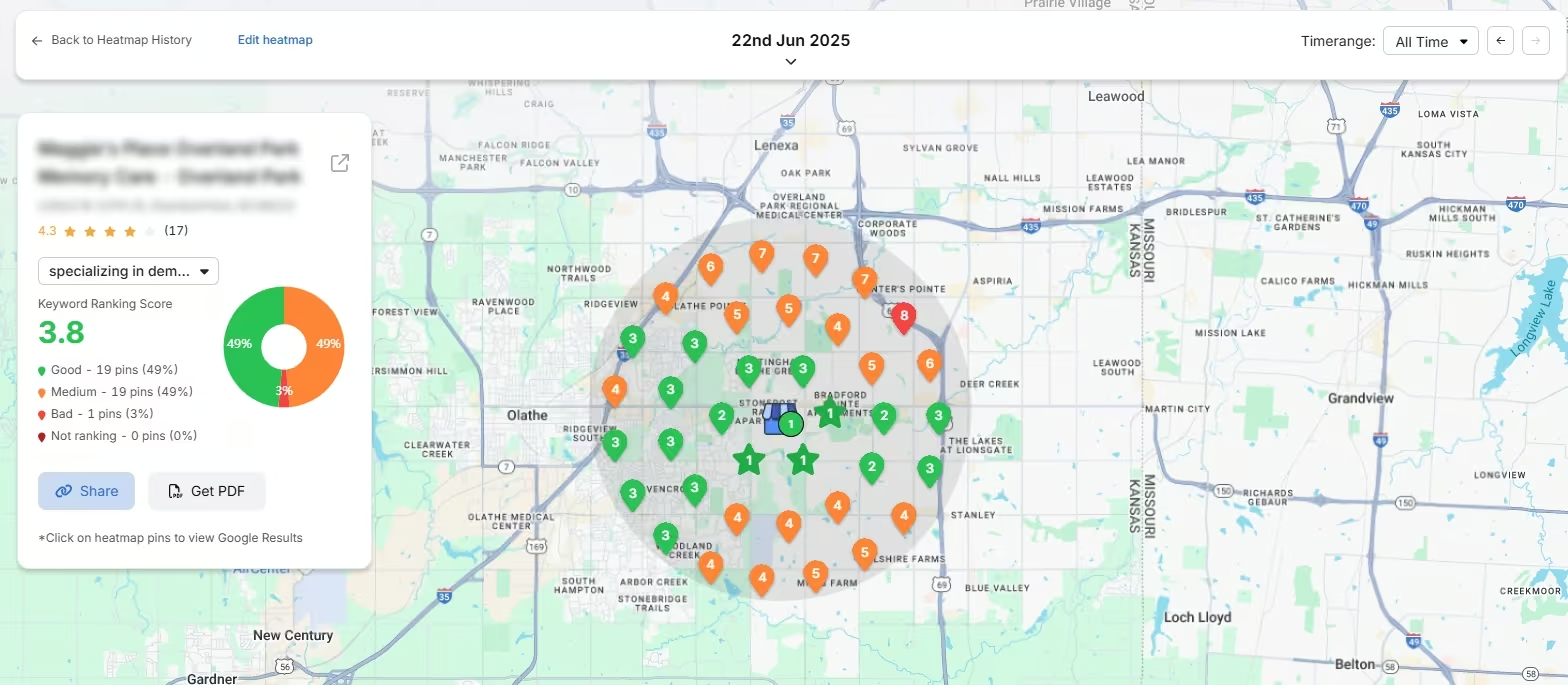
- Proximity accounts for 48% of ranking influence in local pack results across all industries, making it the single most powerful local SEO factor, based on the Search Atlas Ranking Correlation Study from May 2025. This confirms physical distance to the search center as the primary visibility driver in local search.
- The business sector contributes 21% of the predictive model’s gain, which means the category of business significantly affects how Google ranks local listings, according to the Search Atlas Ranking Correlation Study from May 2025. Different verticals (e.g., dentists vs. movers) follow distinct ranking patterns.
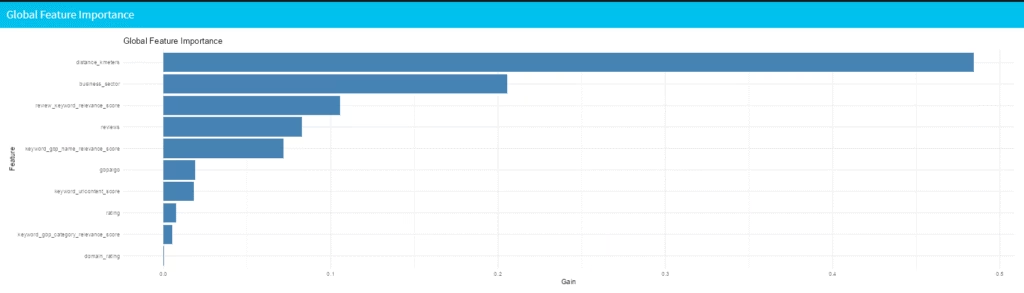
- Review keyword relevance contributes 11%, indicating that review content aligned with the keyword improves GMB rankings more than raw volume (the Search Atlas Ranking Correlation Study, May 2025). Semantic alignment between review text and search intent is an underused ranking lever.
- Review count influences 8% of rankings, which shows that volume of feedback still plays a strong role, though less than content relevance.
- Keyword-to-business name relevance affects 7% of ranking performance, emphasizing the benefit of embedding target keywords in GBP names. Brand names that include service keywords (e.g., “City HVAC Repair”) gain an SEO advantage.
- 72% of consumers use voice assistants to search for local businesses, according to SynUp. Voice-based discovery affects how users find services by proximity and intent.
- 76% of voice searches include “near me” or other local intent phrases, according to SynUp. Proximity-based queries dominate voice search patterns in local SEO.
- 58% of people use voice search to find local business details while on the go, according to BrightLocal. Convenience and speed drive voice-based interactions for local queries.
- 75% of consumers say they “always” or “regularly” read online reviews when researching local businesses, according to BrightLocal. Online review visibility influences how users evaluate local providers before visiting or purchasing.
- 89% of consumers are more likely to choose a business that replies to all reviews, according to Capital One Shopping. Active engagement with feedback strengthens credibility and drives conversions.
- 63% of users say they would lose trust in a business if it mostly had negative reviews, according to a BrightLocal study. Online sentiment directly affects customer perception and drop-off risk.
- 91% of consumers say reviews for local branches shape their overall opinion of national brands, according to BrightLocal. Multi-location businesses depend on local SEO for multiple locations to maintain brand strength.
- 36% of users aged 25 to 34 rely on reviews to research products and services, according to Statista. Review habits remain strongest among younger, research-driven consumers.
- 49% of consumers trust online reviews as much as personal recommendations, according to BrightLocal. Review platforms replace word-of-mouth for nearly half of users.
What Are the Video SEO Statistics?
Video SEO statistics highlight the growing importance of video content in search results in 2025. Video statistics (including YouTube SEO statistics) demonstrate how video SEO optimization impacts rankings and engagement.
The most important video SEO stats are below.
- 89% of businesses use video as a marketing tool in 2025, with 95% considering it integral to their strategy, according to Wyzowl. This majority underscores the widespread adoption and importance of video in marketing efforts.
- YouTube is the world’s second-largest search engine, processing over 3 billion searches per month according to YouTube’s 2024 statistics. YouTube content requires dedicated YouTube SEO strategies.
- Videos appear in 62% of Google search results pages, while 80% of those are from YouTube, as stated by Social Pilot. Video content increases the likelihood of gaining visibility in search features like video carousels and featured snippets.

- Search results featuring videos drive 157% more organic traffic compared to those without, as reported by AIOSEO. Incorporating video content significantly boosts visibility and click-through rates.
- Video content has a 41% higher CTR than text-only pages, according to AIOSEO.
- Including videos in emails can boost click-through rates by up to 300%, according to Oberlo. Video content in emails enhances engagement and encourages user interaction.
- Pages with video content are 53x more likely to rank on Google’s first page, according to Forrester Research’s video marketing study. Video notably enhances ranking potential.
- Embedding videos on landing pages can increase conversion rates by up to 80%, based on findings from WebFX. Videos effectively engage visitors and drive desired actions.
- Websites with video content have an average conversion rate of 4.8%, compared to 2.9% for those without, as reported by Brightcove. This demonstrates the power of video in converting visitors into customers.
- Video increases the average time on page to over 6 minutes, compared to 3 minutes for non-video pages, according to Wistia. Higher dwell time improves behavioral signals that influence rankings.
- 78% of people watch videos online every week, with 55% engaging daily, according to SocialPilot. Regular video consumption indicates a strong opportunity for marketers to reach audiences.
- After watching a branded video, 64% of viewers are more likely to make a purchase, based on data from WordStream. Video content can strongly influence purchasing decisions.
- 68% of consumers prefer watching videos to learn about new products or services, compared to articles, infographics, e-books, and presentations, according to WordStream.
- Videos under 15 seconds perform best on platforms like Instagram and X (formerly Twitter), while 15-60 second videos are preferred on TikTok, as per Sprout Social. Tailoring video length to platform preferences can enhance engagement.
- Over 70% of YouTube watch time comes from mobile devices, according to YouTube. Mobile optimization remains essential for video SEO performance and watch retention.
- Over 500 hours of video are uploaded to YouTube every minute, according to YouTube Press. Video saturation increases competition, which makes metadata and thumbnail optimization more critical.
- YouTube videos with transcripts rank higher for 95% of their target keywords, according to 3Play Media. Captions and transcripts improve semantic relevance and accessibility.
- Marketers rank video as the #1 content format for ROI in 2025, according to HubSpot. Video marketing remains the most profitable format for engagement and lead generation.
- Videos generate 12 times more shares than text and images combined, according to WordStream. Video content encourages wider reach and audience amplification.
What Are the Keyword Research Statistics?
Keyword research statistics reveal how users search and how businesses optimize for search queries. The relevant keyword research statistics for 2025 demonstrate the importance of strategic keyword targeting.
The top keyword research statistics are listed below.
- Long-tail keywords account for 70% of all search traffic, according to Embryo Agency. Long-tail keywords, as specific, multi-word phrases, often have lower competition and higher conversion rates.
- 94.74% of keywords receive 10 or fewer monthly searches, based on Ahrefs data. This highlights the huge number of low-volume keywords that can be targeted for a niche audience
- 15% of Google searches have never been searched before, according to Google’s 2024 search statistics. New queries constantly emerge, requiring ongoing keyword research.
- 0.0008% of keywords have over 100,000 monthly searches, as reported by AISEO. These high-volume keywords are extremely competitive and rare.
- Over 58% of Google searches in the U.S. result in zero clicks, according to SparkToro. It indicates that users often find answers directly on the search results page.
- The average Google first page result contains 1,447 words according to Backlinko’s content analysis study. Comprehensive content performs better for competitive keywords.
- Keyword intent distribution includes 52.65% informational, 32.15% navigational, 14.51% commercial, and 0.69% transactional intent, as per SparkToro data. Understanding keyword intent is crucial for successful keyword targeting.
- Pages ranking in the top 10 of Google search results have a 50% lower keyword density than those ranking two years ago, as reported by BrightEdge. This reflects a shift towards prioritizing content quality and relevance over keyword stuffing in SEO practices.
- 46.08% of clicks in Google Search Console go to hidden terms, as reported by Ahrefs. A significant portion of search traffic comes from keywords not disclosed in reports.
- Branded keywords make up over 44% of Google searches, based on SparkToro data. Branded keywords’ prevalence underscores the importance of brand recognition in search behavior.
What Are the Technical SEO Statistics?
Technical SEO statistics and facts demonstrate the impact of website performance and structure on search rankings. Technical SEO stats for 2025 highlight the lasting importance of technical optimization.
The top technical SEO statistics are outlined below.
- Page speed is a direct ranking factor for both desktop and mobile searches, confirmed by Google.
- 53% of mobile users abandon sites that take longer than 3 seconds to load, according to Think with Google. Page speed SEO optimization is critical for user retention.
- Load times between 0 and 4 seconds yield the highest conversions, as found in a study by Portent.
- Websites meeting Google’s Core Web Vitals standards see a 24% increase in user engagement according to Google data. Optimizing Core Web Vitals enhances user experience and search rankings.

- A one-second delay in mobile load time can result in up to a 20% drop in conversion rates, according to SOASTA.
- Only 33% of websites pass Google’s Core Web Vitals assessment according to data from the Chrome User Experience Report (CrUX).
- Nearly 70% of users say that a retailer’s website speed affects their willingness to make a purchase, noted by Electro IQ.
- Websites with HTTPS encryption have a 5% ranking advantage, as cited on SSL Score. HTTPS SEO influences search performance.
- 88% of websites use HTTPS, as reported by W3Techs. Secure connections are now standard, and they contribute to user trust and SEO rankings.
- Over 67% of domains implementing Hreflang tags have configuration issues, according to an Ahrefs study. Hreflang tags implementation is a crucial part of international SEO efforts.
- Google rewrites 76% of page titles in SERPs as of Q1 in 2025, confirmed by Search Engine Land data. This is a big increase from 61% in 2023, which means poorly written or misaligned titles risk being replaced more than ever.
- 31.2% of websites are not using structured data formats like schema markup, according to the Smart Metrics Agency. Schema markup helps search engines understand the content on a webpage.
- Structured data increases websites’ CTR up to 40%, as BlueTone Media reports. Schema markup enhances visibility in rich results.
What are the Mobile SEO Statistics?
Mobile SEO statistics for 2025 reveal the dominance of mobile search and the importance of optimizing for mobile devices. Mobile SEO statistics demonstrate how mobile-first indexing shapes SEO strategies.
The curated mobile SEO stats are below.
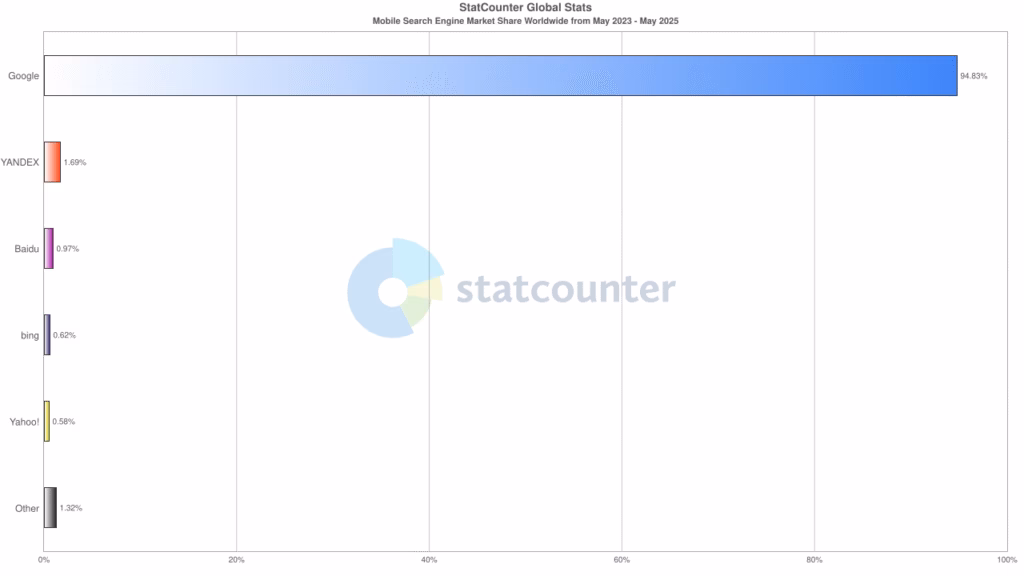
- Google holds 95% of the global mobile search engine market share, according to GS StatCounter. Google’s dominance in the search reinforces the need to optimize for Google’s mobile-first indexing.
- Google uses mobile-first indexing for 100% of new websites, as confirmed in Google’s 2024 indexing guidelines. Mobile versions determine search rankings.
- 96% of internet users (approximately 4.97 billion people) access the web via mobile devices, based on Status Labs reporting. Mobile accessibility is now a default global behavior.
- Africa has the highest mobile internet share at 74%, followed by Asia at 69% and South America at 56%, as reported by Statista. Mobile SEO matters most in regions where desktop access is limited.
- Nearly 63% of Google’s organic search traffic in the United States comes from mobile devices, according to Oberlo.
- 87% of smartphone users use a search engine at least once per day, based on data from Go-Globe. Mobile search is a daily discovery behavior across user segments.
- 51% of smartphone users have discovered a new brand or product through mobile search, according to Google research. This mobile SEO stat reinforces the role of mobile visibility in top-of-funnel SEO.
- 60% of users on smartphones contact a business directly through mobile search, especially via click-to-call, maps, or quick links, as stated on Think with Google.
- 80% of top-ranking websites are mobile-optimized, according to Status Labs.
- 61% of mobile users are unlikely to return to a site they had trouble accessing, according to Vidico. Mobile usability impacts long-term success.
What Are the E-commerce SEO Statistics?
E-commerce SEO statistics refer to data points that measure the impact of search engine optimization on online retail performance. Ecommerce SEO statistics reveal how organic traffic, product visibility, structured data, and page experience affect traffic, engagement, and conversions in ecommerce websites.
The most relevant e-commerce SEO statistics are outlined below.
- Organic Google search drives at least 43% of all traffic to ecommerce websites, according to Reboot Online. SEO is the top acquisition channel for ecommerce brands.
- Organic traffic accounts for 23.6% of all ecommerce sales, according to SeoProfy, which means that SEO contributes nearly one in four online purchases.
- E-commerce sites that load in 1 second have 3x higher conversion rates according to Portent’s 2024 site speed study. Performance optimization drives sales.
- Retailers that optimize meta titles and product descriptions see a 32% increase in organic sales, according to BigCommerce’s internal data. Basic on-page SEO changes improve ecommerce revenue.
- Product pages in the top two positions get 2.72x more referring domains, according to SurferSEO research. Higher link equity strengthens competitive rankings.
- Amazon ranks first in Google Shopping 52% of the time, as cited by 180 Marketing. Competing ecommerce stores need optimized product listings to claim the remaining SERP space.
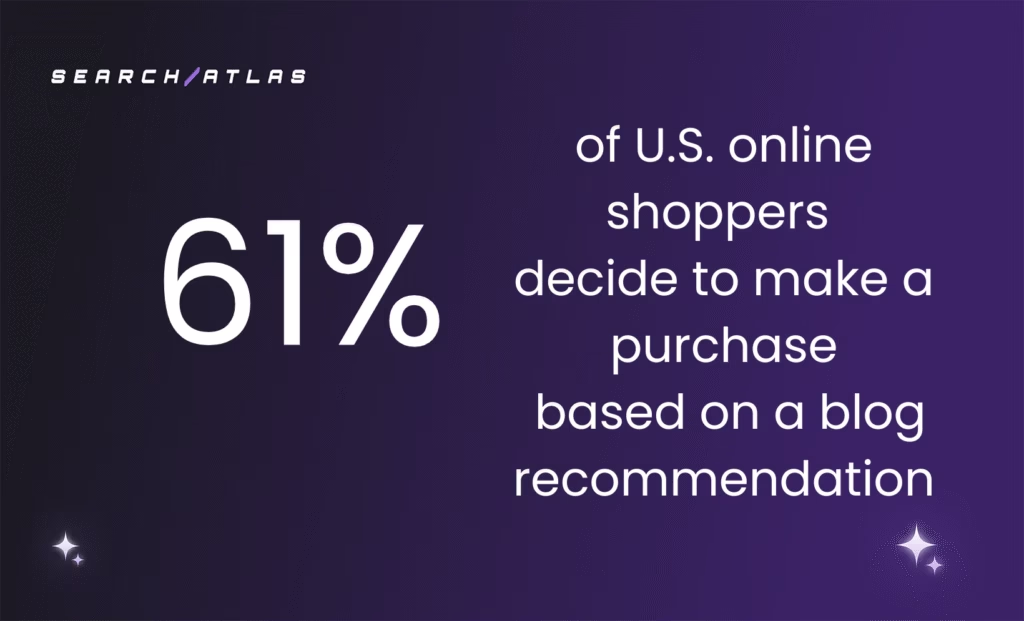
- 61% of U.S. online shoppers decide to make a purchase based on a blog recommendation, according to Reboot Online.
- Product pages with customer reviews receive 18% more traffic according to ESW e-commerce analysis. Product SEO with user-generated content boosts SEO performance.
- Over 90% of low-performing eCommerce brands struggle with thin content, and 98% fail to include user-generated content (UGC), based on Reboot Online’s research.
What are the International SEO Statistics?
The international SEO statistics for 2025 reveal how language preferences, localization tactics, and regional search behavior affect global visibility and performance. International SEO stats highlight the measurable impact of implementing hreflang tags, multilingual content, and geo-specific targeting on international organic traffic and conversions.
The top international SEO statistics for 2025 are below.
- 75% of users prefer to buy products in their native language, according to CSA Research data.
- Google operates in over 190 countries and offers search in over 150 languages.
- Websites using SEO localization see a 70% increase in organic traffic within 12 months, as stated by Weglot. SEO localization improves discoverability in international markets.
- Sites with correctly implemented hreflang tags see a 20% drop in bounce rates, according to SEMrush data. Hreflang ensures users land on content that’s relevant to their region and language.
- Google indexes content by language and country independently, as confirmed in Google Search Central documentation. Separate keyword research and SEO strategies are required for each locale.
- Localized content performs 6x better than translated content, based on a study by the Nieman Journalism Lab. Cultural adaptation in multilingual websites combined with SEO translation improves engagement.
- Websites with translated metadata see a 13% increase in click-through rates from international SERPs, according to Weglot data.
- Cross-border ecommerce is expected to reach $7.9 trillion by 2030, with a CAGR of 25.1%, based on Statista projections.
- 70% of global search queries are non-English, based on Google Trends multilingual data. Multilingual SEO unlocks traffic opportunities outside English-speaking markets.
What Are the SEO ROI Statistics?
The most important SEO ROI statistics in 2025 demonstrate how search engine optimization delivers long-term value across acquisition, conversion, and cost-efficiency. SEO ROI stats reveal that organic search consistently outperforms paid channels when it comes to return on investment.
The SEO ROI statistics are listed below.
- SEO converts 84.62% more users than PPC, according to FirstPageSage. Organic traffic delivers higher purchase intent and stronger lead quality.
- SEO returns $22 for every $1 spent, based on SmartInsights data. This makes SEO the highest ROI channel across all digital marketing investments.
- B2B SaaS companies report a 702% average SEO ROI, according to FirstPageSage. Long-tail queries and informational content drive lower-cost conversions.
- Ecommerce brands generate a 317% SEO ROI, according to FirstPageSage’s 2025 industry benchmark. Organic product discovery scales faster than paid acquisition.
- Real estate firms earn a 1,389% return from SEO, based on FirstPageSage’s case data. Informational content funnels users into high-converting lead forms.
- SEO leads close at 14.6%, compared to 1.7% for outbound, based on Intergrowth research. SEO acquisition delivers 8.5x better conversion rates.
- SEO reduces lead costs by 61% compared to outbound, according to Demand Metric. Organic visibility lowers acquisition expenses across all industries.
- 50% of marketers rate SEO as the top ROI channel, based on WebFX’s survey. Search consistently outperforms email, social, and paid campaigns.
- SEO delivers an average 825% ROI across all verticals, according to FirstPageSage. The compound return builds over 36 months through consistent publishing.
What Are the SEO Software Statistics?
SEO software statistics reveal the growing market for SEO tools and platforms. SEO software statistics demonstrate how businesses invest in SEO technology.
The crucial SEO software statistics are listed below.
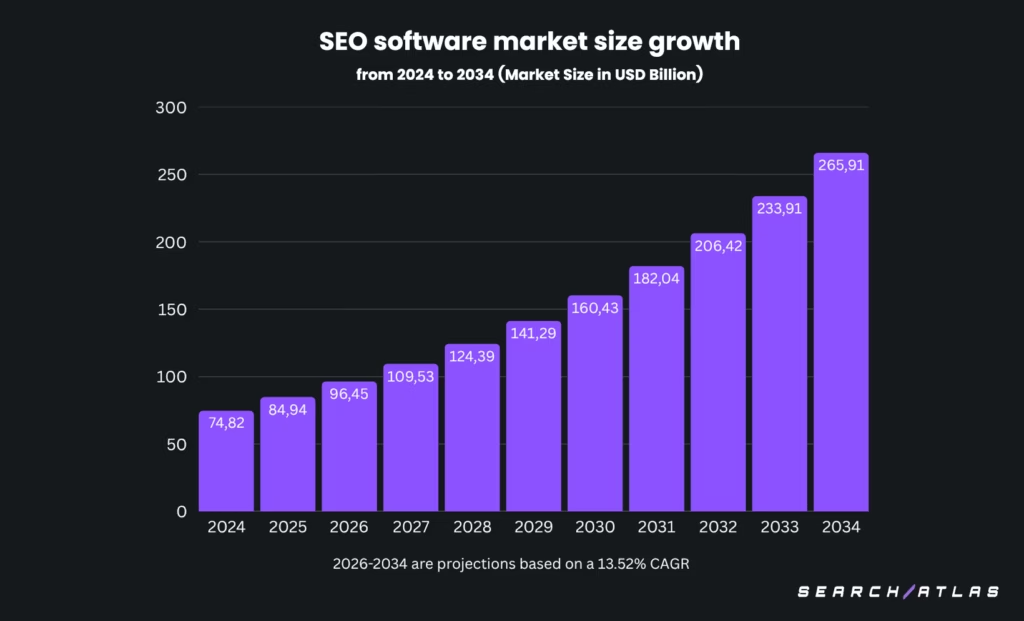
- The SEO software market was estimated at USD 74.82 billion in 2024, according to Presedence Research’s market analysis. SEO tools represent a significant technology sector.
- The global SEO software market is projected to reach USD 265.91 billion by 2034, based on Precedence Research’s long-term forecast. SEO software market demand continues to grow as digital presence becomes non-negotiable.
- The US SEO software market generated USD 20.8 billion in revenue in 2024, according to Grand View Research. The US remains the leading region for SEO technology adoption.
- The Asia Pacific SEO software market is expected to grow at a rate of 16.52% CAGR through 2034, according to Precedence Research’s regional projections.
- Europe’s SEO software market is projected to grow at a CAGR of 12.6% from 2025 to 2034, fueled by increasing adoption of digital marketing across various industries and the rise of GDPR compliance requirements.
- The local SEO software market is projected to reach USD 59.72 billion by 2032, growing at a CAGR of 20% during the forecast period 2026-2032.
- Cloud-based deployment accounted for over 58% of the SEO software market share in 2024, according to Precedence Research. Remote access and scalability drive preference for cloud solutions.
- Large enterprises made up 56% of the total SEO software market in 2024, based on Precedence Research data. Bigger organizations invest more heavily in digital visibility tools.
- The AI SEO software market was valued at USD 1.99 billion in 2024, according to Salt Creative insights.
What Are the Enterprise SEO Statistics?
The enterprise SEO statistics reveal how large-scale businesses approach SEO software, budgets, outsourcing, and team structure in 2025. These statistics reveal the scale and complexity of enterprise SEO efforts and the importance of enterprise SEO software.
The top enterprise SEO stats are listed below.
- The global Enterprise SEO Platforms market is projected to grow from USD 4.5 billion in 2023 to USD 15.7 billion by 2033, at a CAGR of approximately 13.5%, based on DataHorizzon Research.
- Cloud-based deployment in the Enterprise SEO Platforms Market is projected to grow from USD 5.19 billion in 2023 to USD 22.72 billion by 2032, according to Market Research Future, showcasing its dominant appeal due to flexibility, scalability, and cost-effectiveness.
- 75% of large enterprises outsource their SEO tasks, based on Marketix Digital research, which is a big up from 71% in 2019.
- 72% of enterprises rate SEO as successful to some degree, which highlights its effectiveness in driving marketing objectives like increasing web traffic.
- 57% of enterprises rated limited SEO in-house skills as the most challenging obstacle, while 43% reported limited SEO budget as the most challenging obstacle for their organization, as cited by Conductor.
- Enterprise websites have an average of 10 million+ pages, but only 3.5% receive organic traffic according to Botify’s 2023 analysis of 6.3 billion URLs across 1,000 enterprise websites. This massive indexation challenge means most enterprise content never reaches its audience, and this is where enterprise SEO tools play the biggest role.
- The average enterprise SEO budget can reach $500,000 or more annually, as cited by Mojo Dojo.
What Are the AI SEO Statistics?
AI SEO statistics refer to verified data points that illustrate how artificial intelligence influences search engine optimization. AI SEO stats include metrics on AI Overviews, zero-click searches, ChatGPT search volumes, informational query behavior, and the impact of LLMs (Large Language Models) on traffic, visibility, and SEO KPIs.
The top AI SEO statistics in 2025 are listed below.
- 86% of SEO professionals have already integrated AI into their strategy, according to SEOClarity. AI has become standard in modern SEO workflows.
- 82% of enterprise SEOs plan to invest more in AI, based on data from SeoClarity.
Enterprise teams are doubling down on AI to scale performance across large sites. - 58% of SEO professionals are considering integrating AI tools into their processes, reported by BrightEdge.
- 61% of marketers say AI is a core part of their strategy, according to Semrush. AI has moved from experimentation to strategy-level importance.

- 37% of businesses that don’t use AI say it’s because they don’t understand how it works, according to Semrush. Education remains a barrier to wider adoption.
- 67% of SEO professionals say the main benefit of AI SEO tools is automating repetitive tasks, SeoClarity finds. Time-saving remains the top practical reason for adopting AI SEO tools.
- 75% of marketers use AI to reduce time on tasks like keyword research and meta-tag optimization, according to HubSpot.
- AI tools save up to 50% of time spent on data analysis and interpretation, according to Bureau Works.
- 60% of businesses use AI to brainstorm and conduct keyword research, according to FlyingCatMarketing.
- 63% of businesses use AI to generate content outlines, FlyingCatMarketing reports. This simplifies the content ideation process and boosts speed to publish.
- 73% of businesses now use AI for content creation, as per McKinsey’s 2025 State of AI report. Content creation is one of the most significant parts of the SEO process, and automating it can lead to great wins when done right.
- 67% of marketers saw improved content quality from AI-assisted writing, according to Semrush. AI raises baseline quality when combined with human editing.
- 93% of marketers review AI-generated content before publishing, based on Semrush. Human oversight remains necessary for quality and accuracy.
- Headlines generated by AI outperformed human-written ones in 46% of A/B tests, according to SEO.AI.
- 84% of marketers believe AI is most effective for aligning content with search intent, according to Statista. Intent-matching is one of AI’s most valuable contributions to SEO.
- 70% of businesses say ChatGPT helps them create content faster, based on Forbes Advisor. Generative AI dramatically speeds up copy production cycles.
- 65% of businesses report better SEO results with the help of AI, according to Semrush.
- 52% of SEO professionals saw improved performance from using AI in on-page SEO, reported by SeoClarity.
- Two-thirds of businesses using AI report a revenue growth rate increase of 25% or more, IBM finds. AI not only boosts rankings, but it drives top-line revenue growth as well.
- 40% of marketers experienced a 6-10% increase in revenue after applying AI to SEO, according to SEO.AI. Even modest AI adoption gives measurable financial results.
- 65.14% of professionals cite content authenticity and quality as top concerns when it comes to generative AI, as reported by SEOClarity.
- 58.5% of Google searches in the U.S. result in zero clicks, according to SparkToro’s 2024 study. AI features and rich SERP elements reduce the need to visit external websites.
- Organic click-through rates drop by 20-40% when AI Overviews appear, according to Seer Interactive. Google’s AI-generated answers suppress traditional organic listings and reduce traffic from informational queries.
- Informational queries trigger AI Overviews most often, based on analysis from Datos and SparkToro. Top-of-funnel content is increasingly intercepted by AI summaries, changing how awareness-stage SEO performs.
- AI Overviews have the highest impact on top-of-funnel content, according to Seer Interactive and Break The Web. SEO strategies now require channel diversification and influence-based metrics to adapt to AI reshaping visibility.
- ChatGPT receives 37.5 million daily prompts vs. Google’s 14 billion daily searches, according to SimilarWeb data shared by Break The Web. LLMs are growing but remain a small layer in the search.
- 21% of U.S. users visited ChatGPT monthly in Q4 2024, but 99.8% still used Google, based on SparkToro and SimilarWeb.
- Informational queries make up 52.2% of prompts on ChatGPT vs. 36.4% of searches on Google, according to Break The Web. Content marketers targeting informational keywords face increased competition from AI-generated summaries.
- Brands report rising revenue despite declining blog traffic, based on HubSpot’s Q4 earnings data cited by Break The Web. New attribution models and brand recall are replacing traditional traffic KPIs.
What Are the Voice Search SEO Statistics?
Voice Search SEO statistics refer to verified data that reflect how voice-activated search impacts search behavior, ranking signals, and optimization strategies. Voice Search SEO stats include metrics on smart speaker usage, mobile voice assistants, long-tail keyword patterns, and the effect of conversational queries on featured snippets, local SEO, and zero-click results.
The most important voice search SEO statistics are below.
- 20.5% of the global population uses voice search, according to Yaguara. One in five people interacts with voice-enabled technology during search.
- 8.4 billion voice assistants operate globally, as reported by Yaguara. This number exceeds the total world population.
- 27% of online users rely on mobile voice search, according to Think with Google. Mobile voice behavior dominates everyday search activity.
- 58% of consumers searched for local business information using voice in the past year, as reported by BrightLocal. Voice SEO drives intent-heavy local discovery.
- 46% of voice users search for local businesses daily, according to BrightLocal. High-frequency voice habits influence local ranking visibility.
- Voice queries include three times more local intent than text-based searches, as reported by Meeker in the Internet Trends Report. Conversational phrasing benefits local optimization.
- 57% of users interact with voice commands daily, according to NPR and Edison Research. Frequent voice engagement increases demand for structured responses.

- 40.7% of voice search results come from featured snippets, according to Backlinko. Featured snippet optimization improves voice result appearance.
- Voice search result pages load in 4.6 seconds on average, as found by Backlinko.
- Pages that appear in voice search contain an average of 2,312 words, according to Backlinko. Detailed and structured content performs better in voice SERPs.
- The average voice search result contains only 29 words, as reported by Backlinko. Concise answers are favored in voice search results.
- Websites with high domain and link authority tend to rank best in voice search, according to Backlinko. Strong authority signals enhance voice search performance.
- Content that has been highly shared ranks well in Google voice search; the average result has 1,199 Facebook shares and 44 Tweets, as found by Backlinko. Social sharing correlates with voice search visibility.
- The average voice search result is written in natural language and is easy to understand, typically at a 9th-grade reading level, according to Backlinko. Readable content aligns with voice search preferences.
- Dentists are the top business group optimized for voice search, as reported by Search Engine Watch. Certain industries lead in voice search optimization.
- Consumer protection agencies are the group least optimized for voice search, according to Search Engine Watch. Some sectors lag in voice search readiness.
- Asking questions without typing is one of the top three reasons consumers purchased a smart speaker, as found by Edison Research. Ease of use drives smart speaker adoption.
- The top three devices where consumers use their voice assistants are smartphones (56%), smart speakers (35%), and TVs (34%), according to Edison Research. Multiple devices facilitate voice assistant usage.
- Smart speaker owners typically request nearly 11 different tasks via voice each week, as reported by Edison Research. Diverse functionalities encourage frequent voice interactions.
- 34% of Americans own a voice-activated smart speaker, according to Edison Research. Smart speaker ownership continues to rise.
What are the Backlink and Link Building Statistics?
Backlink and link building statistics reveal the continued importance of external signals for SEO. Link building statistics demonstrate how link acquisition impacts rankings.
The most important backlink and link-building statistics are below.
- Backlinks are among Google’s top three ranking factors, as stated by Search Engine Land. High-quality backlinks directly affect search engine rankings.
- 93.8% of link builders prioritize link quality over quantity, according to Authority Hacker. High-quality backlinks significantly influence search rankings.
- Only 2.2% of content receives links from more than one site, as reported by Backlinko. The majority of online content lacks substantial backlink profiles.
- 94% of online content does not receive any external links, according to Backlinko.
- 52.3% of digital marketers consider link building the most challenging aspect of SEO, as reported by Authority Hacker.
- The number of backlinks a webpage has correlates directly with the amount of organic traffic it receives, according to Ahrefs.
- Pages with 100+ backlinks receive 3.2x more traffic based on Ahrefs’ analysis of 1 billion pages in 2024.
- The top-ranking page on Google has an average of 3.8 times more backlinks than pages ranked 2-10, as reported by Backlinko.
- Guest posting or guest blogging is one of the most popular link-building tactics, used by 64.9% of link builders, according to Authority Hacker. The guest blogging method remains a staple in acquiring backlinks.
- 51.6% of link builders engage in link exchanges as part of their strategy, according to Authority Hacker. Reciprocal linking continues to be a common practice.
- Only 17.7% of link builders use digital PR to acquire links, as reported by Authority Hacker. Despite its potential, digital PR remains underutilized.
- Long-form content generates 77.2% more links than shorter articles, according to Backlinko. Comprehensive content attracts more backlinks.
- “Why” posts, “What” posts, and infographics receive 25.8% more links compared to videos and “How-to” posts, as reported by Backlinko.
- The average cost of a paid link is $83, according to Authority Hacker. Investing in backlinks requires budget allocation.
- In-house SEOs pay 75% more for links than niche site owners, as reported by Authority Hacker. Internal teams often face higher link acquisition costs.
- Experienced SEO professionals pay an average of 221% more per link, according to Authority Hacker. Expertise in SEO correlates with higher investment in quality links.
- Paying for links yields only an extra two links per month compared to those who don’t pay, as reported by Authority Hacker.
- 78.1% of SEOs see satisfying ROI from their link-building efforts, according to Authority Hacker.
- Search Atlas found that Domain Power correlates more strongly with organic rankings than DA, DR, or TF, according to a large-scale correlation study. Performance-based signals like Domain Power align better with top-ranking pages.
What Are the Google Search Statistics?
Google Search statistics refer to verified numerical insights that measure how users interact with Google Search. Google Search statistics include search volume, usage frequency, market share, user behavior, and query patterns.
Users frequently ask questions like “how many searches on Google per day?” and look for Google SEO statistics to guide content strategies and visibility goals.
The top Google search statistics you need to know are below.
- Google processes approximately 13.7 billion searches per day as of 2025, according to DemandSage. This volume translates to over 5 trillion searches per year.

- Google handles around 158,500 searches per second.
- The average Google search session lasts 1 minute based on Backlinko’s 2024 user behavior study. Users find information quickly through search.
- Approximately 5.01 billion people use Google globally, as reported by DemandSage.
- Google holds a 90.14% share of the global search engine market.
- Google accounted for 86.71% of the search market in In April 2025 in the United States, according to Statista data.
- Google commands over 93.9% of the global mobile search market, as reported by StatCounter.
- An average internet user conducts 3 to 4 searches on Google daily, according to DemandSage. This frequent usage illustrates the platform’s role in users’ daily information-seeking behavior.
- 75% of users do not scroll past the first page of search results.
- The top-ranking search result on Google has an average click-through rate (CTR) of 9.28%, according to Semrush. This statistic highlights the value of securing the top position in search results.
- Long-tail keywords receive 1.76 times more clicks in organic search results, as reported by Backlinko.
- Google organic search is responsible for 57.8% of the world’s web traffic, as reported by SparkToro.
- Only 5.7% of pages rank in the top 10 search results within a year of publication, as reported by Ahrefs. This indicates the time and effort required for new content to achieve high search rankings.
- The average top-ranking page ranks in the top 10 search results for nearly 1,000 other relevant keywords, according to Ahrefs.
- 89% of URLs and 37% of URLs in positions 1-20 rank differently on desktop and mobile, as reported by Semrush. Device-based ranking variance shapes technical SEO tactics.
- 54% of marketers believe users search more frequently after AI Overviews launched, according to HubSpot Blog Research. Generative search interfaces influence query volume and content competition.
- 41% of marketers report higher website traffic after LLMs entered the search experience, according to HubSpot Blog Research. AI adoption shifts KPIs toward information gain and brand interaction.
What Are the Google SERP Statistics?
Google SERP Statistics refer to verified metrics that describe how users interact with search engine results pages on Google. SERP (Search Engine Results Page) statistics include click-through rates (CTR), zero-click behaviors, featured snippet performance, and the visibility of SERP features like AI Overviews and People Also Ask boxes.
The most important Google SERP stats are below.
- SERP features appear in 97% of searches according to Moz’s 2024 SERP analysis. Traditional blue links are increasingly rare.
- Featured snippets appear for 19% of search queries, while 7.3% of SERPs use double featured snippets, based on My Codeless Website data.
- People Also Ask (PAA) boxes appear in about 75% of mobile and desktop searches, as reported by Briskon. People Also Ask (PAA) feature keeps users engaged on Google by offering related questions and answers.
- The introduction of AI Overviews has led to a decrease in CTR for first-position results, dropping from 7.3% in March 2024 to 2.6% in March 2025, according to Ahrefs. This significant decline suggests that AI-generated summaries are diverting clicks away from traditional organic listings.
- Keywords ranking outside the top three positions experienced a 27.04% average decline in CTR, as reported by Ahrefs.
- The top organic result on Google has an average CTR of 39.8%, according to data from FirstPageSage. This high CTR underscores the importance of ranking first in search results.
- The second and third positions have average CTRs of 18.7% and 10.2%, respectively, as reported by FirstPageSage.
- Featured snippets capture approximately 67% of clicks, according to AdLift’s research. This indicates the effectiveness of featured snippets in attracting user attention and clicks.
What are the Content SEO Statistics?
Content SEO statistics refer to data-driven insights that quantify how written, visual, and multimedia content influences search rankings, visibility, traffic, and engagement. Content SEO stats demonstrate how SEO content structure, length, freshness, keyword targeting, and AI usage impact performance in Google.
The top content SEO statistics are listed below.
- Pages ranking in the top 10 results on Google contain 1,447 words on average, based on a Backlinko content analysis. Word count correlates with topical depth and semantic coverage.
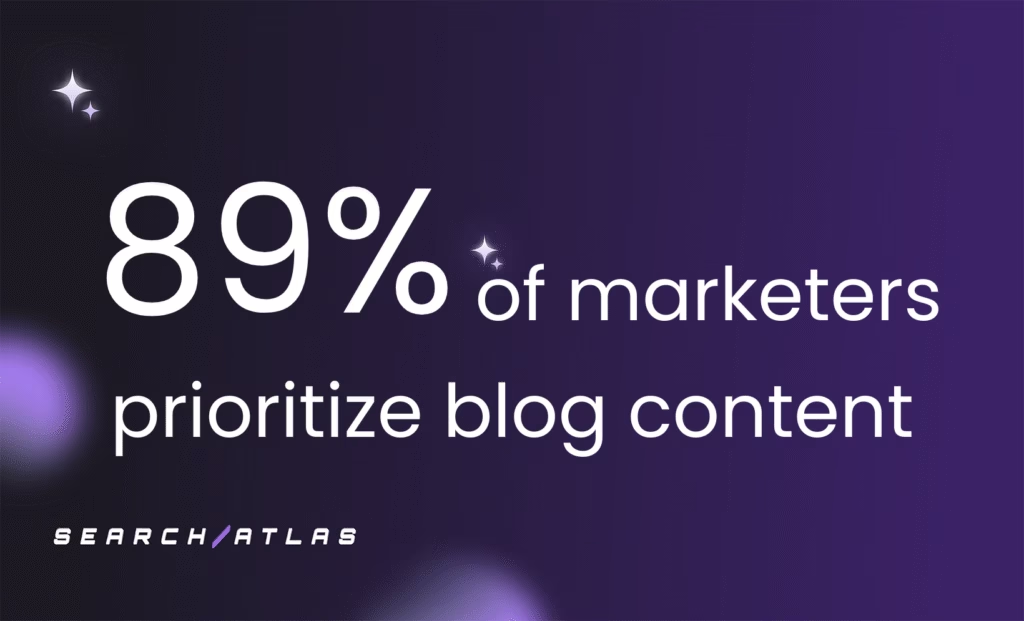
- 89% of marketers prioritize blog content in their SEO strategy, according to Siege Media.
- 79% of marketers operate an active blog, based on Content Marketing Institute data. Blog ownership aligns with SEO control and ongoing topical relevance.
- Blogging produces results for 80% of marketers, according to Orbit Media’s latest findings. Educational and list-style posts perform best in content-driven SEO strategies.
- Content with 3000+ words gets 3x more traffic according to Semrush’s content study. Comprehensive content performs better.
- Refreshing old blog posts can increase traffic by 106% based on HubSpot’s historical optimization study. Content freshness drives growth.
- Most bloggers publish list-style articles, based on Orbit Media’s 2024 survey. List formatting improves scanability and SERP engagement.
- List posts get 80% more traffic than other formats, according to Semrush’s 2024 content format analysis.
- Blog posts with images get 94% more views based on Jeff Bullas’ 2024 content statistics. Visual elements improve engagement.
- Top-performing blog posts include 5.7 images on average, according to Venngage’s visual content study.
- The average top-ranking page is 2+ years old according to Ahrefs. Established content maintains rankings.
- 76% of businesses report their AI-generated content has ranked at least once, based on Semrush’s AI content performance data. Optimized AI-assisted writing can meet ranking thresholds.
- Most SEO professionals say content creation is the most difficult part of their work, according to Search Engine Journal.
- Businesses that publish 16+ blog posts per month generate 4.5x more leads, according to DemandSage. Publishing frequency strengthens keyword footprint and discoverability.
- 77% of bloggers publish educational content, according to Orbit Media. Informational intent performs best for organic discovery and authority signals.
- 76% of marketers use blog posts to generate leads, as reported by DemandSage. Blog content supports mid-funnel engagement and keyword-to-conversion alignment.
- Almost 50% of buyers consult company blogs during purchase decisions, according to HubSpot’s behavior research. Blog visibility supports trust and consideration-stage SEO.
- Blog posts shared on social media generate 22% more backlinks, based on Semrush’s content promotion analysis. Distribution efforts amplify SEO impact through secondary signals.
What are the Social Media SEO Statistics?
Social media SEO statistics measure how social platforms influence organic search visibility, user discovery, traffic referrals, and content indexing. Social media SEO data points reveal the relationship between search engines and social media marketing across content types, platforms, and user behavior.
The top social media SEO stats are below.
- 63.9% of the global population uses social media as of early 2025, according to Smart Insights. Social platforms now drive discovery and visibility for brands across search channels.
- Reddit’s traffic from Google increased by 39% year-over-year, based on Business Insider’s 2024 report. Community content influences rankings as Google surfaces more forum-based results.
- Facebook accounts for 3.62% of all referral traffic to websites in the U.S., according to Exploding Topics.
- 50% of consumers discover new products on social media, as reported by Exploding Topics. Discovery behavior shifts from Google to platform-native search and feeds.
- 43% of users rely on social media platforms to find products, according to Sprinklr. Social platforms now compete with search engines for commercial intent queries.
- Instagram profiles with keywords in bios and captions improve in-app search visibility, according to Marketing Insider Group. Optimization within social platforms supports branded search and content visibility.
- Reddit, YouTube, and Facebook drive more SEO-related traffic than LinkedIn or Instagram, based on Exploding Topics. Traffic value varies by platform structure and content type.
- The average user engages with 6.83 social platforms per month, according to Sprout Social. Multi-platform distribution amplifies content reach and branded query volume.
- User-generated content increases conversions by 85% compared to branded content, according to Wikipedia’s UGC overview.
- 91% of marketers use video content in their strategy, Wyzowl reports. Video boosts visibility across Google SERPs, YouTube, TikTok, and Instagram Reels.
What Are the SEO Statistics By Industry?
SEO statistics by industry reveal how different sectors approach and benefit from search optimization. These SEO statistics demonstrate industry-specific SEO trends.
The most important SEO statistics by industry are listed below.
- B2B companies generate 2x more revenue from organic search than B2C. B2B SEO delivers higher ROI.
- 50% of B2B marketers say SEO drives more leads than any other marketing strategy, according to BrightEdge. Organic visibility remains the primary acquisition channel in B2B digital funnels.
- 81% of B2B companies expect to spend at least $7,500 per month on SEO, according to RevenueZen.
- SEO delivers a 702% ROI for B2B SaaS companies, with a breakeven period of 7 months, according to Mailmodo.
- 91% of SaaS marketers report that SEO improves overall website performance, as reported by Mailmodo. SEO for SaaS helps teams scale acquisition and reduce paid ad dependence.
- 66% of SaaS buyers begin product discovery on Google, according to Mailmodo.
- 79% of law firms say SEO is the most effective channel for client acquisition, based on Law Firm Marketing Pros. Legal clients rely heavily on organic search during urgent decision-making moments.
- 66% of calls to law firms originate from organic search, as reported by Nifty Marketing. Local SEO and review visibility play a central role in law firm SEO and legal lead generation.
- Law firms that blog regularly get 434% more indexed pages, according to Juris Digital.
- 81% of law firms claim content marketing is their top marketing investment, based on Grow Legal firm data.
- 77% of patients use search engines before scheduling a medical appointment, according to Growtha. SEO influences patient trust, provider selection, and clinic discovery.
- 62% of patients check online reviews before contacting a healthcare provider, as reported by Growtha. Review SEO and reputation optimization are essential in healthcare SEO.
- 80% of patients search for symptoms or conditions before visiting a provider, according to Growtha.
- 70% of nonprofits say SEO helps increase awareness and donor acquisition, based on NP Source. Educational and purpose-driven content improves engagement in organic search.
- 63% of financial service companies plan to increase SEO budgets in 2025, as reported by Search Engine Journal. High competition and trust-based decision making drive organic investment.
What are the SEO Statistics by Country?
SEO statistics by country reflect how search behavior, platform usage, and digital marketing priorities vary across global regions. Each market presents unique opportunities for organic growth, influenced by language, device usage, and local competition.
The top SEO statistics by country are below.
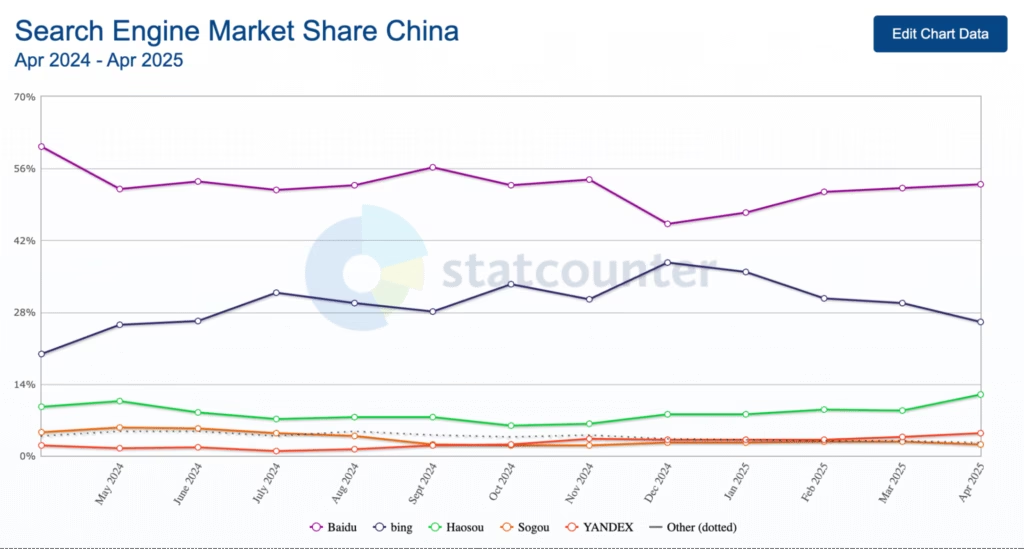
- China’s SEO software market generated $5.9 billion in revenue in 2024 and is expected to reach $14.2 billion by 2030, growing at a CAGR of 16.3%, according to StatCounter.
- Baidu is the leading search engine in China, with Google having a minimal presence due to regulatory restrictions
- The SEO industry in the United States will grow from $90.35 billion in 2024 to $106.9 billion in 2025, according to The Business Research Company. U.S. businesses increasingly invest in organic growth over paid ads.
- Google owns over 90% of the U.S. search engine market, based on Alphametic’s 2024 data. SEO optimization for Google remains the dominant search priority.
- 93% of online experiences in Canada begin with a search engine, according to Statista. Google holds over 92% market share, which makes SEO a priority for Canadian businesses.
- Google commands more than 92% of Canada’s search engine market, according to Statista
- Australian businesses are projected to spend $1.5 billion on SEO services in 2025, which is up 12% from 2024, based on Local Digital data.
- 68% of website traffic in Australia comes from organic search.
- 74% of businesses in Australia possess a documented strategy for content marketing, according to Local Digital. Companies that have a clear content strategy experience a 3x higher ROI than those that don’t.
- 62% of marketers in Australia regard blogs and articles as the most effective type of content.
- 60% of UK businesses use SEO as a marketing strategy, according to LocaliQ. 90% of those believe their SEO strategy is effective.
- Germany’s SEO software market will reach $9.8 billion by 2030, according to Grand View Research. Growth stems from multilingual content needs and EU privacy regulations.
- Google holds 87.03% search engine market share in Germany, based on Statista’s global data. German SEO strategy emphasizes compliance and content relevance.
- India will reach $8.1 billion in SEO market size by 2030, as projected by Grand View Research.
- 91% of Indian users access search engines via mobile devices, according to DataReportal. Mobile-first indexing and voice search optimization drive SEO performance in India.
- Google owns over 95% of India’s search market, according to Alphametic. Indian search behavior favors long-tail and voice queries.
- Japan recorded 80.48% market share for Google in April 2025, according to StatCounter. Yahoo! and Bing follow with single-digit shares.
- 84% of Japanese SEO traffic comes from long-tail keywords, as reported by Nikkei Tech. High-context language and specific intent queries dominate Japan’s SEO.
What Are the SEO Market Statistics?
SEO market statistics refer to data that quantifies the size, growth rate, revenue, investment, and adoption trends in the SEO industry. The SEO market statistics demonstrate the economic impact of SEO services and technology.
The latest SEO market statistics are listed below.
- The global SEO market is projected to reach $194.6 billion by 2029, up from $90.35 billion in 2024, according to Precedence Research.
- The U.S. SEO industry grew 23.2% annually between 2019 and 2024, based on IBISWorld’s industry report. This makes it one of the fastest-growing segments in the digital services economy.
- The U.K. SEO industry expanded at a CAGR of 7.2% from 2019 to 2024, according to IBISWorld U.K.
- The average SEO agency retainer ranges from $2,500 to $5,000 per month, as reported by Artios. High-impact campaigns with link building and content optimization command premium pricing.
- 40% of U.S. and Canadian SEO agencies charge more than $125/hour, while only 6% of European agencies do, according to SE Ranking’s global pricing report. Pricing varies widely by region and service depth.
- Hiring in-house SEO teams costs up to 40% more than working with agencies, based on Victorious SEO’s 2024 cost comparison. Agencies offer lower overhead and broader expertise for many businesses.
- 83% of companies plan to increase their SEO budget in the future, according to Gartner’s CMO Spend Survey. As PPC costs rise, long-term SEO investments show higher ROI.
What Are SEO Statistics (Stats)?
SEO statistics (SEO stats), often referred to as SEO facts are numerical insights and data points that measure how search engine optimization impacts visibility, traffic, and business performance on digital platforms. SEO stats include keyword behavior, ranking trends, algorithm shifts, content performance, user intent metrics, and budget allocations across industries. SEO data helps marketers validate strategies, benchmark performance, and identify search trends that influence ranking outcomes.
SEO facts (or statistics) give businesses the SEO numbers they need to refine strategies, prioritize optimizations, and measure ROI.
What Is the Importance of SEO Statistics?
The importance of SEO statistics is that statistics explain why SEO works. Website SEO statistics reveal the strategic impact of search optimization on traffic growth, lead quality, and cost efficiency. SEO insights help marketers understand the benefits of SEO statistics in real-world outcomes such as higher conversion rates and lower acquisition costs.
Facts about SEO show how data shapes decision-making across every SEO role. Strategists use SEO numbers to justify budget increases. Content teams improve targeting based on keyword volume and click-through rates. Analysts track performance trends to adjust tactics. Without SEO data, businesses rely on assumptions.
What Is the Relation Between SEO Statistics (Facts) and Digital Marketing Statistics?
SEO statistics (facts) are a subset of digital marketing statistics. Digital marketing statistics cover a wide range of channels including email, social media, SEM statistics, and display ads. SEO data specifically measures organic visibility, keyword performance, and content engagement through search engines.
SEM statistics combine SEO and paid search performance into one metric set. While SEO statistics track organic reach, SEM metrics add paid traffic outcomes. Marketers use digital marketing statistics to allocate budgets, compare channel ROI, and align content strategy across all marketing efforts.
What Is the Relation Between SEO Statistics and PPC Statistics?
SEO and PPC statistics serve complementary roles in performance marketing. SEO statistics measure organic growth, long-term ROI, and SERP visibility, while PPC statistics measure paid traffic, cost-per-click, and ad-driven conversions.
SEO and PPC statistics support integrated search strategies. Brands use SEO and PPC statistics together to test keyword demand, dominate SERP real estate, and optimize for both immediate results and sustainable growth.


 Allan F.


