

Web page performance tools measure how fast, stable, and responsive your site is. They directly impact user experience, SEO rankings, and revenue. These tools identify what slows your site down, unoptimized code, heavy assets, or layout shifts, and offer fixes to improve speed and usability.
The best tools provide actionable insights, real-time monitoring, and automation. In this guide, we compare the top performance tools of 2025 so you can choose one that turns speed into a business advantage.
Let’s cut the lag and level up your site speed 🚀
What Is Web Page Performance?
Web page performance measures how quickly a website loads and how efficiently it responds to user interactions. Web page performance impacts user experience, search engine rankings, and conversion rates. Fast, responsive pages keep users engaged and reduce bounce rates. Slow-loading pages lose traffic, credibility, and revenue.
There are several key metrics that define web page performance. The several key metrics that define web page performance are listed below.
Page Load Time
This metric tracks how long it takes a full web page to load after someone clicks on a link. From the first request to the final image or script, every second counts. A delay in page load feels like a lifetime to users and tanks SEO performance.
There are two main speed bumps.The main two speed bumps are below.
- Network and Server Time: Think slow internet or a laggy host.
- Browser Time: This is how long the browser takes to interpret and display the page.
Time to First Byte (TTFB)
TTFB tracks how long it takes for the first piece of content to hit your browser after requesting a page. It includes:
- DNS lookup
- TLS handshake
- SSL connection
- Server acknowledgment
This metric reveals how responsive your server is. Measured in milliseconds, TTFB plays a big role in how fast your page starts showing up.
Render Start Time
Render Start Time is all about the first impression. It measures how soon anything appears on your screen. Whether it’s a banner, button, or image, early feedback keeps users calm and curious.
Long blank pages trigger back buttons. Quick renders boost trust.
Speed Index
Speed Index zooms out and looks at how fast above-the-fold content—the stuff users see without scrolling—visibly loads.
It’s a powerful measure because it tracks how users experience your page load in real time. Google’s Lighthouse tool calculates this using multiple variables:
- First Contentful Paint (FCP): When the first image or text shows up
- Time to Interactive: When the page responds to clicks
- Server Response Time: How long the server takes to answer
- Largest Contentful Paint (LCP): When the biggest image or block of text loads
- Network Latency: How fast data travels from server to browser
- Speed Index Value: How quickly the page fills visually
To put it in perspective, Google.com clocked in with a blazing-fast Speed Index of 0.99 in 2023—loading in just 0.77 seconds. Compare that to Apple’s 1.32 seconds and you’ll see why Google wears the speed crown.
Why Is Website Performance Monitoring Important?
Website performance monitoring tracks how fast your site loads and how reliably it responds to users. Website performance monitoring directly affects user experience, search rankings, and revenue. Fast-loading sites keep users engaged and convert better. Slow sites lose traffic, frustrate visitors, and fall behind in search results.
Sites that take 3 seconds to load see 50% more bounces and 22% fewer conversions than those that load in 1 second. Even a 1-second delay cuts customer satisfaction by 16%. During high traffic, 75% of users switch to faster competitors.
Google prioritizes speed in its rankings. Faster websites rank higher, retain users longer, and drive more sales. Before focusing on design or content, ensure your site performs at peak speed.
What to Look For in Web Page Performance Tools?
Look for a performance tool that doesn’t just report numbers but helps improve them. The performance tool explains what’s slowing your site down, why it matters, and how to fix it. Speed impacts everything: user experience, SEO rankings, and conversions. The right tool gives clarity, not confusion.
Look for one that tracks the metrics that matter: Core Web Vitals like Largest Contentful Paint (LCP), Interaction to Next Paint (INP), and Cumulative Layout Shift (CLS); load metrics like First Contentful Paint (FCP), Time to First Byte (TTFB), and Total Blocking Time (TBT); Speed Index for visible content; and detailed resource requests. These expose real problems and their impact on user experience.
Choose tools that provide actionable insights. Visual dashboards, issue breakdowns, and clear solutions save time and eliminate guesswork. Tools that support one-click fixes or automation give an edge.
Real User Monitoring (RUM) is essential. It captures actual user behavior across devices, locations, and network speeds. Journey testing highlights where performance issues affect revenue-critical flows like checkout or signup.
Synthetic monitoring adds control. It replicates load conditions, sets baselines, and reveals hidden issues without relying on user traffic.
A solid tool fits your workflow. It integrates with your CMS, analytics, and dev pipeline. Whether free or enterprise-level, it must deliver value with clear pricing, real results, and measurable ROI.
9 User-Friendly Web Page Performance Tools for Website Optimization
Slow sites frustrate users and kill conversions, but most teams don’t realize where the real bottlenecks hide. Here are some tools that go beyond surface-level scores to reveal critical issues with load time, interactivity, and page structure—so you fix what actually matters.
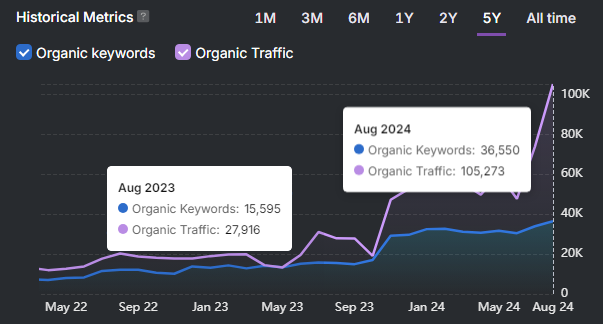
1. Search Atlas
Search Atlas is an all-in-one SEO and performance optimization platform built to enhance website speed, stability, and technical health at scale. Search Atlas delivers deep diagnostics and real-time solutions, helping websites load faster, rank higher, and convert better. In a digital landscape where milliseconds matter, Search Atlas offers the clarity and automation needed to keep performance sharp.
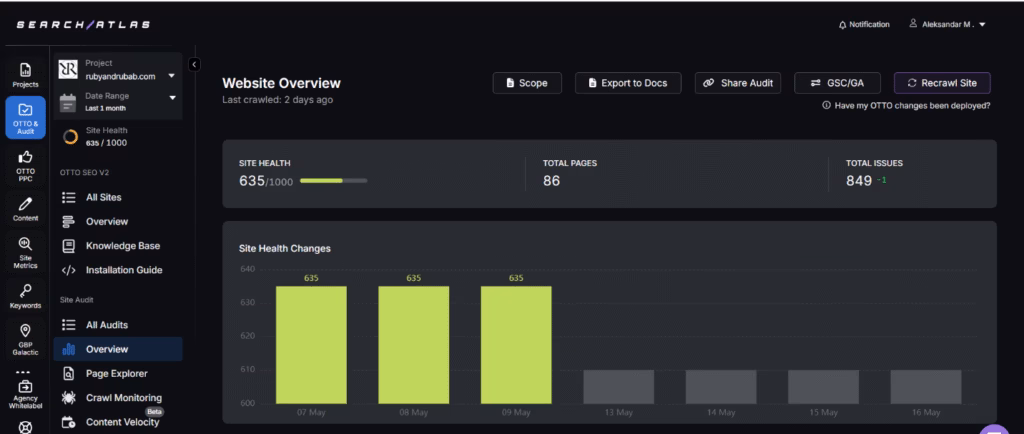
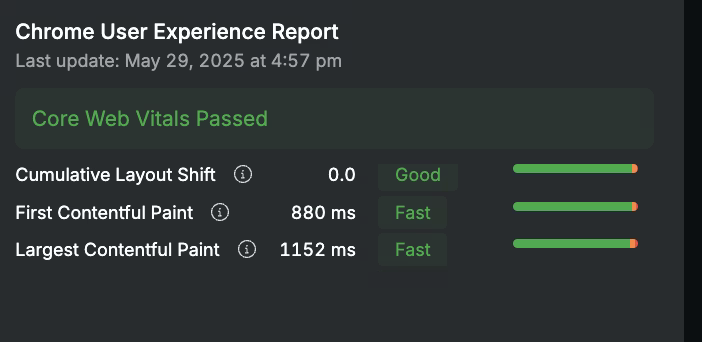
Search Atlas’s Site Auditor offers in-depth web page performance analysis by scanning your entire site for speed, stability, and technical health. It evaluates key performance indicators like Core Web Vitals, including Largest Contentful Paint (LCP), Interaction to Next Paint (INP), and Cumulative Layout Shift (CLS), to assess how real users experience your pages.
The tool goes beyond basic metrics, analyzing issues like slow-loading scripts, broken links, oversized images, and poor mobile responsiveness. It assigns a Website Health Score, highlighting both critical and moderate issues that affect speed, SEO, and user experience.
All insights are actionable, with OTTO SEO available to fix many problems automatically—so you’re not just diagnosing, you’re improving performance in real time.
Popular Features
- Site Auditor: Scan your entire site for performance drags—like slow-loading assets, redirect chains, broken links, crawl traps, and indexation issues.
- Core Web Vitals Insights: Identify and improve metrics like LCP, INP, and CLS across multiple devices.
- OnPage Audit: Uncover technical errors at the page level, including server delays, bloated scripts, unminified CSS, and layout shifts.
- Device-Specific Audits: Compare performance between mobile and desktop to address mobile-first ranking factors.
- AI Fix Automation (OTTO): Repair issues like broken redirects, metadata errors, and site structure problems with one-click AI-generated fixes.
- Site Visualization: Map internal link structures to uncover crawl bottlenecks and orphaned content.
- Schema Builder: Add structured data using pre-built templates without slowing down your site or bloating your code.
- Real-Time Alerts: Monitor site health and get instant alerts for speed, uptime, and Core Web Vitals changes.
Limitations
- The platform offers deep functionality, which may feel advanced to new users.
- Automated fixes work best when paired with occasional manual review on complex or custom setups.
Pricing
- Starter. $99/month – 1 OTTO activation, 5 GSC site projects, 2 user seats, 5 Site Auditor projects, 50,000 pages crawled per month, no real-time site monitoring.
- Growth. $199/month – 1 OTTO activation, 15 GSC site projects, 3 user seats, 10 Site Auditor projects, 100,000 pages crawled per month, includes real-time site monitoring.
- Pro. $399/month – 3 OTTO activations, unlimited GSC site projects, 5 user seats, 100 Site Auditor projects, unlimited pages crawled per month, includes real-time site monitoring
Search Atlas Reviews
G2: 4.8/5
Capterra: 5/5
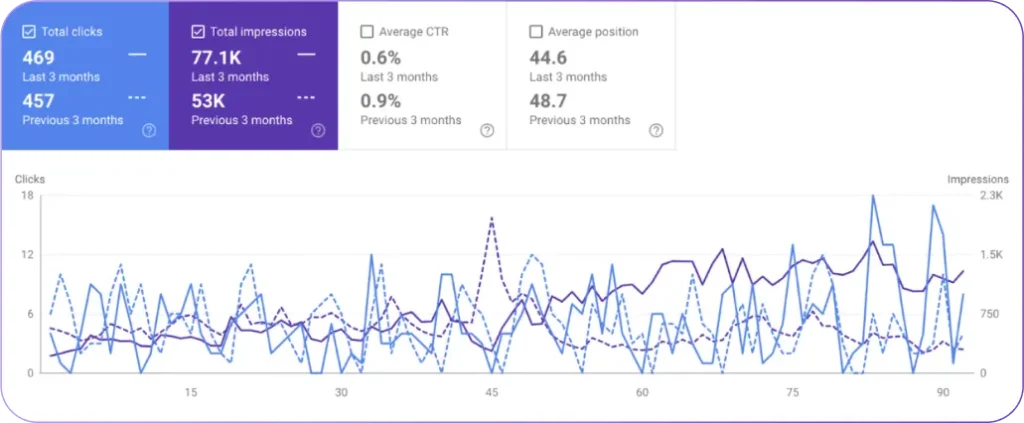
2. Google PageSpeed Insights
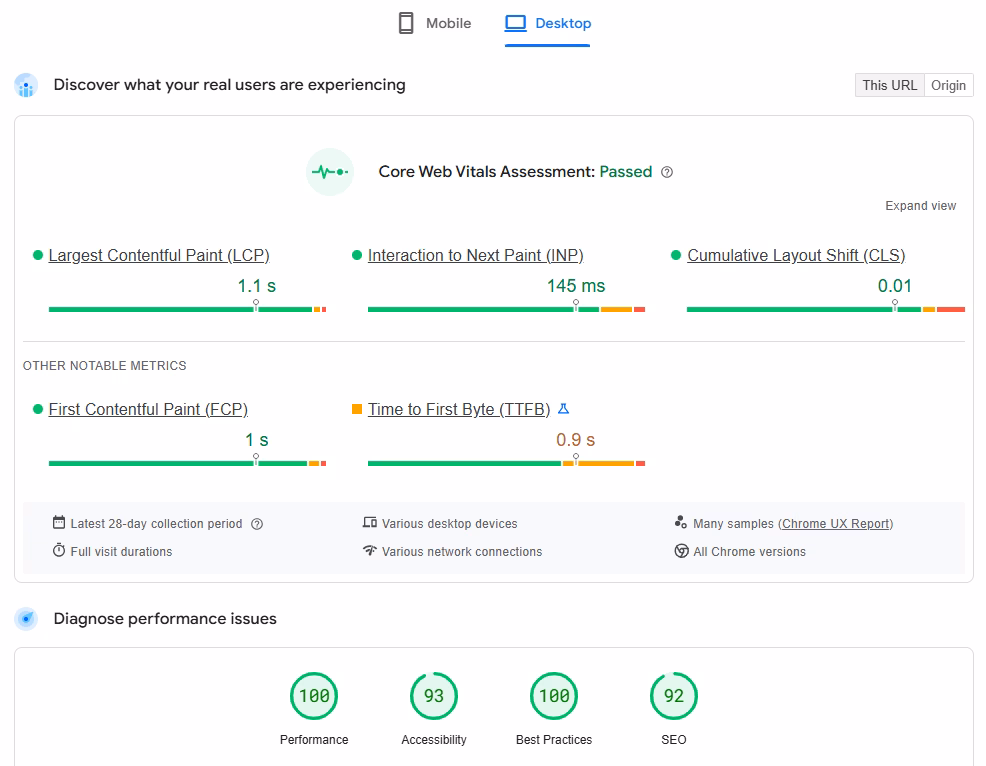
Google PageSpeed Insights analyzes how well a website performs on both desktop and mobile. It breaks down loading speed and interactivity using data tied to user experience, then offers targeted recommendations for fixing what’s slowing your site down.
Unlike other tools that just show surface-level issues, PageSpeed taps directly into Core Web Vitals—the same metrics Google uses to evaluate and rank pages.What makes this tool stand out is its direct alignment with Google’s search performance benchmarks.
You’re not getting a second opinion—you’re seeing exactly what Google notes while determining SERP rankings. The tool evaluates elements like visual stability, interactivity delay, and time to load visible content. The result is a clear, structured performance report with optimization suggestions baked in.
Popular Features
- Core Web Vitals Analysis: Breaks down LCP, CLS, and INP to show how your site performs against Google’s speed and UX benchmarks.
- Mobile and Desktop Reporting: Provides separate audits for mobile and desktop, so you can fine-tune performance for each platform’s unique bottlenecks.
- Performance Scoring (0–100): Gives you a numeric score based on user-centric metrics, making it easy to track improvements over time.
- Actionable Optimization Tips: Flags slow-loading scripts, uncompressed images, and render-blocking resources, then recommends fixes in plain language.
- Field and Lab Data: Combines real-user data with simulated performance tests to provide a balanced view of how your site behaves across different environments.
- Chrome Extension Integration: Lets you test any live page directly from your browser, speeding up workflows for developers and marketers.
Limitations
- Some reviews say the scoring doesn’t always match real-world user experiences.
- The recommendations can be too technical for beginners.
- Has been known to lack contextual advice on how to prioritize fixes.
Pricing
- Free – Full access to all features, mobile and desktop insights, Core Web Vitals data, and improvement suggestions at no cost.
Google PageSpeed Insights reviews
- TrustRadius: 9.1/10
3. GTmetrix
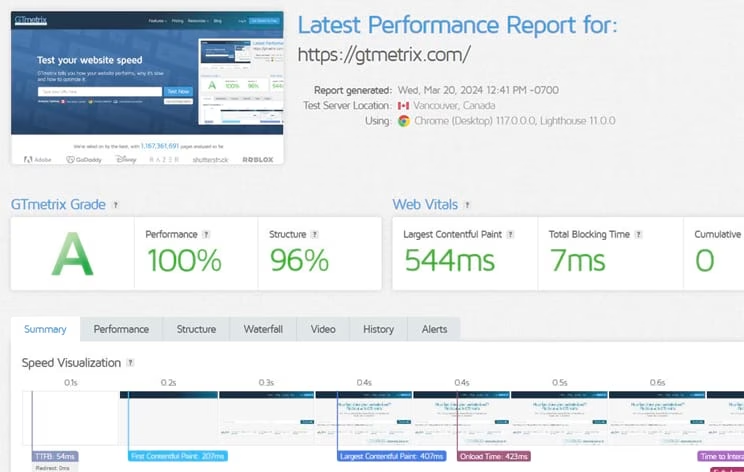
GTmetrix is a diagnostic tool that offers synthetic testing and scheduled monitoring to help developers pinpoint performance bottlenecks and eliminate slowdowns. You get actionable diagnostics to analyze website performance and closely monitor issues like file size bloat and render delays.
This tool uses Lighthouse data and a built-in test infrastructure to simulate real load conditions, depicting how performance shifts across devices, locations, and network speeds. GTmetrix delivers quick fixes by highlighting the files, scripts, and third-party resources causing delays.
GTmetrix stands out with its ability to visualize web page performance. It tracks loading behavior over time, flags unexpected dips, and offers waterfall charts, filmstrips, and video replays that show the exact moment a performance issue hits.
For teams managing large sites or running A/B tests, this level of insight can prove a gamechanger in highlighting what’s helping—or hurting—your speed.
Popular Features
- Performance Analysis: Breaks down key metrics like LCP, CLS, and TBT, offering a full Lighthouse audit to identify delays in rendering and interactivity.
- Waterfall Charts: Visualize how each asset on your site loads, in what order, and how long it takes. Helpful for spotting bloated scripts or render-blocking CSS.
- Scheduled Monitoring: Automatically tests pages hourly, daily, or weekly. Tracks dips in performance with alerting and historical graphs.
- Global and Device Simulations: Run tests from different global locations and simulate various mobile devices and network speeds to get a more realistic view of real-world performance.
- Video and Filmstrip Replay: Watch your page load frame-by-frame to see exactly when and where lag occurs in the user experience.
- Advanced Testing Options: Supports blocked asset testing, custom headers, and logged-in session simulations for deeper debugging.
Limitations
- Some say the interface takes time to navigate, especially when using advanced test settings.
- Some reviews mention that while the data is detailed, the recommendations aren’t always beginner-friendly.
Pricing
- Micro. $4.25/month – 1 monitored slot, 100 monthly on-demand tests, 10 daily API credits, 1 month data retention, 1 team seat, daily test max.
- Solo. $12.33/month – 3 monitored slots, 800 monthly on-demand tests, 25 daily API credits, 6 months data retention, 1 team seat, daily test max.
- Starter. $23.75/month – 6 monitored slots, 900 monthly on-demand tests, 50 daily API credits, 6 months data retention, 1 team seat, daily test max.
- Growth. $47.33/month – 12 monitored slots, 1400 monthly on-demand tests, 100 daily API credits, 6 months data retention, includes higher queue priority, PRO analysis options, premium test locations, white-label PDF reports, and bulk testing support.
GTmetrix Reviews
- G2: 4.6/5
- Capterra: 4.9/5
4. ManageEngine Site24x7
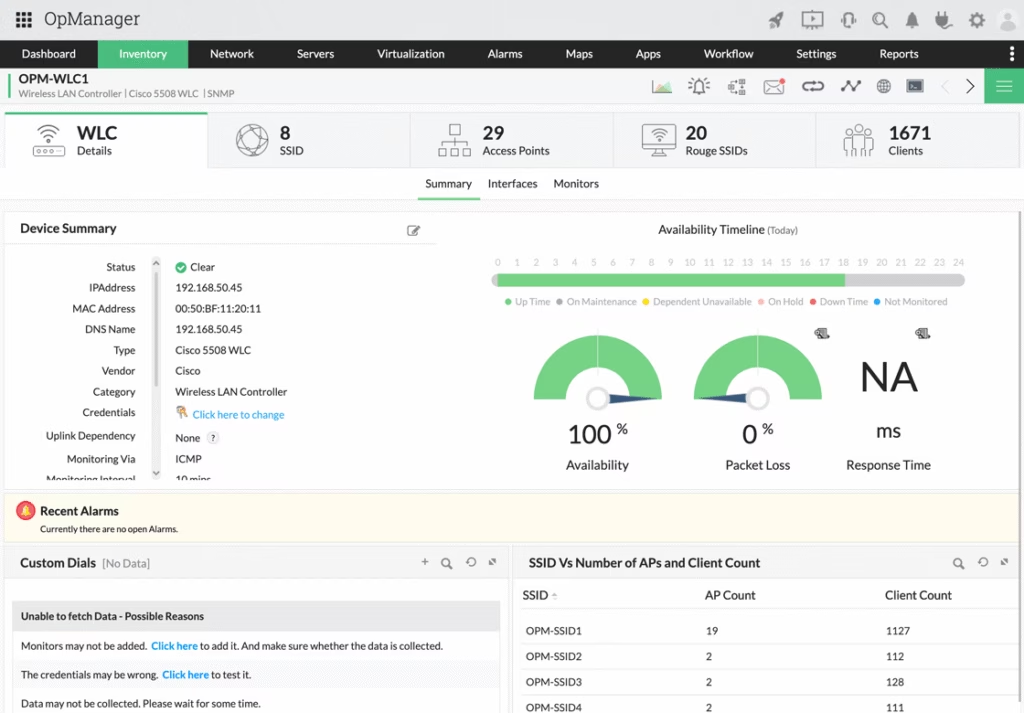
ManageEngine Site24x7 is a website performance monitoring tool that simulates how real users interact with your site by loading it in actual browsers. It allows you to monitor the impact of scripts, third-party services, and page elements in real time.
Waterfall charts break down the load sequence, so you can see exactly what’s slowing the page down and whether those delays come from internal assets or external dependencies.
What sets Site24x7 apart is its full-stack visibility. Unlike tools that monitor one layer, it shows how your servers, APIs, and infrastructure affect page load times. This is especially helpful for businesses running complex sites or apps, where performance issues don’t always start at the surface.
With synthetic transaction monitoring and global testing, Site24x7 helps teams troubleshoot bottlenecks before they impact the user experience—whether those users are in New York or New Delhi.
Popular Features
- Real Browser Testing: Use Firefox rendering to observe how pages load and which scripts slow them down.
- Waterfall Chart Visualization: Analyze resource load sequences to isolate performance bottlenecks across the page.
- Synthetic Transaction Monitoring: Simulate user behavior across key page flows to detect failures before they reach users.
- Global Uptime Monitoring: Check site availability every 30 seconds from 130+ global locations.
- Infrastructure Observability: Monitor Docker, Kubernetes, and cloud resources to spot backend slowdowns that affect front-end speed.
- Third-Party Script Analysis: Detects which external scripts delay page load and impact interactivity
Limitations
- Some users say the interface can feel clunky and slow to navigate.
- Reports mention limited documentation on mobile testing features.
- It has been noted that there is no built-in support for Core Web Vitals.
Pricing
- Professional. $49/month – Includes 1 application, 5 servers, 20 websites, 4 GB log ingestion, 100K page views, third-party integrations, and multi-user support.
- Enterprise. Starts at $625/month – Includes everything in the Professional plan plus anomaly detection, event correlation, infrastructure event management, and network configuration management with firmware vulnerability and compliance tools.
ManageEngine Site24x7 Reviews
- G2: 4.6/5
- Capterra: 4.7/5
5. UptimeRobot
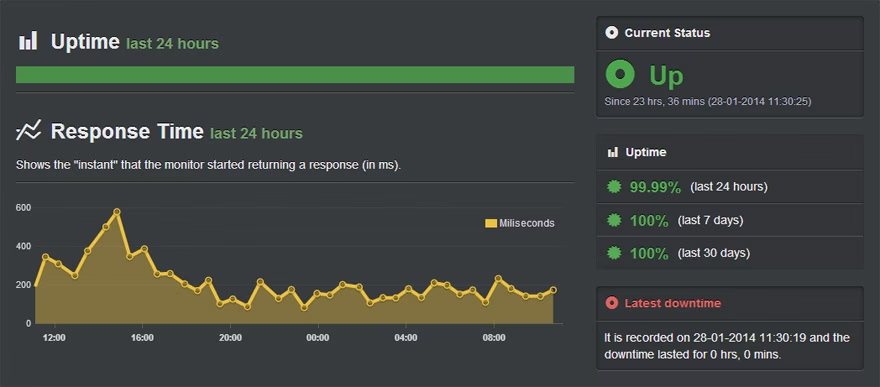
UptimeRobot monitors websites, servers, APIs, and other online assets to detect downtime and alert users immediately. It checks website availability through different monitor types like HTTP(s), ping, port, and keyword.
Businesses use it to minimize disruptions by knowing exactly when a service goes offline and where the issue might be. UptimeRobot stands out for its multi-location checks and public status pages.
These features help teams verify if an outage is local or international SEO, and communicate it clearly to users. For performance-focused businesses, UptimeRobot acts like an always-on checkpoint, ensuring uptime remains consistent and measurable.
Popular Features
- Website Monitoring: Detect outages with checks every 1–5 minutes using HTTP(s), ping, or keyword-based methods.
- SSL Monitoring: Catch SSL certificate issues with alerts 30, 14, and 7 days before expiration.
- Domain Monitoring: Track domain expiration dates to avoid unexpected disruptions.
- Multi-location Checks: Compare results from various geographic servers to spot regional outages or latency.
- Custom Status Pages: Create shareable status pages to inform users during incidents or maintenance.
- Flexible Alerts: Send downtime alerts via Slack, email, webhooks, SMS, or push notifications across devices.
Limitations
- Some users say alert delays can occur during high-traffic outages.
- Lacks deeper diagnostics like Core Web Vitals or full-page load analysis.
- Has been known to require manual verification for false positives.
Pricing
- Free. $0/month – 50 monitors, 5-min interval, HTTP/port/ping/keyword monitors, basic status pages, 5 integrations, no SSL or domain monitoring.
- Solo. $8.70/month – 60-sec interval, all basic monitor types, location-specific checks, SSL/domain monitoring, 9 integrations, basic status pages, alert notifications.
- Team. $34.29/month – 100 monitors, 60-sec interval, all integrations, full-featured status pages, 3 alert seats, 3 login seats.
- Enterprise. $64.54/month – 30-sec interval, all features unlocked, 12 integrations, 5 alert seats, 5 login seats, advanced status pages.
UptimeRobot Reviews
- G2: 4.7/5
- Capterra: 4.8/5
6. Pingdom
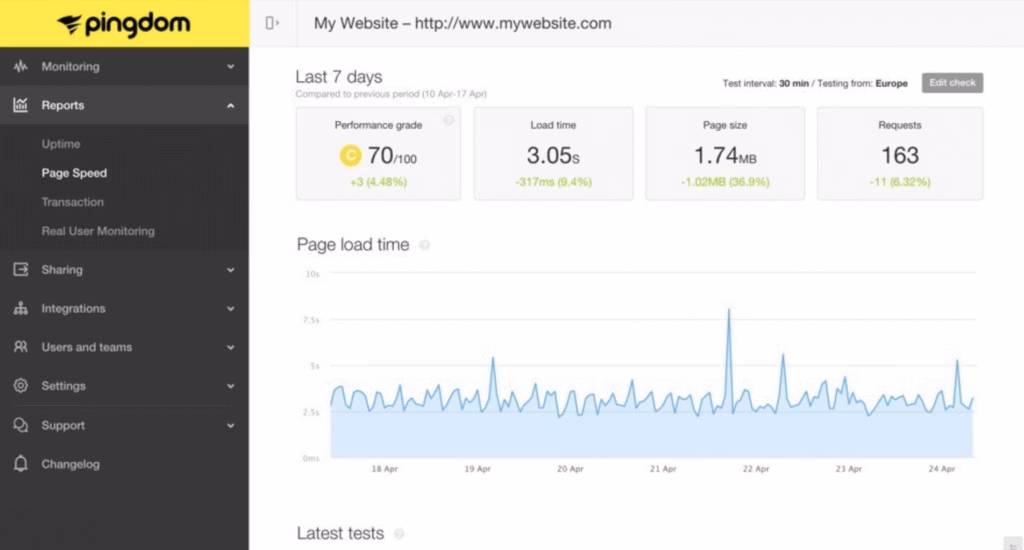
Pingdom is a website monitoring tool focused on uptime, performance, and user experience. It helps businesses understand how their sites behave by combining synthetic monitoring and Real User Monitoring (RUM).
Synthetic tests mimic user actions like sign-ups or checkouts, while RUM shows how real visitors experience page loads, errors, and responsiveness across devices.Pingdom sets itself apart with a dual approach that monitors actual user behavior and runs automated tests from over 100 global locations.
This combination pinpoints issues that affect performance and availability. Teams can receive alerts, analyze trends, and troubleshoot failures before users notice.
Popular features
- Uptime Monitoring: Check site availability every minute from 100+ global locations with instant alerts via SMS or email.
- Synthetic Transactions: Simulate logins or checkouts to verify functionality and catch failed interactions early.
- Real User Monitoring: Track how real visitors experience load times, errors, and interactivity across browsers and devices.
- Page Speed Analysis: Conduct page speed analysis focusing on large assets or slow scripts using synthetic tests and performance grades.
- Root Cause Tools: Use response codes, traceroutes, and load sequence data to isolate and fix failures fast.
- Mobile Monitoring: Get alerts and performance data on the go using native mobile apps for iOS and Android.
Limitations
- The dashboard can feel crowded and hard to use.
- Costs add up fast for larger teams or websites.
Pricing
- Synthetic Monitoring. $10/month – 10 uptime checks, 1 transaction, 50 SMS alerts, page speed, public status pages.
- Real User Monitoring. $10/month – 100,000 pageviews, unlimited sites and users, 13-month data, performance filtering.
Pingdom Reviews
- Capterra: 4.5/5
- TechRadar: 4.8/5
7. New Relic
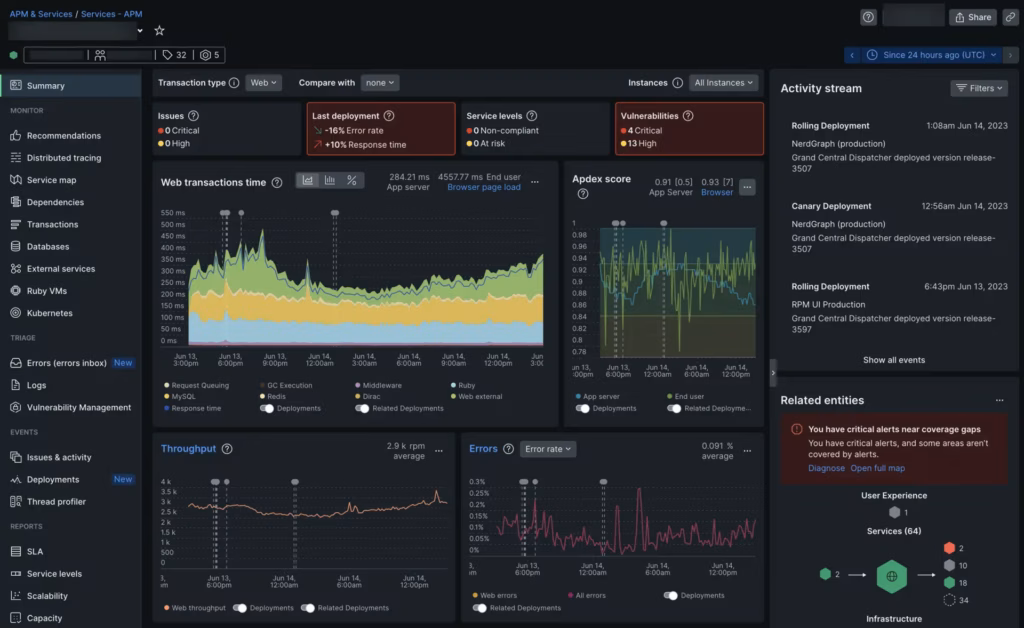
New Relic is a monitoring tool that observes applications, infrastructure, and frontend performance in real time. It provides performance data for servers, APIs, databases, and websites.
New Relic uses real user monitoring, synthetic tests, and transaction traces to analyze website performance and detect issues fast. It shows how visitors use pages and where slowdowns happen. The tool supports cloud and on-prem environments and integrates with major platforms like AWS, Azure, and Kubernetes.
It focuses on improving front-end performance and real user experience and measures how users interact with websites. New Relic finds errors in browser scripts and tracks web vitals. It runs synthetic tests which show how fast pages respond.
New Relic helps teams understand how slowdowns affect actual users. This makes it useful for fixing page speed issues that affect user satisfaction and retention.
Popular Features
- Real User Monitoring: Measure real user experiences and spot performance gaps across different locations and devices.
- Page Load Insights: Identify slow-loading pages and track load times across key performance metrics.
- Synthetic Testing: Simulate user journeys to check site uptime, performance, and transaction reliability.
- JavaScript Error Tracking: Detect front-end issues that interrupt user experience or break website functionality.
- Custom Dashboards: Create dashboards that display vital metrics like load time, bounce rate, or resource usage.
- Alert Configuration: Set alerts for page slowdowns or errors, using email, Slack, or other channels.
Limitations
- Some reviews say the platform becomes complex for new users to set up.
- Has been known to require a learning curve before teams use it efficiently.
- Some say pricing increases quickly as more features or users get added.
Pricing
- Free Plan. $0/month – 100GB data ingest, 1 full user, unlimited basic users, 30+ features, no card needed.
- Standard Plan. Contact sales – 5 full users, SAML SSO, ticketed support, 2-day SLA.
- Pro Plan. Contact sales – unlimited full users, 2-hour critical support SLA, optional usage-based pricing.
- Enterprise Plan. Contact sales – all Pro features, FedRAMP and HIPAA options, 1-hour SLA, priority support.
New Relic Reviews
- G2: 4.4/5
- Capterra: 4.5/5
8. Datadog
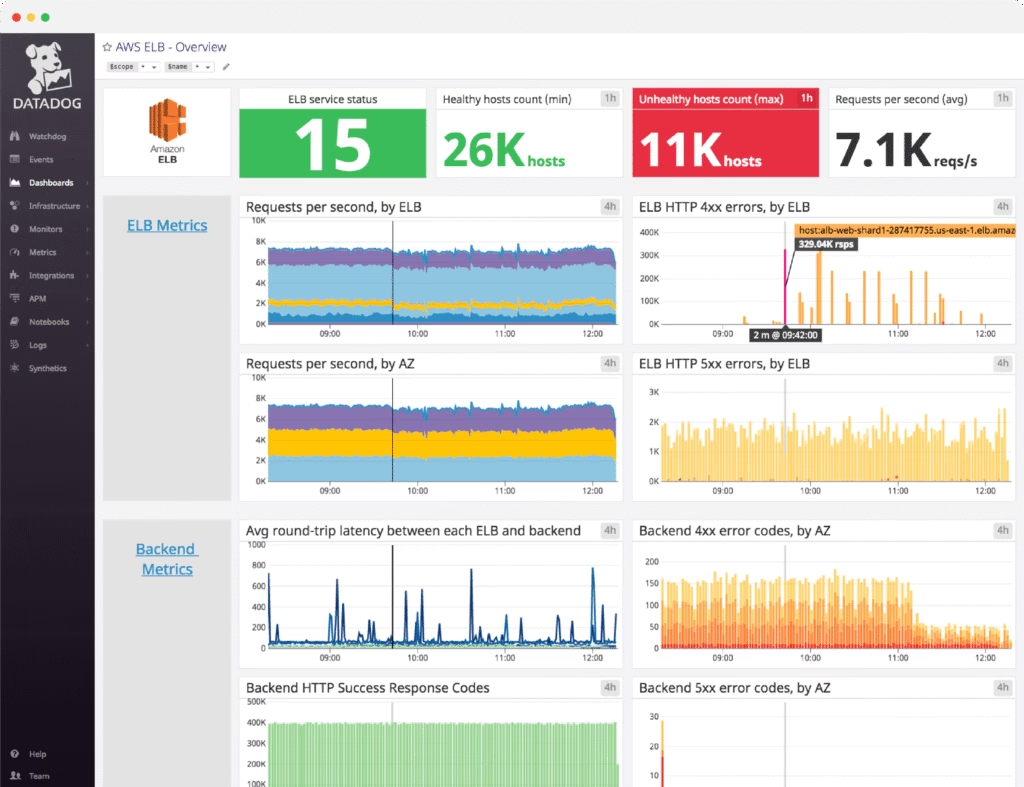
Datadog is a cloud-based platform for monitoring infrastructure, applications, and digital experiences. It provides real-time insights into servers, databases, APIs, and frontend performance. This tool combines log management, performance monitoring, and user behavior analysis into a unified platform.
Focused on end-user experience and frontend performance, it connects synthetic monitoring, real-user monitoring, and distributed tracing. This allows teams to track both real interactions and simulated workflows to detect and fix slowdowns or failures.
Popular Features
- Synthetic Monitoring. Simulate user journeys to check availability, performance, and errors across various global locations.
- Real User Monitoring. Collect real-time data on user behavior, load times, and frontend performance for better insights.
- Error Tracking. Capture and aggregate JavaScript errors to identify issues that affect site usability and stability.
- Custom Dashboards. Build real-time dashboards to visualize key metrics and track web page performance trends.
- CI Integration. Integrate tests into CI pipelines to detect performance issues before pushing changes to production.
- Distributed Tracing. Trace transactions across services to find bottlenecks affecting end-user performance.
Limitations
- Some reviews say the platform has a steep learning curve and takes time to navigate effectively.
- Pricing has been known to increase quickly when teams add more features or ingest more data.
- Users report the UI can feel cluttered, which makes it harder to isolate specific performance issues.
Pricing
- Infrastructure Free. $0/month – 1-day metric retention, core visualization, up to 5 hosts.
- Infrastructure Pro. $15/month – 850+ integrations, dashboards, 15-month retention (billed annually).
- Infrastructure Enterprise. $23/month – advanced alerts, Live Processes, administrative controls (billed annually).
- DevSecOps Pro. $22/month – includes Infrastructure Pro, CSPM, KSPM, compliance mapping, vulnerability and entitlement management.
- DevSecOps Enterprise. $34/month – includes Infrastructure Enterprise, file integrity monitoring, workload protection, more container coverage.
Datadog Reviews
- G2: 4.4/5
- Capterra: 4.6/5
9. Dynatrace
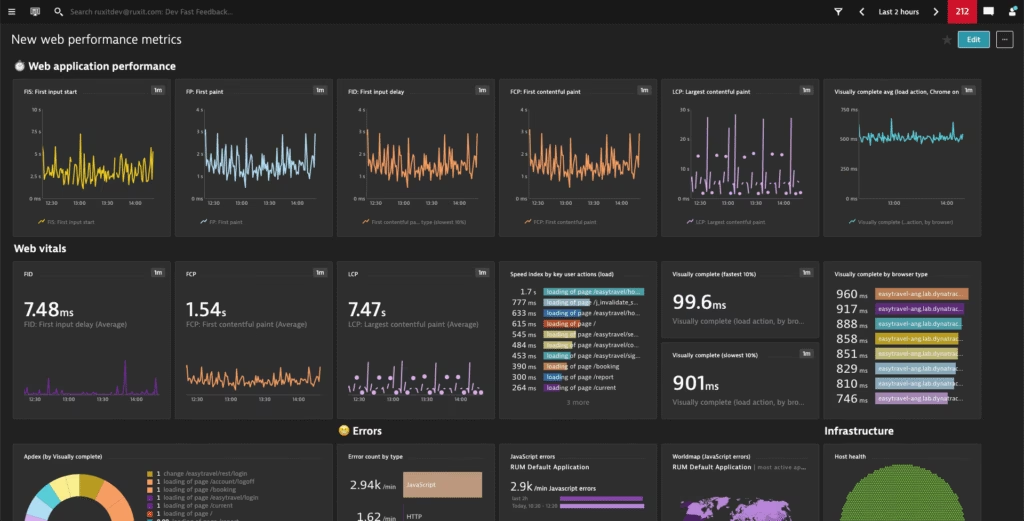
Dynatrace is a unified observability and security platform that monitors the full stack across cloud and hybrid environments. It provides insights into application performance, infrastructure health, and user experience. Dynatrace detects anomalies, tracks real-time data, and simplifies root cause analysis.
This web page performance tool stands out for its AI-driven monitoring and session-level visibility. It combines real user data with synthetic monitoring. It visualizes digital journeys from user action to backend systems. This supports performance tuning and faster incident response.
Popular Features
- Real User Monitoring: Track user behavior and interaction patterns with live performance metrics across devices and regions.
- Session Replay: Replay individual user sessions to understand how specific actions lead to errors or performance drops.
- Synthetic Monitoring: Simulate user journeys from multiple locations to detect issues before they affect real users.
- Davis AI Analysis: Use Dynatrace’s AI engine to identify root causes and analyze performance trends in real time.
- Web Architecture Mapping: Visualize system dependencies with automatic detection of application services and backend connections.
- Performance Cards: View key metrics like Apdex scores and top service requests in an aggregated performance summary.
Limitations
- Smaller teams may find the scale and pricing misaligned with their needs.
- Initial configuration, especially in hybrid or legacy systems, may require additional time and expertise.
- Some users report restrictions when tailoring dashboards or reports to specific workflows.
Pricing
- Full-Stack Monitoring. $0.08/hour for 8 GiB host – Includes infrastructure, applications, microservices, Kubernetes, networks, and AIOps for full-stack observability.
- Infrastructure Monitoring. $0.04/hour for any size host – Monitors cloud platforms, containers, networks, and data centers with unlimited host size and AIOps.
- Kubernetes Platform Monitoring. $0.002/hour for any size pod – Offers visibility into Kubernetes workloads, pods, containers, volumes, events, alerts, and nodes.
- Application Security. $0.018/hour for 8 GiB host – Provides real-time vulnerability analysis and threat protection across applications, with AIOps integration.
- Real User Monitoring. $0.00225/session – Tracks real user sessions across mobile, hybrid, and single-page applications with built-in analytics.
- Synthetic Monitoring. $0.001/synthetic request – Simulates traffic and monitors performance via HTTP monitors and third-party API ingestion.
Dynatrace Reviews
- G2: 4.5/5
- Capterra: 4.6/5
Make AI Your Website Performance Ally – Embrace Speed & Stability
Broken pages break trust. Every second of delay chips away at conversions, user confidence, and your brand’s reputation. Speed isn’t just a feature — it’s a signal.
The difference between bounce and buy is often just a few milliseconds.That’s where Search Atlas steps in. Built with automation at its core, it takes the grunt work out of web page performance monitoring so your team can focus on what actually moves the needle.
Let Search Atlas catch the cracks before your users do. Start with a free trial!


