An AI traffic dashboard consolidates AI-referred session data and citation visibility signals into a single monitoring layer. AI traffic differs from a standard referral report in two ways. First, it isolates AI platform sessions into a dedicated channel group. Default GA4 reporting leaves those sessions inside Referral or Direct. Second, it adds a citation-visibility layer that records brand mentions in AI responses. That layer captures activity that never produces a session in GA4.
Both layers exist because AI-driven discovery splits into two separate events. The first is a click. A user reads an AI response and follows a cited link. A session fires in GA4. The second is a citation without a click. A user reads the AI response and does not follow the link. No session fires anywhere. Standard analytics captures the first event and misses the second. The dashboard captures both through different mechanisms at different data layers.
The session-count layer addresses click events. A GA4 custom channel group matches AI platform domains through regex. It groups confirmed sessions into a named AI Traffic channel. The output is a session floor, the confirmed minimum of AI-referred visits. It is a floor because referrer-stripped sessions never reach the channel group. AI mobile applications strip referrer headers before the session fires. Those sessions arrive as Direct with no attributable source.
The citation-visibility layer captures what the session-count layer cannot see. It records which domains appear in AI responses to relevant queries. The output is a citation frequency count and a share-of-voice score for each platform. Both metrics exist independently of whether any visit followed the citation.
Building this dashboard is not a formatting task. Most existing tutorials treat it as one. Connect GA4 to Looker Studio, copy a template link, and done. The actual problem is measurement design. A template does not explain which data belongs in the dashboard or why each metric is there. It does not explain what to do when the numbers change. This article covers those questions.
What Is an AI Traffic Dashboard?
An AI traffic dashboard is a reporting system built to measure how AI platforms send visitors to a website and how often that website receives citations in AI-generated responses. AI traffic dashboard pulls data from GA4 custom channel groups, citation monitoring tools, and branded search trend data. It structures those inputs into two parallel views. One tracks session events and one tracks visibility events.
What does an AI traffic dashboard measure? An AI traffic dashboard measures six categories of data. They are AI-referred session counts, engaged session rates, landing page performance by AI source, branded search lift, citation frequency across AI platforms, and share-of-voice against competitors. These categories span both the session-count layer and the citation-visibility layer. No single category tells the full story on its own.
What makes an AI traffic dashboard different from a standard analytics dashboard? A standard analytics dashboard aggregates all referral traffic under a single channel. An AI traffic dashboard isolates AI platform referrals into a dedicated channel group and adds a second layer for citation monitoring data that standard dashboards do not contain. Standard dashboards miss AI traffic in two ways. GA4 misclassifies many AI-referred sessions as Direct, and no session event fires when a user reads a citation but does not click. The AI traffic dashboard addresses both gaps through configuration and tooling.
Why do SEO teams build an AI traffic dashboard? SEO teams build an AI traffic dashboard because AI platforms now function as a referral source with measurable engagement quality, and that source is invisible inside default GA4 reporting. Without a dedicated dashboard, AI-referred sessions merge into Direct or Referral channels, citation volume goes unmeasured, and the content team has no data to act on for Answer Engine Optimization (AEO). The dashboard makes AI-sourced traffic visible, separable, and comparable to organic.
How does GA4 misclassify AI-referred sessions without a custom channel group? GA4 misclassifies AI-referred sessions because its default channel grouping rules do not include AI platform domains, so sessions from chatgpt.com, gemini.google.com, claude.ai, and perplexity.ai fall into the Referral bucket or the Direct bucket depending on whether the referrer header was preserved**.** Many AI platforms strip referrer headers from outbound links, which causes GA4 to log the session with no source, placing it into Direct. The custom channel group fixes the Referral misclassification, and dark traffic estimation handles the Direct misclassification.
What is the relationship between AEO and an AI traffic dashboard? Answer Engine Optimization (AEO) is the practice of structuring content to earn citations in AI-generated answers, and the AI traffic dashboard is the measurement system that shows whether AEO efforts are producing results. AEO produces two measurable outcomes. They are citation appearances (measured by the visibility layer) and referral sessions (measured by the session-count layer). The dashboard connects both outcomes to specific landing pages so the content team identifies which AEO-optimized pages are earning citations and which are generating click-through traffic.
AI Traffic Dashboards vs Standard Referral Reports
An AI traffic dashboard and a standard referral report differ across eight dimensions. The eight dimensions are channel architecture, AI platform coverage, dark traffic handling, citation visibility, session floor acknowledgment, engagement comparison, review cadence, and metric priority. Standard referral reports treat all non-organic, non-paid traffic as a single bucket and apply no AI-specific logic. AI traffic dashboards apply a dedicated channel group, estimate dark traffic, and add a citation layer that has no equivalent in a referral report.
What does a standard referral report show that an AI traffic dashboard replaces? A standard referral report shows top referral domains sorted by session volume, with no distinction between AI platforms, media sites, directories, or social networks. The AI traffic dashboard does not replace that report entirely. It adds a focused view dedicated to AI platform traffic so that AI-referred sessions are never buried under aggregate referral volume.
How does the channel grouping mechanism differ? A standard referral report uses GA4’s default channel grouping, which has no AI traffic category. An AI traffic dashboard applies a custom channel group with a regex pattern that matches AI platform domains explicitly. The custom channel group creates a named segment called “AI Traffic” or a similar label, which then filters all charts, tables, and trend lines in the dashboard. Without this grouping mechanism, no downstream metric in the dashboard is accurate.
How does the scope of attribution differ? Standard referral reports attribute only clicked sessions where the referrer header was preserved. AI traffic dashboards attribute sessions through the channel group and estimate unattributed sessions through dark traffic proxies and citation data. The scope difference means AI traffic dashboards produce a wider, less precise estimate of total AI-driven discovery, while standard referral reports produce a narrower, more precise count of confirmed referral events.
| Dimension | AI Traffic Dashboard | Standard Referral Report |
| Channel architecture | Custom channel group isolating AI platform domains | Default GA4 channel grouping; AI domains fall into Referral or Direct |
| AI platform coverage | Explicit regex covering ChatGPT, Gemini, Claude, Perplexity, Bing AI, Copilot | No AI-specific coverage; platforms listed alongside all other referrers |
| Dark traffic handling | Behavioral proxy estimation for Direct sessions with AI engagement patterns | Not addressed; Direct traffic is not analyzed for AI origin |
| Citation visibility | The second data layer from the citation monitoring tool tracks brand mentions in AI responses | Not present; no session event = no data |
| Session floor acknowledgment | Session count labeled as floor estimate due to referrer stripping | Session count treated as complete; no undercount acknowledged |
| Engagement comparison | AI traffic engagement rate compared directly to the organic baseline | Engagement reported per referral domain without cross-channel comparison |
| Review cadence | Weekly review of session trends plus monthly citation visibility review | Ad hoc or monthly review of referral sources by volume |
| Metric priority | Engaged sessions and engagement rate are primary metrics | Raw session count is the primary metric |
What Does an AI Traffic Dashboard Track?
An AI traffic dashboard tracks five parallel data types. The five parallel data types are confirmed AI-referred sessions (the session floor), citation appearances in AI responses, engagement quality metrics for AI-referred sessions, landing page performance segmented by AI source, and trend data comparing AI traffic growth to AI visibility growth. Each layer answers a different question. The session floor answers how many users arrived from AI platforms. Citation visibility answers how often the brand appears in AI responses. Engagement answers whether AI-referred users are reading content or bouncing. Landing page data answers which content earns AI-driven visits.
There are five tracking layers. The tracking layers are listed below.
- The Session Floor: Confirmed AI-Referred Sessions
- Citation Visibility Beyond Click-Based Traffic
- Engaged Sessions vs Raw Session Counts
- Landing Page Performance From AI Platforms
- AI Traffic Trends vs AI Visibility Trends
1. The Session Floor: Confirmed AI-Referred Sessions
The session floor is the confirmed count of referral sessions where the GA4 source matches an AI platform domain, and it represents the minimum number of AI-driven visits, not the total. The term “floor” is deliberate. Referrer stripping, AI mobile apps, and copied-link behavior all prevent some AI-referred sessions from registering with an AI source. The session floor is the count that made it through attribution intact.
What referrer domains produce the session floor count? The referrer domains that produce the session floor count are chatgpt.com, gemini.google.com, claude.ai, perplexity.ai, copilot.microsoft.com, and bing.com (for Bing AI Chat-referred traffic). Each domain passes a referrer header on a portion of outbound clicks. GA4 records the source as the referring domain, and the custom channel group assigns those sessions to the AI Traffic channel. The session floor is the sum of sessions across all six domains.
Why is the session floor always an undercount? The session floor is always an undercount because multiple mechanisms prevent AI-referred sessions from being attributed to an AI domain. Firstly, some AI platforms strip the referrer header on outbound links, causing GA4 to log the session as Direct. Secondly, users in AI mobile apps often copy links and paste them into browsers, which removes referrer context entirely. Thirdly, AI responses sometimes generate traffic through intermediate redirects that overwrite the original referrer. The actual volume of AI-driven visits is always higher than the session floor.
How does referrer stripping differ across AI platforms? Referrer stripping behavior differs by platform. Perplexity preserves referrer headers on most outbound links, ChatGPT strips referrers inconsistently depending on the browser and link type, Claude strips referrers on many outbound links, and Gemini’s behavior varies by surface (web versus mobile app versus API). This means the session floor is more complete for Perplexity traffic than for Claude traffic. Teams comparing performance across platforms need to account for the fact that identical citation frequency across two platforms does not produce identical session floors.
2. Citation Visibility Beyond Click-Based Traffic
Citation visibility is the count and share-of-voice measurement of how often an AI platform cites a specific domain, brand, or URL in its responses to relevant queries, regardless of whether the user clicked through to the site. Citation visibility is measured by submitting standardized prompts to AI platforms and recording which domains appear in the responses. The measurement is not based on session events. It operates entirely outside GA4.
How does citation visibility measurement work? Citation visibility measurement works by submitting a set of topic-relevant prompts to each AI platform, extracting the cited domains from each response, and aggregating citation frequency into share-of-voice scores by platform. A tool (Search Atlas LLM Visibility) automates this process by running prompts across ChatGPT, Claude, Gemini, and Perplexity on a scheduled basis, grouping citations by topic, and calculating cross-model visibility scores. Manual citation monitoring follows the same logic but requires manual prompt submission and response recording.
What does citation visibility data reveal that GA4 session counts do not? Citation visibility data reveals how often a brand is present in the AI discovery layer before a click decision is made, which GA4 session counts cannot show because GA4 only records events after a click occurs. A brand cited frequently in ChatGPT responses but rarely generating referral sessions has a visibility-to-click gap. That gap indicates that the citation appears in low-intent queries, that the citation is not accompanied by a link, or that the user finds sufficient information in the AI response without clicking. GA4 session data alone cannot diagnose this.
How does citation data connect to the AEO content cycle? Citation data connects to AEO by identifying which topics, formats, and pages earn citations, which the content team then uses to prioritize future content production and page optimization. Pages that earn citations at high frequency become templates for structure and depth. Topics with low citation frequency but high search volume become targets for new AEO content. The dashboard closes the loop by showing whether new content, after publication, begins earning citations.
3. Engaged Sessions vs Raw Session Counts
Raw session counts total every session attributed to the AI Traffic channel, regardless of what the user did. Engaged sessions count only those sessions where the user was active for at least ten seconds, triggered a conversion event, or viewed two or more pages. The distinction matters because AI-referred sessions sometimes include low-quality traffic from link aggregators that cite content without editorial context. Engaged sessions filter out that noise. Raw counts inflate apparent performance.
Why do engaged sessions produce more reliable AI traffic insights than raw session counts? Engaged sessions produce more reliable insights because they require a minimum behavioral threshold that distinguishes genuine content interaction from accidental or bot-adjacent visits. A referral session that lasts two seconds and exits immediately contributes nothing to business outcomes. Including it in the headline metric distorts engagement rate, average engagement time, and per-session conversion probability. Engaged sessions as the primary metric produce a conservative, defensible count.
| Metric | Definition | Use in AI Traffic Dashboard |
| Raw session count | Total sessions attributed to the AI Traffic channel group, including sub-10-second visits | Baseline volume indicator; not the headline metric |
| Engaged sessions | Sessions lasting 10+ seconds, generating a conversion event, or viewing 2+ pages | Primary metric. Filters low-quality visits from the headline count |
| Engagement rate | Percentage of sessions that qualify as engaged | Cross-platform quality comparison; threshold benchmark for platform scoring |
| Average engagement time | Mean active time per session for AI-referred visits | Content depth indicator; compares against organic baseline |
| Sessions per user | Average sessions per unique user from the AI Traffic channel | Repeat-visit indicator. Measures whether AI-referred users return |
4. Landing Page Performance From AI Platforms
Landing page performance in an AI traffic dashboard is the breakdown of session count, engaged session rate, average engagement time, and conversion rate by destination URL, filtered to include only sessions from the AI Traffic channel group. This view shows which specific pages on the site are receiving AI-driven visits and how well those pages convert the traffic they receive.
What landing page dimensions matter most for AI traffic analysis? The landing page dimensions that matter most are URL path, AI platform source, session count, engaged session count, engagement rate, average engagement time, and goal completions. URL path identifies the content. The AI platform source isolates whether traffic came from ChatGPT, Perplexity versus Claude, which reflects different citation patterns. Engagement rate separates high-quality AI traffic from low-quality AI traffic at the page level. Goal completions connect AI-referred visits to business outcomes.
How does landing page data connect to AEO decisions? Landing page data drives AEO decisions by identifying which pages earn AI-referred visits and which do not, giving the content team a priority list for structural optimization. A page with high citation visibility but low session count needs a stronger call to click (a more compelling title, a clearer information gap, or a richer excerpt). A page with high sessions but a low engagement rate needs internal content improvement. A page with a high session count and high engagement rate becomes the structural template for new AEO content.
5. AI Traffic Trends vs AI Visibility Trends
AI traffic trends measure the change in session count from the AI Traffic channel over time. AI visibility trends measure the change in citation frequency and share-of-voice across AI platforms over time. The two trend lines move on different timescales and respond to different inputs. Session trends respond to changes in what users click. Visibility trends respond to changes in what AI models cite. They are related but not identical.
Why do AI traffic trends and AI visibility trends diverge? AI traffic trends and visibility trends diverge because citation frequency and click-through behavior are governed by different factors. A brand’s visibility trend rises when AI models begin citing it more frequently, which depends on content quality, freshness, and authority signals. The session trend rises only when cited users also click. A brand with high visibility but low click-through produces a divergence where visibility trends climb while session trends remain flat.
What does a rising visibility trend with a flat session trend indicate? A rising visibility trend with a flat session trend indicates that the brand earns citations frequently, but those citations do not produce clicks, which points to a content or query-type mismatch. Two common causes are: the brand is cited in informational AI responses where users receive complete answers without needing to visit the source, or the brand is cited without an accompanying link. The corrective action is to analyze which query categories produce citations, then determine whether those queries have click potential.
Why Does Engagement Rate Matter More Than Bounce Rate?
Engagement rate matters more than bounce rate in an AI traffic dashboard because GA4 replaced bounce rate as a primary metric and because engagement rate applies a positive behavioral threshold rather than a negative absence threshold. Bounce rate measures sessions with no interaction. Engagement rate measures sessions with confirmed interaction. For AI-referred traffic, where session intent varies widely by query type, engagement rate identifies the sessions that produced genuine content contact.
What engagement rate threshold distinguishes high-quality AI referral platforms? An engagement rate above 50% for AI-referred sessions indicates a platform that sends visitors with genuine content intent. An engagement rate below 35% indicates a platform that sends low-intent or misdirected traffic. These thresholds are not universal and vary by site type, content depth, and target audience. They function as starting benchmarks, not fixed standards. Each team needs to establish its own baseline by running 90 days of AI Traffic channel data before setting platform-specific thresholds.
How does engagement rate connect to AEO optimization decisions? Engagement rate by AI platform connects to AEO by revealing which platforms send the most qualified visitors, which the content team uses to prioritize citation acquisition on those platforms. A page receiving high-volume traffic from Perplexity with a 65% engagement rate is a stronger AEO candidate for continued optimization than a page receiving similar volume from ChatGPT with a 30% engagement rate. Engagement rate transforms platform session counts from a raw volume ranking into a quality-adjusted ranking.
How to Set Up the Session-Count Layer in GA4?
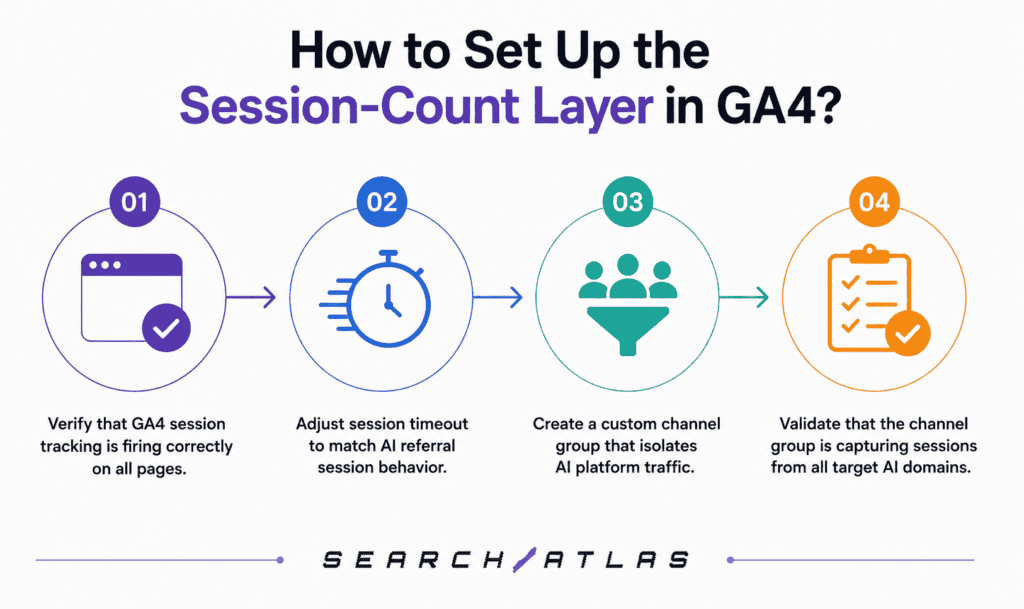
There are four main steps to set up the session-count layer in GA4. The steps are listed below.
- Verify that GA4 session tracking is firing correctly on all pages.
- Adjust the session timeout to match AI referral session behavior.
- Create a custom channel group that isolates AI platform traffic.
- Validate that the channel group is capturing sessions from all target AI domains.
How to Track User Session Number?
GA4 tracks user session numbers through the ga_session_number event parameter, which increments by one each time a user begins a new session on the site. This parameter is collected automatically if the GA4 tag is implemented correctly. To confirm collection, open GA4 DebugView, trigger a session from each AI platform, and verify that ga_session_number appears in the event parameters for the session_start event.
What configuration confirms that GA4 session tracking is complete? GA4 session tracking is confirmed complete when three conditions are met. The session_start event fires on page load, the ga_session_number parameter increments correctly across sessions, and the GA4 Realtime report shows source attribution for test visits from each AI platform domain. Testing from ChatGPT and Perplexity requires creating a live link inside each platform and clicking through to the site. Testing from Claude and Gemini follows the same method. Any platform that shows no source in the Realtime report after a confirmed click requires investigation of the referrer header.
What does session number data reveal about AI referral behavior? Session number data reveals whether AI-referred visitors are new users (session number = 1) or returning users who have visited before through another channel. For most sites, AI-referred sessions skew heavily toward session number 1, indicating that AI platforms introduce new audiences rather than re-engage existing ones. A high proportion of session number 1 visits confirms the AI Traffic channel as a top-of-funnel acquisition source.
How to Adjust Session Timeout?
Session timeout in GA4 is adjusted by navigating to Admin, then Data Streams, then the relevant web data stream, then Configure Tag Settings, then Show More, then Adjust Session Timeout. The default timeout is 30 minutes. For AI traffic dashboards, a 30-minute timeout is acceptable for most use cases. Some teams extend it to 60 minutes for sites with long-form content where users read slowly.
What session timeout value produces the most accurate AI referral session counts? A 30-minute timeout produces accurate session counts for AI-referred traffic on most content sites. A 60-minute timeout is more accurate for sites with content pieces exceeding 3,000 words, where deep reading sessions are common. The goal is to avoid splitting a single user visit into two sessions because the user paused reading. Splitting inflates raw session counts without representing additional users, which distorts the session floor estimate.
What happens to session counts if the timeout is set too short or too long? A timeout set too short splits single reading sessions into multiple sessions, inflating raw session counts and deflating average engagement time. A timeout set too long merges distinct visits into one session, deflating session counts and inflating average engagement time. Both errors distort the primary metrics of the AI traffic dashboard. The correct timeout matches the expected reading behavior of the site’s content. Most content sites fall within the 30-to-60-minute range.
How Do GA4 Custom Channel Groups Isolate AI Traffic?
GA4 custom channel groups isolate AI traffic by applying a regex rule that matches the session source against a list of AI platform domains, assigning matching sessions to a named channel called “AI Traffic” instead of leaving them in the default Referral channel. Without this grouping, AI-referred sessions appear in the Referral channel mixed with media, social, and directory traffic. The custom channel group creates a clean separation between AI-referred sessions and all other referral sources.
What is the step-by-step workflow for creating a GA4 custom channel group for AI traffic? There are six main steps to create a GA4 custom channel group for AI traffic. The steps are listed below.
- Open GA4 and navigate to Admin, then Data Display, then Channel Groups.
- Click “Create New Channel Group” and name it “AI Traffic Dashboard” or a similar label.
- Click “Add New Channel” and name the channel “AI Traffic.”
- Set the condition to: Source matches regex chatgpt\.com|gemini\.google\.com|claude\.ai|perplexity\.ai|copilot\.microsoft\.com|bing\.com.
- Save the channel definition and move it to the top of the channel priority list so it captures AI sessions before the default Referral rule applies.
- Return to the GA4 Explorations report, filter by the new channel group, and confirm that sessions from each AI domain appear under “AI Traffic.”
What happens if the channel group regex is incomplete? An incomplete regex causes sessions from unmatched AI platform domains to fall through into the default Referral channel, where they are invisible to any AI-specific filter in the dashboard. Perplexity subdomains, regional Bing AI URLs, and new AI platform domains added after the regex was created are the most common sources of leakage. A quarterly review of the regex against the full referral source list catches new platforms before they accumulate significant unclassified volume.
Which AI Platforms to Include in the Channel Group?
The six primary AI platforms that produce referral traffic requiring inclusion in the channel group are ChatGPT (chatgpt.com), Gemini (gemini.google.com), Claude (claude.ai), Perplexity (perplexity.ai), Microsoft Copilot (copilot.microsoft.com), and Bing AI Chat (bing.com). Each of these platforms generates outbound links from AI responses and passes at least some referrer header data to GA4. Platforms that do not generate outbound links (voice assistants, API-only tools) do not produce referral sessions and do not require channel group inclusion.
What regex pattern covers the six primary AI referral platforms? The regex pattern that covers all six primary AI referral platforms is listed below.
chatgpt\.com|gemini\.google\.com|claude\.ai|perplexity\.ai|copilot\.microsoft\.com|bing\.com**.** This pattern matches the full domain for each platform. The backslash before each period escapes the dot character, so it matches literally rather than as a wildcard. Testing this regex against a sample of referral source data before finalizing the channel group confirms that it captures target sessions and excludes non-AI traffic.
What AI platforms require domain monitoring beyond the primary six? AI platforms requiring monitoring beyond the primary six are You.com, Phind.com, Meta AI (meta.ai), and any enterprise AI assistant that generates outbound links to cited sources. These platforms produce lower referral volumes than the primary six but generate meaningful traffic for specific niches (Phind for developer-focused content, You.com for research-heavy queries). Each new platform identified in the referral source report warrants a regex addition to the channel group.
How often is the regex pattern updated? The regex pattern requires a review every 90 days and an unscheduled update whenever a new AI platform appears in the referral source report with more than ten sessions in 30 days. AI platform adoption patterns shift rapidly. A domain absent from the referral report in January generates hundreds of sessions by April. The 90-day review cadence ensures new platforms are captured before they accumulate large unclassified volumes.
What Metrics Does an AI Traffic Dashboard Include?
There are eight metrics that an AI traffic dashboard includes. The metrics are listed below.
- Engaged sessions from the AI Traffic channel group.
- Engagement rate for AI-referred sessions.
- Average engagement time for AI-referred sessions.
- Sessions per user from the AI Traffic channel.
- Landing page session count and engagement rate by URL.
- AI Traffic share of total organic and referral sessions.
- Citation frequency and share-of-voice by AI platform.
- Branded search query trend (as a proxy for dark AI traffic lift).
What metrics does an AI traffic dashboard exclude and why? An AI traffic dashboard excludes bounce rate (replaced by engagement rate in GA4), raw pageviews without session context, and click-through rate from AI platforms (not measurable through GA4). Bounce rate is excluded because GA4 no longer calculates it by default, and engagement rate carries more diagnostic value. Raw pageviews are excluded because a single AI-referred session produces multiple pageviews through internal navigation, making pageviews a misleading volume indicator for this channel.
Why are engaged sessions a better primary metric than raw session counts? Engaged sessions are a better primary metric because they require confirmed behavioral evidence of content interaction, which removes bot-adjacent visits, accidental landings, and sub-second sessions from the headline number. A dashboard that uses raw session counts as the primary metric shows growth even when engagement quality is declining. A dashboard using engaged sessions as the primary metric only shows growth when users are genuinely interacting with content.
How does the branded search lift function as an AI traffic dashboard metric? Branded search lift functions as a dark traffic proxy. An increase in branded query volume in Google Search Console that coincides with a rise in AI citation frequency indicates that AI exposure is driving users to search for the brand by name rather than clicking the citation link. The measurement requires comparing the branded query trend in GSC against the citation visibility trend from the monitoring tool.
How does citation share-of-voice complete the dashboard metric set? Citation share-of-voice completes the dashboard metric set by measuring the brand’s presence in the AI discovery layer relative to competitors, which no session-count metric captures. Session counts show only what arrived at the site. Citation share-of-voice shows how often the brand appears in AI responses compared to the brands it competes with for the same queries. A brand with a 15% citation share-of-voice across Perplexity, ChatGPT, and Gemini for its core topic cluster is in a measurably stronger AI visibility position than a competitor with 5%.
How to Add a Visibility Layer Beyond Session Counts?
There are two main steps to add a visibility layer beyond session counts. The steps are listed below.
1. Cross-Platform Citation Monitoring Across ChatGPT, Gemini, Claude, and Perplexity
Cross-platform citation monitoring is performed by submitting a standardized set of topic-relevant prompts to each AI platform, recording which domains and URLs appear in the responses, and aggregating citation counts by platform and by topic over time. The standardized prompt set covers the brand’s core topic cluster, competitor comparison queries, product category queries, and use-case queries. Submitting the same prompts to all four platforms allows direct platform-to-platform citation share-of-voice comparison.
What data does cross-platform citation monitoring produce? Cross-platform citation monitoring produces four data outputs: citation count per domain per platform, citation share-of-voice by topic, sentiment associated with each citation (positive, neutral, or negative framing), and competitor citation frequency for the same prompt set. These outputs form the visibility layer of the AI traffic dashboard. Citation count per platform populates the visibility trend chart. Share-of-voice feeds the competitive positioning view. Sentiment data identifies which AI platforms frame the brand positively versus negatively.
How often are cross-platform citation monitoring prompts submitted? Cross-platform citation monitoring prompts are submitted on a weekly basis for brands with active AEO programs and on a monthly basis for brands in early-stage monitoring. Weekly submission captures the lag between content publication and AI model training or index updates. Monthly submission is sufficient to identify direction-of-travel trends but misses week-level changes caused by specific content events (a new article earning citations, a competitor losing citations after a site issue).
2. Search Atlas LLM Visibility for Citation Tracking
Search Atlas LLM Visibility is a dedicated citation tracking tool within the Search Atlas platform that monitors brand mentions, competitor citations, and share-of-voice scores across ChatGPT, Claude, Gemini, and Perplexity on an automated, recurring basis. The tool eliminates the need for manual prompt submission by running a configured prompt set across all four platforms at scheduled intervals and recording every citation event.
How does Search Atlas LLM Visibility work mechanically? Search Atlas LLM Visibility works by submitting user-configured prompts to each AI platform’s response interface, parsing the source citations from each response, and aggregating the results into a structured data view that includes citation frequency, share-of-voice, sentiment classification, and cross-platform ranking comparisons. The tool groups citations by topic and by domain, allowing users to see both their own citation performance and competitor citation performance for the same query set. Cross-model visibility scoring gives each domain a numeric score reflecting its relative citation strength across all four platforms combined.
What specific data views does Search Atlas LLM Visibility provide? Search Atlas LLM Visibility provides five specific data views. Visibility trends over time, share-of-voice metrics comparing the monitored brand against competitors, cross-platform ranking comparisons showing which domains rank highest per platform, sentiment patterns classifying citation framing as positive, neutral, or negative, and topic-level performance showing which topic clusters generate the most citations. The visibility trends view is the primary input for the AI traffic dashboard’s citation visibility layer. The share-of-voice view feeds the competitive dashboard section.
How does Search Atlas LLM Visibility data integrate with GA4 session data in the dashboard? Search Atlas LLM Visibility data integrates with GA4 session data in the dashboard by using date as the join key. Citation frequency data by week is placed on the same time axis as GA4 session count by week, creating a dual-trend view where the relationship between visibility events and session events becomes visible. This integration is built manually in Looker Studio using a blended data source, with citation data imported as a CSV or a connected spreadsheet and GA4 data pulled through the native connector.
How to Account for Dark AI Traffic in a Dashboard?
There are four steps to account for dark AI traffic in a dashboard. The steps are listed below.
- Identify the baseline Direct traffic volume from a period before significant AI platform referral began (typically 18 to 24 months prior).
- Segment current Direct traffic sessions by behavioral profile (landing page type, engagement time, pages per session).
- Compare behavioral patterns of current Direct sessions to confirmed AI-referred sessions.
- Calculate a dark traffic estimate by applying the behavioral match rate to the excess Direct volume above the historical baseline.
What behavioral patterns identify AI-originated sessions inside Direct traffic? Behavioral patterns that identify AI-originated sessions inside Direct traffic are landing on an informational or long-form content page (not the homepage), have a high average engagement time (above 90 seconds), a low sessions-per-user ratio (close to 1.0), and no referral from internal pages on the previous session. These patterns reflect users who arrive via a copied link from an AI response, have high reading intent because the AI response created specific interest, and are first-time visitors with no prior browsing history on the site.
How are dark AI traffic estimates reported in the dashboard? Dark AI traffic estimates are reported in the dashboard as a labeled range, not a precise figure. The range communicates the inherent imprecision of behavioral proxy estimation. Presenting a single number without a range implies measurement accuracy that does not exist. Stakeholder reports label this metric “Estimated Dark AI Traffic” with a footnote explaining the behavioral proxy method and its limitations.
What is the internal-page direct proxy method for identifying dark AI traffic? The internal-page direct proxy method identifies AI dark traffic by filtering Direct sessions to those that landed on internal content pages (not the homepage, not login pages, not category pages) with no referring session in the same user’s prior history. A user who types a homepage URL directly into a browser is plausibly a returning visitor. A user who lands directly on a specific 3,000-word informational article with no prior site history is less plausibly a direct typist and more plausibly someone who followed a copied link from an AI response.
What is the relationship between dark traffic volume and AI mobile app usage? Dark traffic volume correlates with AI mobile app usage because users on mobile AI apps (ChatGPT iOS, Gemini Android, Perplexity mobile) commonly use the “copy link” function to open cited URLs in a mobile browser, which strips the referrer header and logs the session as Direct. On sites with significant mobile traffic from AI referrers, the dark traffic estimate is consistently larger than on sites where AI-referred traffic is primarily desktop. Sites serving developer or research audiences tend to see higher desktop AI referral rates and lower dark traffic proportions.
How to Read and Use an AI Traffic Dashboard?
There are five steps to read and use an AI traffic dashboard. The steps are listed below.
- Start with the headline engagement rate for the AI Traffic channel and compare it to the organic baseline.
- Check the session trend line for direction (rising, flat, declining) and note the engagement rate trend alongside it.
- Review the landing page breakdown table sorted by engaged sessions to identify top-performing pages.
- Open the citation visibility view and compare citation frequency trends to the session trend.
- Log any investigation triggers (session drops, engagement rate changes, citation divergence) for the weekly review action list.
What does a rising session trend with a declining engagement rate indicate? A rising session trend with a declining engagement rate indicates that the AI Traffic channel is growing in raw volume, but the new sessions are lower quality than previous ones, which suggests a change in citation context. Two common causes are that the brand is being cited in a new query category with lower content-match intent, or a new AI platform has begun citing the brand, and that platform’s users have lower engagement rates than the existing AI referrer mix. Segmenting the landing page table by AI platform source identifies which platform is driving the lower-engagement growth.
What does a flat session trend with a rising citation visibility trend indicate? A flat session trend with a rising citation visibility trend indicates that the brand is earning more citations, but those citations are not generating additional clicks, which points to a citation placement or query-intent mismatch. The brand appears more frequently in AI responses, but the responses either answer the user’s question completely without requiring a click, or the citations appear without a hyperlinked URL. The corrective action is to analyze the specific prompt categories driving the visibility increase and determine whether those queries have click potential.
How often is the AI traffic dashboard reviewed? The AI traffic dashboard requires a weekly session trend review and a monthly citation visibility review. Weekly review catches session drops and engagement rate changes that require immediate content investigation. Monthly review tracks citation share-of-voice trends and competitive positioning shifts that unfold over four-to-eight week cycles. Quarterly review updates the channel group regex, validates that all AI platform domains are captured, and resets any investigation thresholds based on new baseline data.
What actions follow from a landing page session drop detected in the weekly review? A landing page session drop detected in the weekly review triggers three actions. Check whether the page still appears in citation monitoring results for its target queries, check whether the page has changed structurally in the past 30 days, and check whether any AI platform domain that previously sent traffic to the page has dropped the URL from its citations. If citation monitoring shows the page is no longer cited, the content team prioritizes reoptimization of the page’s AEO structure.
How to Distinguish Real AI Traffic Growth From Attribution Noise?
There are four steps to distinguish real AI traffic growth from attribution noise. The steps are listed below.
- Compare the session trend against the citation visibility trend to check for correlated movement.
- Check whether the session increase coincides with a GA4 configuration change, a tag change, or a tracking implementation update.
- Apply the three-signal validation framework. Session trend, citation frequency trend, and branded search query trend all move in the same direction.
- Segment the landing page table by AI platform source to confirm that the session increase is distributed across multiple pages rather than concentrated on one URL.
What patterns constitute attribution noise rather than real growth? Attribution noise patterns are a session spike concentrated on a single URL with no corresponding citation frequency increase, a session increase that began exactly on the date of a GA4 configuration change, and a session increase where all growth comes from one AI platform domain while others remain flat. Single-URL spikes without citation evidence are typically caused by a social share or a direct link mention that happened to come from an AI-adjacent domain.
How do you confirm that a session increase is not caused by a GA4 configuration change? Confirmation that a session increase is not caused by a GA4 configuration change requires checking the GA4 change history log, accessible at Admin, then Account, then Change History, filtered to the date range when the session increase began. If a tag change, channel group modification, or data stream adjustment appears in the change history log on or near the date the session increase started, the session increase is likely attributable to the configuration change.
What three-signal validation framework confirms a real growth event? The three-signal validation framework requires all three signals to move in the same direction within a four-week window. The AI Traffic channel session count rises, the citation frequency from the monitoring tool rises, and the branded search query volume in Google Search Console rises. Each signal measures AI influence through a different mechanism. Session count measures click-through. Citation frequency measures the presence of the discovery layer. Branded search query volume measures brand recall from AI exposure without a click.
How does citation monitoring data serve as the second validation signal? Citation monitoring data serves as the second validation signal by confirming that the session increase corresponds to an increase in citation events, not just a change in attribution or tagging. If sessions rise but citation frequency is flat or declining, the session increase is likely attributable to a configuration change or dark traffic reclassification rather than organic AI visibility growth. If both signals rise together, the session increase is validated as a genuine discovery-layer event.
What Are the Best Practices for AI Traffic Dashboard Design?
There are six main best practices for AI traffic dashboard design. The best practices are listed below.
- Separate Session Data From Citation Visibility Signals
- Use Engagement Metrics Instead of Raw Volume Alone
- Monitor Landing Pages Receiving AI Traffic
- Track AI Visibility Across Multiple Platforms
- Build Dashboards Around Investigation Triggers
- Review and Update AI Tracking Configurations Regularly
1. Separate Session Data From Citation Visibility Signals
Session data and citation visibility signals are separated in the dashboard by placing them in distinct sections with clear section headers, using different chart colors for each data type, and never combining session counts with citation counts in the same chart. The most common design uses two horizontal dashboard sections. The upper section contains all GA4 session metrics, and the lower section contains all citation visibility metrics. This visual structure prevents readers from confusing the two data types or treating citation counts as session equivalents.
Why does mixing session data with citation visibility data create measurement errors? Mixing session data with citation visibility data creates measurement errors because the two metrics use different denominators, different time bases, and different measurement mechanisms, making any combined score mathematically meaningless**.** Session counts are discrete events recorded by GA4. Citation counts are sampled measurements recorded by a monitoring tool running a fixed prompt set. Combining them into a single “AI performance score” produces a number that neither metric supports and that cannot be reproduced or audited.
What visual design convention keeps the two data types distinct? The visual design convention that keeps session data and citation visibility data distinct is. Blue chart elements for all GA4 session metrics and orange or amber chart elements for all citation visibility metrics, with a labeled divider line or section heading between the two groups. Color convention allows readers to distinguish data types at a glance without reading chart labels. Section headings (“Session Layer” and “Visibility Layer”) reinforce the separation and explain the logic to new dashboard users.
2. Use Engagement Metrics Instead of Raw Volume Alone
Engagement metrics replace raw volume as the primary indicator by configuring the headline scorecard in the dashboard to show engaged sessions and engagement rate rather than total sessions. Raw session count moves to a secondary position, displayed beneath the headline scorecards as context rather than as the primary performance indicator. This configuration ensures that growth in the headline metric represents genuine quality improvement, not volume inflation.
When does raw session volume provide useful information in an AI traffic dashboard? Raw session volume provides useful information when comparing total AI-referred traffic scale against total organic search traffic scale, or when establishing the session floor estimate for dark traffic calculation. In both cases, raw session count answers a scale question (how large is this channel relative to organic?) rather than a quality question (are these sessions valuable?). The dashboard accommodates both uses by displaying raw session count in a secondary scorecard alongside, but clearly below, the engaged session scorecard.
How does pairing engagement rate with session count change the optimization decision? Pairing engagement rate with session count changes the optimization decision by separating high-volume, low-quality pages from high-volume, high-quality pages, which require different corrective actions. A page with 500 AI-referred sessions and a 30% engagement rate needs a content or relevance fix. A page with 500 AI-referred sessions and a 70% engagement rate needs more AEO investment to increase the session count. Without the engagement rate pairing, both pages look identical in session volume and receive no differentiated treatment.
3. Monitor Landing Pages Receiving AI Traffic
Landing pages receiving AI traffic are monitored through a URL-level breakdown table filtered to the AI Traffic channel group, reviewed weekly for session volume changes and engagement rate changes at the page level. The monitoring process requires establishing a baseline session count and engagement rate for each high-traffic page over the first 90 days of dashboard operation. Subsequent weekly reviews compare current metrics against the baseline and flag deviations above a defined threshold (20% session change or 10 percentage point engagement rate change).
What action does a 20% drop in AI-referred sessions on a specific page trigger? A 20% drop in AI-referred sessions on a specific page triggers a citation monitoring check for that page’s target queries across all four AI platforms. The check determines whether the page has lost citations (citation frequency drops in the monitoring tool) or retained citations but lost click-through (citation frequency stable, sessions down). Lost citations require content reoptimization. Retained citations with lost click-through require analysis of the citation context to understand why users stopped clicking.
What action does an engagement rate below 35% on a high-session page trigger? An engagement rate below 35% on a page with high AI-referred session volume triggers a content audit of that page to identify the mismatch between the AI citation context and the page’s actual content. The most common cause is that the AI platform cites the page for a query that the page does not directly and completely answer. Users arrive with a specific expectation, find that the page does not match, and exit quickly. The content fix is to identify the specific queries that generate citations for the page and restructure the opening section to directly address those queries.
4. Track AI Visibility Across Multiple Platforms
AI visibility is tracked across multiple platforms by configuring the citation monitoring tool to submit the same prompt set to all four target platforms (ChatGPT, Gemini, Claude, Perplexity) and displaying the citation frequency per platform in a grouped bar chart or platform-comparison table within the dashboard. The comparison view shows whether the brand’s visibility is concentrated on one platform or distributed across all four. Concentrated visibility on a single platform represents a risk: if that platform’s citation algorithm changes, total visibility drops sharply.
Why does a single-platform citation view produce incomplete optimization decisions? A single-platform citation view produces incomplete optimization decisions because each AI platform uses different ranking signals, different training data cutoffs, and different citation selection logic, meaning a brand cited frequently on Perplexity and rarely on ChatGPT requires different optimization actions than a brand cited equally across all platforms. Platform-specific citation data reveals which platforms are underweighting the brand relative to competitors and which content types or structural attributes drive citations on each platform.
How does platform-specific citation data change content prioritization? Platform-specific citation data changes content prioritization by identifying which topic clusters are cited on which platforms, allowing the content team to focus new AEO content on topics that are underperforming on high-value platforms. A brand cited frequently on Perplexity for technical how-to queries but rarely on ChatGPT for the same queries investigates what structural or authority differences between its content and the ChatGPT-cited sources account for the gap.
5. Build Dashboards Around Investigation Triggers
Dashboards built around investigation triggers use threshold-based conditional formatting and alert logic to surface anomalies automatically, rather than requiring the reviewer to scan every metric manually. Investigation triggers are predefined conditions: a session count drop above 20%, an engagement rate drop below 35%, or a citation frequency drop above 15% week-over-week. When the dashboard identifies any of these conditions, the relevant metric or row is highlighted in red, directing the reviewer’s attention to the anomaly immediately.
What are the three primary investigation triggers for an AI traffic dashboard? There are three primary investigation triggers. The investigation triggers are listed below.
- A 20% or greater drop in AI-referred sessions on any page that previously received more than 50 sessions per month.
- An engagement rate drops below 35% on any page in the AI traffic landing page breakdown table.
- A 15% or greater drop in citation frequency for the brand on any single AI platform in the weekly monitoring cycle.
How does each trigger map to a specific corrective action? Each trigger maps directly to a corrective action: a session drop trigger initiates a citation monitoring check. An engagement rate drop trigger initiates a content audit of the underperforming page. A citation frequency drop trigger initiates a competitor citation comparison to determine whether the brand lost citations or competitors gained them. The direct mapping between trigger and action removes ambiguity from the weekly review process. Every person who reads the dashboard knows exactly what to do when a trigger fires, without waiting for further instruction.
6. Review and Update AI Tracking Configurations Regularly
AI tracking configurations are reviewed by running a quarterly checklist that covers four areas. They are regex completeness (all active AI platform domains included), session timeout accuracy (timeout still appropriate for current content depth), citation monitoring prompt relevance (prompt set still covers the brand’s current topic cluster), and data connection integrity (GA4 connector and citation tool data source both returning current data). Each area of the checklist produces either a pass (no change required) or an action item (specific update needed).
What is the quarterly configuration review checklist for an AI traffic dashboard? The quarterly configuration review checklist contains five checks. They are listed below.
- Verify that the channel group regex includes all AI domains appearing in the referral source report with more than five sessions.
- Verify that the session timeout matches the current average content length.
- Verify that the citation monitoring prompt set includes the brand’s three to five most recent content topics.
- Verify that the Looker Studio data connection refreshes on schedule.
- Verify that all investigation trigger thresholds are still calibrated to the current baseline, not the baseline from 12 months ago.
Each check requires less than 15 minutes. The full quarterly review takes approximately 60-90 minutes per dashboard.
What events require an unscheduled configuration review? Three events require an unscheduled configuration review outside the quarterly schedule. A new AI platform exceeds ten sessions in 30 days (requires regex addition), a GA4 configuration change is made to the property (requires validation that channel group logic is intact), and a major AI platform announces a significant product update that changes its link-passing or citation behavior. Unscheduled reviews focus on the specific configuration area affected by the event rather than running the full quarterly checklist. The focused review takes 15-30 minutes.
How AI Traffic Dashboards Change SEO and AEO Reporting?
AI traffic dashboards change SEO and AEO reporting by adding a second measurement channel (AI platform discovery) to the existing organic search measurement channel, requiring reporting to account for traffic sources and visibility signals that do not appear in standard GA4 or GSC reports. Before AI traffic dashboards existed, SEO reporting covered organic search volume, keyword rankings, and GSC click metrics. AI traffic dashboards add AI-referred sessions, citation share-of-voice, and visibility trend data as parallel reporting pillars.
How does AEO reporting differ from standard organic traffic reporting? AEO reporting differs from standard organic traffic reporting in three ways. It measures citation events in addition to click events, it tracks brand presence in AI responses rather than keyword rankings in search results, and it requires a visibility monitoring tool in addition to GSC and GA4.
What does an AI traffic dashboard reveal about AEO performance that GA4 alone does not? An AI traffic dashboard reveals two AEO performance signals that GA4 alone cannot show. They are citation frequency (how often the brand appears in AI responses, measured by the visibility layer) and the session floor undercount (the gap between actual AI-driven discovery and GA4-attributed sessions, estimated through dark traffic analysis). GA4 alone shows only the sessions where the referrer header survived. The dashboard adds the sessions that did not generate a GA4 event and the citation events that did not generate any sessions at all.
How does an AI traffic dashboard change the content team’s optimization priority list? An AI traffic dashboard changes the content team’s optimization priority list by adding citation frequency and citation quality as ranking criteria alongside keyword ranking and organic session volume. A page ranked fifth for a target keyword but cited frequently across three AI platforms becomes a higher-priority optimization candidate than a page ranked third for the same keyword but absent from AI citations. The dashboard gives the content team data to argue for that prioritization change based on evidence from the visibility layer.
What is the relationship between Domain Power and AI citation frequency? Domain Power, Search Atlas‘s proprietary site authority metric, correlates with AI citation frequency because AI models weigh domain credibility signals when selecting sources to cite in responses. A site with higher Domain Power tends to receive more citations across AI platforms for competitive queries where multiple sources cover the same topic. Domain Power does not guarantee citation frequency; content structure, recency, and topical relevance also factor into AI citation selection. The relationship is directional, not deterministic.
What Common Mistakes Break AI Traffic Dashboards?
Six common mistakes break AI traffic dashboards. The mistakes are listed below.
- Treating raw session count as the headline metric.
- Mixing AI crawler bot traffic with human referral sessions.
- Assuming citation visibility equals conversion impact.
- Building the dashboard without a review workflow.
- Reproducing full GA4 setup instructions instead of focusing on measurement design.
- Using dashboard templates without understanding the metric rationale.
1. Treating Raw Session Count as the Headline Metric
Treating raw session count as the headline metric breaks AI traffic dashboards because raw session count includes bot-adjacent traffic, referrer-stripped low-quality visits, and attribution noise, all of which inflate the apparent size of the AI traffic channel without reflecting genuine user behavior. A dashboard that shows 1,200 AI-referred sessions per month but never distinguishes engaged sessions from raw sessions gives the content team an inflated impression of AI channel performance. When engagement rate is then examined, the actual quality of the channel becomes clear, often revealing that 40% or more of raw sessions were low-quality.
What metric replaces raw session count as the headline metric? Engaged sessions replace raw session count as the headline metric in an AI traffic dashboard, with engagement rate displayed alongside it as the quality context metric. The headline scorecard reads: “Engaged Sessions: 720 | Engagement Rate: 60%.” Raw session count (1,200) moves to a secondary position labeled “Total Sessions (Floor Estimate)” to acknowledge that the number is both larger and less meaningful than the engaged session count.
2. Mixing AI Crawlers With Human Referral Sessions
Mixing AI crawler bot traffic with human referral sessions is a mistake because AI crawlers (GPTBot, ClaudeBot, GoogleBot for AI features) appear in server logs but do not trigger GA4 events, and any attempt to combine server log data with GA4 session data produces a metric that is neither a crawler count nor a session count. GA4 filters bots automatically from its data collection. Server logs do not. A team that exports server log data showing GPTBot requests and adds that number to GA4 session counts creates a meaningless combined figure.
How do you confirm that server log data is excluded from the GA4 dashboard metrics? Confirmation that server log data is excluded from GA4 dashboard metrics requires verifying that all dashboard data sources connect exclusively to the GA4 connector or the GA4 Data API, with no server log data imported through any secondary data source or spreadsheet upload. GA4’s bot filtering is applied at data collection, not at reporting. Any dashboard that imports server log data through a connected Google Sheet or a CSV upload risks introducing bot request counts into what appears to be a human session metric.
3. Assuming Citation Visibility Equals Conversion Impact
Assuming citation visibility equals conversion impact is a mistake because a brand cited frequently in AI responses for informational queries generates high visibility scores but produces zero conversions, while a brand cited less frequently for high-intent queries generates measurable conversion activity. Citation visibility measures presence in the AI discovery layer. Conversion impact measures business outcomes. The two are related but not interchangeable. A brand with 50 citations per week across all platforms and zero AI-attributed conversions has high visibility and low conversion efficiency.
How should citation visibility be framed in stakeholder reporting? Citation visibility is framed in stakeholder reporting as a leading indicator of AI discovery layer presence, not as a direct revenue metric. The correct framing is: “The brand appeared in AI responses for target queries 340 times this month, a 20% increase from last month, which represents a growing presence in the AI discovery layer.” The reporting does not claim that 340 citation appearances generated any specific revenue or conversion volume. The connection to revenue runs through the session floor, the dark traffic estimate, and the branded search lift metric, each of which is reported separately with its own measurement caveats.
4. Building the Dashboard Without a Review Workflow
Building the dashboard without a review workflow is a mistake because a dashboard that no one reviews on a defined schedule produces no optimization actions, making the effort of building and maintaining it worthless. Dashboards that lack a review workflow accumulate stale data, outdated regex patterns, and expired data connections without anyone noticing. Within three to six months, the dashboard reports inaccurate data, and the team stops trusting it.
What does a minimal viable dashboard review workflow contain? A minimal viable dashboard review workflow contains three components. A weekly 15-minute review session that checks session trends and flags investigation triggers, a monthly 30-minute review that covers citation visibility trends and competitive share-of-voice, and a quarterly 90-minute configuration review that validates all tracking logic. The weekly review produces a list of pages requiring investigation. The monthly review produces a citation visibility summary for stakeholder reporting. The quarterly review produces a configuration update log documenting any regex or threshold changes made.
5. Reproducing Full GA4 Setup Instructions Instead of Focusing on Measurement Design
Reproducing full GA4 setup instructions instead of focusing on measurement design is a mistake because GA4 setup is a prerequisite, not the measurement itself, and teams that confuse the two build technically functional dashboards with no interpretive framework for the data. A dashboard with correctly configured GA4, a complete channel group regex, and a functioning Looker Studio connection still fails if the team has no defined primary metrics, no investigation triggers, no review cadence, and no corrective action map. Measurement design is the layer that makes the technical setup meaningful.
What does measurement design produce that the GA4 setup alone does not? Measurement design produces three outputs that the GA4 setup alone does not. A defined primary metric hierarchy (engaged sessions over raw session count), a set of investigation triggers with mapped corrective actions, and a reporting structure that connects dashboard metrics to content optimization decisions. GA4 setup produces data. Measurement design produces a decision framework built on top of that data. Teams that invest in measurement design extract optimization actions from the dashboard. Teams that stop at GA4 setup have accurate data with no instructions for what to do with it.
6. Using Dashboard Templates Without Metric Rationale
Using dashboard templates without metric rationale is a mistake because templates carry implicit assumptions about which metrics matter, and teams that apply templates without examining those assumptions end up measuring the wrong things for their specific site and traffic profile. A template built for an e-commerce site with high AI traffic volume places different metrics in the headline position than a template built for a B2B content site with low AI traffic volume. Applying the wrong template without adjustment produces a dashboard that reports accurately but answers the wrong questions.
What does understanding metric rationale allow teams to adjust? Understanding metric rationale allows teams to adjust the headline metric choice, the investigation trigger thresholds, the platform weighting in the citation monitoring view, and the comparison baseline (organic versus AI engagement rate) to fit their specific audience, content type, and business model. A SaaS company with a long consideration cycle adjusts the sessions-per-user metric upward as a positive signal (multiple visits from AI-referred users indicate research behavior). A media site adjusts the pages-per-session metric as a primary engagement indicator rather than engagement time. The metric rationale is the knowledge base that makes those adjustments possible.
What Are the Limitations of AI Traffic Dashboards?
There are four limitations of AI traffic dashboards. The limitations are listed below.
- The session floor is always an undercount due to referrer stripping across AI platforms.
- Citation visibility data is sampled, not exhaustive, because monitoring tools submit a finite prompt set.
- Dark traffic estimates are behavioral proxies, not attributed measurements.
- AI platform citation algorithms change without public notice, making historical citation trends difficult to interpret across algorithm shifts.
What is the practical impact of the session floor undercount? The practical impact of the session floor undercount is that AI channel performance is systematically under-reported in GA4, meaning the actual business impact of AI-referred traffic is larger than the dashboard session count suggests. The undercount does not invalidate session-count trends. A rising session trend still indicates rising AI-referred click activity. The undercount means the absolute numbers are conservative, not that the direction of travel is unreliable.
What is the practical impact of sampled citation visibility data? The practical impact of sampled citation visibility data is that citation frequency counts reflect the prompt set submitted to the AI platforms, not the full universe of queries where the brand appears. A brand cited in 340 out of 1,000 monitored responses is not necessarily cited in 34% of all AI responses. It is cited in 340 out of the specific 1,000 prompts the monitoring tool submitted. Expanding the prompt set increases sample coverage but does not eliminate sampling limitations.
How to Account for AI Traffic That Does Not Appear as Referral Traffic?
AI traffic that does not appear as referral traffic is accounted for through three parallel estimation methods. Branded search lift measurement in Google Search Console, behavioral segmentation of Direct sessions in GA4, and dark traffic range estimation using the internal-page direct proxy method. Each method produces a partial estimate. Combining all three produces a range with upper and lower bounds that the dashboard presents as the dark traffic component.
What branded search lift measurement method produces the most reliable dark traffic proxy? The most reliable branded search lift measurement method compares the 90-day rolling average of branded query impressions in Google Search Console against the 90-day rolling average from 12 months prior, adjusting for organic search volume changes, and attributes the excess above the baseline to AI-driven brand awareness. This method requires at least 12 months of GSC-branded query data to establish a reliable historical baseline. Sites with fewer than 12 months of GSC data use a 6-month comparison but acknowledge that the shorter baseline reduces reliability.
What is the three-component dark traffic estimate structure? The three-component dark traffic estimate structure combines. The behavioral proxy count of Direct sessions matching AI-origin patterns (component one), the branded search lift volume above the historical GSC baseline (component two), and a platform-specific referrer stripping rate estimate based on published or observed platform behavior (component three). Component one produces the lower bound of the dark traffic range. Adding components two and three produces the upper bound. The dashboard reports both bounds together as the estimated dark traffic range.
How often should an AI traffic dashboard be reviewed?
An AI traffic dashboard is reviewed at three frequencies. They are weekly for session trends and investigation triggers, monthly for citation visibility and competitive share-of-voice, and quarterly for configuration validation. Each frequency addresses a different time horizon of change. Session trends change week-to-week. Citation visibility shifts over four-to eight-week cycles. Configuration accuracy degrades over 90-day cycles as new AI platforms emerge and content topics evolve.
What determines the correct review frequency for a specific site? The correct review frequency for a specific site is determined by AI traffic volume and business sensitivity to AI channel changes. A site receiving fewer than 100 AI-referred sessions per month requires only a monthly review because weekly data points are too noisy to be actionable. A site receiving more than 1,000 AI-referred sessions per month requires a weekly review because session drops and engagement rate changes at that volume represent measurable business impact. Sites in competitive verticals where AI citation share-of-voice changes rapidly require citation monitoring review every two weeks rather than monthly.
What does the weekly review checklist contain? The weekly review checklist contains five items. They are: check the AI Traffic session trend for direction and compare to the prior week, check the engagement rate for direction and compare to the 30-day average, scan the landing page breakdown table for pages with session drops above 20%, check whether any investigation trigger from the prior week was resolved, and log one observation or action item for the monthly citation visibility review. The checklist is completed in 15 minutes. Any trigger that fires during the weekly review generates a separate investigation task that sits outside the 15-minute review window.