AI traffic and AI influence are 2 distinct measurement categories that describe how AI search systems affect website performance. AI traffic refers to verified, trackable sessions that originate from AI platform referrals, visits where a user clicked a link inside ChatGPT, Perplexity, Gemini, or a comparable AI interface, and landed on a page with a referrer header intact. AI influence refers to the broader set of brand and decision effects that AI systems produce without generating a measurable click. These effects take forms (zero-click answer citations, brand mentions in AI-generated summaries, and unnamed concept attributions) where content informs an answer but no URL appears. The distinction matters because treating both categories as interchangeable produces measurement errors that cause SEO and AEO reporting to misstate both reach and contribution.
Dark AI traffic occupies a third category that sits between the two. Dark AI traffic consists of sessions that originate from AI platforms but arrive without referrer information, causing GA4 to misclassify them as Direct traffic. Between 20% and 40% of AI-originated sessions travel this path. A site logging 1,000 verified AI referral sessions in GA4 has an estimated 1,200 to 1,667 actual AI-originated visits when dark traffic is factored in. Dark AI traffic is neither cleanly verified AI traffic nor AI influence. It is AI traffic that the measurement stack fails to attribute. Quantifying the dark traffic adjustment is a prerequisite for building an accurate AI traffic figure, and an unremedied dark traffic gap systematically understates AI channel performance.
The zero-click scenario is the core mechanism behind AI influence measurement. Approximately 60% of Google queries ended without a click in 2026, with AI-generated answer panels contributing a significant share of that pattern. AI Overview presence correlates with approximately 58% lower average CTR for the top-ranking page on the same query. When an AI system answers a question using content from a page, the content functions as a source and shapes the user’s understanding and purchasing intent, but no session appears in GA4. This is the attribution gap that makes AI influence a distinct measurement problem rather than a variant of organic search measurement.
The dual measurement framework for AI visibility combines verified AI referral traffic data with estimated AI influence signals into a single reporting structure that keeps the 2 layers clearly separated. Layer one captures verified AI traffic using GA4 custom channel groups, server log analysis, and dark traffic adjustment. Layer two captures estimated AI influence using 3 proxy signal categories, branded search lift, direct traffic pattern shifts, and assisted conversion path analysis, supplemented by citation monitoring data from tools that query AI platforms directly. The 2 layers are never aggregated into a single number. They are reported in parallel, with explicit confidence labels that distinguish measured sessions from estimated influence.
Reporting AI visibility without acknowledging these limitations produces 2 compounding errors. Over-reliance on AI traffic data understates AI-driven brand exposure by ignoring zero-click citations and influence without clicks. Over-reliance on AI influence estimates risks presenting unverified proxy correlations as causal revenue attribution. The dual measurement framework exists specifically to prevent both errors by making the evidence type explicit for every figure in the report.
What Is AI Traffic?
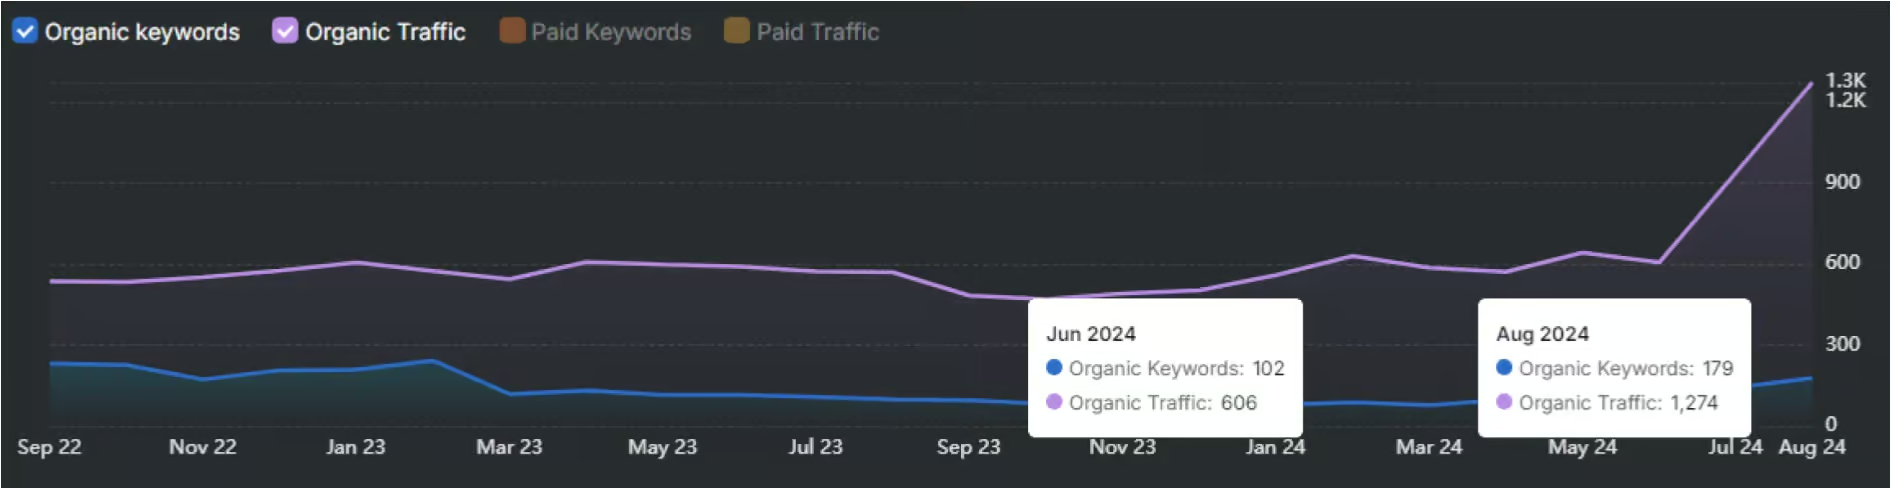
AI traffic is website traffic that originates from a user clicking a link inside an AI platform, where the platform passes a referrer header that identifies the source. AI traffic enters the measurement stack as a GA4 session with a referrer value from a recognized AI domain. GA4 records the session under the referral source identified by that header. ChatGPT, Perplexity, Gemini, Microsoft Copilot, Claude, Grok, Meta AI, You.com, DeepSeek, Phind, and Poe all generate AI traffic when their interfaces include clickable links and users follow them. The defining characteristic of AI traffic is the presence of a referrer. Without the referrer, the session is dark AI traffic or direct traffic, not verified AI traffic. AI traffic is a behavioral metric.
What are the main types of AI traffic? There are 3 main types of AI traffic based on how referrer data is transmitted, classified, and recovered. The first type is verified AI referral traffic. These sessions have the AI platform passing a complete referrer header, GA4 recording the source correctly, and the session appearing in the AI or Referral channel. This is the cleanest and most directly measurable form. The second type is dark AI traffic. These sessions have the referrer stripped in transit, causing GA4 to classify the visit as Direct. This type requires adjustment methods to estimate its volume. The third type is server-log-recovered AI traffic. These sessions are identified from server access logs by matching User-Agent strings or IP ranges associated with AI platform infrastructure, which supplements GA4 data where JavaScript tracking fires late or fails.
What Counts as AI Referral Traffic?
AI referral traffic counts as sessions where a GA4-recognized AI platform domain appears as the referrer source in the session data. A session qualifies as AI referral traffic when the referrer header contains a domain from the recognized AI platform list and the user arrives following a direct click interaction. GA4 recorded these sessions under the Referral channel by default before Google added a native AI Assistants channel to the default channel group in 2025. After that change, GA4 began separating AI platform referrals from generic referral traffic within the default channel grouping.
Which platforms generate AI referral traffic? ChatGPT, Perplexity, and Gemini generate the majority of AI referral traffic, accounting for approximately 98% of LLM referral traffic in 2026 populations. ChatGPT alone accounts for approximately 50% of LLM referral traffic. Perplexity follows as the second-largest source, with Gemini third. Microsoft Copilot, Claude (claude.ai), Grok, Meta AI, You.com, DeepSeek, Phind, and Poe generate the remaining 2% collectively. Perplexity has a notably lower dark traffic rate than ChatGPT due to more consistent referrer passing on desktop. This means Perplexity’s contribution to verified AI traffic is proportionally more accurate relative to its actual send volume than ChatGPT’s contribution, which is systematically undercounted in GA4 due to higher referrer stripping rates.
What is the referrer header, and why does it determine AI traffic attribution? The referrer header is an HTTP request header that the browser sends to identify the URL of the page from which the user navigated, and AI traffic attribution depends entirely on whether this header is present and contains a recognized AI platform domain. When a user clicks a link inside an AI platform interface, the browser sends an HTTP GET request to the destination server. That request includes a Referer header (spelled without the second “r” in the HTTP specification) containing the origin URL or origin domain. GA4 reads this header through its JavaScript tag and records the source dimension.
What Is AI Influence?
AI influence is the effect that AI system outputs have on brand awareness, search behavior, and purchase consideration when those outputs do not generate a click to the influenced page. AI influence operates through 4 primary mechanisms. First, a user reads an AI-generated answer that cites or summarizes content from a page, forms a view about the brand or product described, but does not click through. Second, an AI system names a brand or product in a recommendation without providing a URL. Third, AI-generated content reaches the user through a conversational interface that does not present links as the primary interaction format. Fourth, content from a page informs an AI answer at the model level, through pre-training or retrieval augmentation, without the page being explicitly cited.
Is AI Influence an estimated metric or a measured one? AI influence is an estimated metric, not a measured one. There is no pixel, no session, and no attribution token that marks the moment a user encounters branded content inside an AI response. Measurement relies on proxy signals, observable downstream effects in other data sources that correlate with AI-driven exposure. The gap between AI traffic measurement and AI influence measurement is therefore a gap between measured behavior and inferred behavior.
What forms does AI influence take? There are 4 forms AI influence takes based on the mechanism through which the influence reaches the user. They are listed below.
1. Zero-click citation influence, where an AI platform cites a URL or names a brand in an answer, but the user does not click. The citation exposes the brand to the user without generating a trackable session.
2. Unnamed concept attribution, where AI-generated text incorporates concepts, framings, or conclusions drawn from a page without crediting the source. The user receives the influenced information without knowing its origin.
3. Recommendation exposure, where an AI system names a brand, product, or service as part of a conversational recommendation. The user hears the name and acts on it later through direct search or direct navigation in many cases, but the AI interaction itself is not recorded.
4. Pre-training influence, where content from a page was incorporated into the model’s weights during training, shaping how the model represents concepts and produces answers across all queries. Pre-training influence operates entirely outside real-time attribution.
What Is the Zero-Click Scenario in AI Search?
The zero-click scenario in AI search is the pattern where a user receives a complete answer from an AI system within the search or conversational interface and does not navigate to any external page. The zero-click scenario is the primary mechanism by which AI search reduces organic CTR. Approximately 60% of Google queries ended without a click in 2026, with AI-generated answer panels contributing a significant share. AI Overview presence correlates with approximately 58% lower average CTR for the top-ranking page on queries where it appears. The user receives the information they need from the AI summary.
What happens to attribution in the zero-click scenario? In the zero-click scenario, attribution is lost entirely. No session, referral, or conversion event records the AI system’s role in shaping the user’s information state. The attribution gap in zero-click scenarios is structural, not a configuration problem. No standard analytics tag fires because no page loads. No referrer header is transmitted because no browser navigation occurs. The influence on the user’s knowledge, brand perception, or purchase intent is real and potentially significant, but it produces zero rows in GA4 session data.
What query types produce the most zero-click AI interactions? Informational, definitional, and comparison queries produce the most zero-click AI interactions because AI systems answer these query types with complete responses that require no further source navigation. Queries with clear factual answers (definitions, calculations, dates, named entities) resolve entirely within the AI interface. Comparison queries (product A versus product B) generate structured summaries that satisfy the comparison intent without requiring the user to visit a comparison page. “How to” queries with short procedural answers are complete within the AI-generated steps. Navigational and transactional queries produce lower zero-click rates because they require a destination URL or a specific action that the AI interface alone cannot fulfill.
Why AI Influence Matters for AEO and GEO Reporting?
AI influence matters for AEO and GEO reporting because both disciplines target AI system visibility as a performance outcome, and click-based metrics alone do not measure whether that visibility was achieved. Answer Engine Optimization (AEO) targets the appearance of brand content in AI-generated answers. Generative Engine Optimization (GEO) targets the positioning and frequency of brand mentions within AI-generated content at scale. Both practices aim at outcomes, citations, mentions, and conceptual dominance in AI-generated answers that operate primarily in the zero-click space. A reporting framework built only on GA4 AI referral traffic measures the secondary outcome (clicks that follow AI exposure) rather than the primary outcome (AI citation frequency and brand presence in AI answers).
What role does GEO play in measuring AI influence? GEO plays the role of setting citation frequency benchmarks and brand mention targets that define what AI influence looks like in quantified terms across specific query sets. GEO measurement requires systematic querying of AI platforms using target query sets, recording citation frequency (how often the brand URL appears), brand mention frequency (how often the brand name appears with or without a URL), answer positioning (first citation versus later citations in multi-source answers), and query category coverage (what percentage of target queries produce any brand presence). These metrics form the foundation of AI influence tracking. They are not derivable from GA4 or Google Search Console. They require direct AI platform monitoring. Search Atlas provides AI visibility tracking functionality that addresses this monitoring requirement, covering citation frequency and brand mention rates across AI platforms for target query categories.
What Are the Differences Between AI Traffic vs AI Influence?
AI traffic and AI influence differ across 7 dimensions. They are measurement mechanisms, data sources, attribution confidence, metric types, visibility into zero-click scenarios, relationship to referrer headers, and reporting treatment.
| Dimension | AI Traffic | AI Influence |
| Measurement mechanism | Session tracking via GA4 referrer header | Proxy signal correlation and AI platform monitoring |
| Primary data source | GA4 session data, server logs | Branded search trends, direct traffic patterns, citation monitoring |
| Attribution confidence | High (verified referrer present) | Low to medium (inferred from downstream signals) |
| Metric type | Behavioral (user action recorded) | Estimated (user exposure inferred) |
| Zero-click visibility | None (zero-click produces no session) | Partial (citation monitoring captures zero-click citations) |
| Referrer header dependency | Required for attribution | Irrelevant (no click to attribute) |
| Reporting treatment | Exact counts with dark traffic adjustment | Ranges with confidence tiers |
| Interaction with conversions | Direct, session-based conversion tracking applies | Indirect, assisted conversion path analysis required |
| Response to AEO optimization | Lags (clicks follow citation growth by days or weeks) | Immediate (citation frequency changes reflect optimization faster) |
What unifies AI traffic and AI influence as concepts? AI traffic and AI influence are unified by the fact that both originate from AI system processing of user queries, and both require distinct measurement approaches from traditional organic search metrics. Both concepts exist because AI search systems operate differently from traditional search engines. Traditional organic search produces a SERP, the user scans results, clicks a link, and the click is attributed. AI search systems produce synthesized answers, cite sources selectively, and satisfy many queries without any clicks to any source.
Why the Difference Between AI Traffic and AI Influence Matters?
The difference matters because over-relying on either metric alone produces strategic and reporting errors that misallocate optimization effort and misrepresent AI-driven business impact. An analytics team that reports only AI referral traffic treats AI visibility as a traffic acquisition channel and optimizes accordingly, pursuing click volume rather than citation presence. An AEO practitioner who reports only AI influence estimates risks presenting proxy signal correlations as causal revenue evidence, overstating confidence in unmeasured attribution paths.
What does over-reliance on AI traffic data miss? Over-reliance on AI traffic data misses the zero-click citation audience, the brand reinforcement from unnamed AI mentions, and the contribution of AI visibility to conversion paths that last-touch attribution assigns to other channels. A brand cited frequently in AI answers about its category acquires a presence in users’ awareness before those users visit the site. That awareness shapes branded search behavior. It affects the probability that a user, upon later conducting a direct Google search, chooses the brand’s result over a competitor’s. It affects the probability that a user types the brand URL directly. These downstream behavioral effects appear as branded search volume growth, direct session growth, and assisted conversion path improvements. None of these effects show up in the AI traffic row of a GA4 report.
How does over-reliance on AI influence the risk estimates? Over-reliance on AI influence estimates risks presenting inferred correlations as causal attribution, attaching revenue figures to proxy signals that reflect multiple simultaneous causes. Branded search lift, direct traffic growth, and assisted conversion increases are observable and measurable. What they do not do, on their own, is prove that AI influence caused them. Branded search lift occurs for many reasons (PR coverage, paid media exposure, seasonal demand patterns, competitor exits, and organic ranking gains). A reporting model that attributes all branded search growth above a baseline to AI influence overestimates AI’s contribution.
What Is Dark AI Traffic?
Dark AI traffic is website traffic that originates from an AI platform but arrives without a referrer header, causing GA4 to classify the session as Direct traffic rather than AI referral traffic. Dark AI traffic is AI traffic that the standard analytics stack misattributes. The sessions are real. A user clicked a link inside an AI interface and landed on the destination page. Referrer stripping occurs in transit, before the request reaches the server. GA4 receives the session without source information and applies last-non-direct attribution, or assigns the session to Direct if no prior non-direct touchpoint exists in the user’s session history. The result is that the AI channel’s contribution is systematically understated in GA4 data, and the Direct channel is systematically overstated by an equivalent amount.
What causes referrer headers to be stripped? There are 4 main causes of referrer header stripping that produce dark AI traffic. They are listed below.
1. HTTPS-to-HTTP navigation strips the referrer by default under the browser’s Referrer Policy specification. Navigating from a secure AI platform to a non-secure destination page removes the referrer entirely.
2. AI platform interfaces set Referrer-Policy headers that restrict referrer transmission for privacy or security reasons; platforms that set no-referrer or same-origin policies on their link elements send no referrer to external destinations.
3. Native app and mobile app interfaces (AI platform mobile apps and in-app browser environments) often transmit incomplete or absent referrer data because the app layer intercepts and modifies HTTP headers before sending the request.
4. Intermediary redirects between the AI platform link and the destination URL pass through redirect chains that strip the original referrer at the redirect step, resulting in the destination page seeing the redirecting domain or nothing as the referrer source.
What is the estimated scale of dark AI traffic? Dark AI traffic represents between 20% and 40% of total AI-originated sessions, based on analysis of verified AI referral session populations compared against server log data and UTM-tagged traffic volumes. Perplexity has a lower dark traffic rate than ChatGPT due to more consistent referrer passing on desktop. ChatGPT’s higher dark traffic rate reflects its mobile app’s referrer handling and the behavior of its web interface in certain browser and operating system configurations. The 20-to-40% range represents the practical adjustment factor for sites that lack server-log verification. Sites with server-log access narrow this range by cross-referencing bot-identified AI platform user agents against session data. The practical implication is that no GA4 AI traffic figure is complete without an explicit dark traffic adjustment displayed alongside the verified session count.
Where does dark AI traffic sit between AI traffic and AI influence? Dark AI traffic sits within the AI traffic category. It is misattributed AI traffic, not AI influence, but it requires estimation methods that resemble influence measurement because the sessions are not directly observable in GA4. This positional ambiguity causes measurement errors when analysts categorize dark AI traffic as a form of AI influence. It is not. AI influence describes exposures that never generated a click. Dark AI traffic describes clicks that generated sessions, sessions that arrived but were mislabeled.
How to Measure AI Traffic?
AI traffic measurement requires building a custom GA4 channel group using a regex pattern that matches AI platform domains, combining that data with server log analysis, and applying a dark traffic adjustment to produce an estimated total AI-originated session count. GA4 does not automatically isolate all AI traffic under a single channel with full accuracy before the 2025 AI Assistants channel addition, and even after that addition, the default channel group requires verification and supplementation. A custom channel group applies the full AI platform regex across the entire referral session population, produces a single AI traffic figure that historical data within the retention window recalculates retroactively, and provides a consistent baseline independent of how Google adjusts default channel definitions in future product updates.
What regex pattern captures the primary AI platforms in GA4? The regex pattern that captures primary AI platforms in GA4 is listed below.
chatgpt\.com|chat\.openai\.com|perplexity\.ai|claude\.ai|gemini\.google\.com|copilot\.microsoft\.com|grok\.com|meta\.ai|you\.com|deepseek\.com|phind\.com|poe\.com
This pattern matches the 12 primary AI platforms by their referrer domain strings. The pattern uses escaped dots (\.) to prevent the regex engine from treating the dot as a wildcard. Each platform is separated by the pipe | (OR) operator, so a session referrer matching any of the listed domains is classified as AI traffic. The pattern requires maintenance every 3 to 6 months as new AI platforms gain meaningful traffic share or existing platforms change their subdomain structures. ChatGPT referrals appear under both chatgpt.com and chat.openai.com, depending on the interface and the period, so both variants are included.
There are 5 steps required to build a custom AI channel group in GA4. They are listed below.
- Navigate to Admin in GA4, select the target property, open Data Display, and click Channel Groups. This is the configuration area where custom channel definitions are created and ordered.
- Click “Create new channel group,” name it “AI Traffic Channels,” and add a new channel definition named “AI Referral.” Set the condition type to “Session source” and paste the regex pattern into the condition field, selecting “matches regex” as the operator.
- Set the channel group position above “Referral” in the priority order so that AI platform sessions are captured by the AI Referral definition before the fallback Referral rule matches them.
- Save the channel group and navigate to Reports. Note that GA4 custom channel groups recalculate historical data retroactively within the data retention window (14 months for standard properties, 50 months for 360).
- Build a dedicated Exploration report using the custom channel group as the primary dimension, add Session source/medium as a secondary dimension, and export the first 30 days to establish a baseline before using the data for trend analysis.
What server-side methods measure AI traffic beyond GA4? Server log analysis and UTM parameter enforcement are the 2 primary server-side methods that measure AI traffic beyond what GA4 records. Server log analysis involves parsing web server access logs (Apache, Nginx, or CDN-level logs from Cloudflare, Fastly, or similar) for HTTP requests where the User-Agent string contains identifiers associated with AI platform infrastructure. This approach captures sessions regardless of whether JavaScript fires, a critical gap for single-page applications where GA4 tags load after the initial page request. UTM parameter enforcement requires appending utm_source and utm_medium parameters to links that appear in AI platform interfaces, possible for owned placements (guest posts or partner content), but not for organic AI citations where the platform generates the link without UTM parameters. A third supplementary method is referrer log comparison. Cross-referencing GA4 referral sessions against server log referral entries to identify sessions that the server recorded as AI-referred but GA4 classified as Direct due to JavaScript tag timing failures.
What are the 5 key metrics to track within the AI traffic channel? The 5 key metrics to track within the AI traffic channel are listed below.
- Verified AI referral sessions per period, with the dark traffic adjustment range displayed alongside the raw GA4 figure.
- Session engagement rate for AI-referred traffic, compared against organic search engagement rate as a benchmark (AI-referred visitors show bounce rates of 30 to 45% versus 50 to 65% for organic, and pages per session of 2.4 to 3.1 versus 1.6 to 2.0 for organic).
- Goal completion rate and conversion rate for AI-referred sessions, broken down by AI platform source to identify which platforms send the highest-intent traffic.
- Top landing pages receiving AI referral traffic, tracked week-over-week to identify which content types and topics attract AI platform citations that convert to clicks.
- Period-over-period growth rate of the AI traffic channel versus the growth rate of organic search, to monitor whether AI platforms are substituting for or supplementing traditional organic click volume.
How to Measure AI Influence Without Click Data?
AI influence measurement without click data relies on 3 proxy signal categories, branded search behavior changes, direct traffic pattern analysis, and assisted conversion path tracking, supplemented by AI citation monitoring from platforms that query AI systems directly. Proxy signals are observable effects in measurable data sources that AI-driven exposure is likely to produce. None of the 3 categories constitutes direct attribution of AI influence to a business outcome. Each category measures a downstream effect that AI influence is one plausible cause of among several. The measurement framework uses all 3 categories together because convergence across multiple independent proxy signals provides stronger evidence than any single signal in isolation.
What is branded search lift, and how does it indicate AI influence? Branded search lift is an increase in Google Search Console impressions and clicks for queries that include the brand name. It indicates AI influence when the lift occurs without a corresponding increase in paid branded search spend or known PR activity that would explain the growth independently. Branded search lift reflects users who encountered the brand name through some exposure channel and subsequently searched for it on Google. AI citations that name a brand in a response (whether or not the URL is included) place the brand name in front of users who were not previously aware of it. Those users sometimes follow up with a branded Google search. The measurement procedure involves setting a branded search baseline in Search Console using brand name query filters, monitoring monthly branded impression and click volume, and calculating the lift percentage relative to a pre-AI-visibility baseline period.
What direct traffic patterns indicate AI influence? Direct traffic growth that correlates temporally with AI citation volume increases. That is concentrated on informational pages rather than branded homepage navigation, indicating AI influence as a plausible contributing cause. Direct traffic is the channel most directly affected by referrer stripping and dark AI traffic. A portion of direct session growth during a period of AI visibility increase represents dark AI traffic that lost its referrer. Beyond the dark traffic component, genuine direct navigation growth reflects users who encountered the brand in an AI context and navigated directly without conducting a branded search. The analytical procedure distinguishes AI-influenced direct growth from baseline direct growth by isolating the direct traffic growth attributable to informational landing pages, pages that users are unlikely to type directly or bookmark, and therefore unlikely to reach via organic direct behavior, and correlating that growth with AI citation periods established through citation monitoring.
What are assisted conversion paths, and how do they show AI influence? Assisted conversion paths show AI influence when AI referral sources appear as early-touch or assist-touch interactions in multi-touch conversion sequences, indicating that AI platform exposure preceded the converting session even when the final conversion came through a different channel. GA4’s path exploration and attribution reports record the sequence of sessions and sources that precede a conversion event. An AI referral session that occurs at session one of a four-session conversion path does not receive credit in last-touch attribution but appears as an assist in multi-touch analysis.
What citation monitoring data supplements proxy signals for AI influence? Citation monitoring data supplements proxy signals by providing direct evidence of when, how frequently, and in what context AI platforms cite or mention the brand. That transforms proxy signal interpretation from correlation-only to correlation with a confirmed AI activity baseline. Without citation monitoring, branded search lift and direct traffic growth are interpretable as AI influence but cannot be distinguished from competing explanations. With citation monitoring, the analyst has a record of actual AI citation events, dates, query categories, citation frequency, and brand mention positioning that is placed alongside proxy signal timelines to evaluate whether the signals co-vary with citation activity.
How to Build a Dual Measurement Framework for AI Traffic and AI Influence?
There are 5 steps to building a dual measurement framework for AI traffic and AI influence, and they are listed below.
1. Build Layer One: Verified AI Referral Traffic
Layer one is built by configuring the GA4 custom AI channel group, extracting verified AI referral session counts, and applying the dark traffic adjustment range to produce a total estimated AI-originated session figure.
How many numbers produce layer one? Layer one produces 3 numbers. The raw verified session count from GA4, the estimated dark traffic range (20% to 40% of the verified count), and the total estimated AI-originated session range (verified count plus dark traffic range). These 3 numbers are the foundation of the AI traffic layer. Every subsequent trend analysis, conversion rate calculation, and channel comparison in the report uses the verified session count for exact metrics and presents the estimated total range as context for understanding GA4’s structural undercount.
What dark traffic adjustment does layer one require? Layer one requires adding a dark traffic adjustment line that presents the GA4 verified figure alongside the estimated total range, calculated by applying a 20-to-40% uplift to the verified session count.
How to calculate adjustments? The adjustment calculation is direct. A verified GA4 AI session count of 1,000 sessions produces a dark traffic estimate of 200 to 400 sessions (20 to 40% of 1,000), yielding an estimated total of 1,200 to 1,400 sessions. Sites with server log access narrow this range by comparing server-log-identified AI referral requests against GA4 session counts for the same period. The server log comparison produces a site-specific dark traffic rate that replaces the 20-to-40% default range with a measured range. The dark traffic adjustment is a required element of every layer one report. Presenting the verified GA4 figure alone, without the adjustment, understates AI traffic and misrepresents the channel’s true contribution.
What server log data does layer one incorporate? Layer one incorporates server log data as a verification and narrowing input that cross-references GA4 session counts against HTTP request logs to identify sessions that the server recorded as AI-referred, but GA4 classified differently.
What does the server log analysis for layers involve? The server log analysis for layer one involves filtering access logs by referrer header for AI platform domains, counting the matching requests as a separate AI referral count, and comparing that count against the GA4 verified session count for the same time period. The gap between the server log count and the GA4 count represents sessions that the server identified as AI-referred but that GA4 did not record under the AI channel, a combination of dark AI traffic, JavaScript tag failures, and bot traffic that the server logged but GA4 filtered. Sites that integrate server log data into the layer one report 3 figures. GA4 verified sessions, server-log-identified AI sessions, and the overlap and gap between the two sources.
2. Build Layer Two: Estimated AI Influence Signals
Layer two is built by establishing baselines for branded search volume, direct traffic to informational pages, and assisted conversion frequency, then tracking percentage changes in those baselines alongside AI citation monitoring data. Layer two does not produce a session count or a revenue figure. It produces trend indicators, directional signals that describe whether AI influence appears to be increasing or decreasing relative to established baselines, and whether proxy signal trends correlate with citation monitoring activity.
How does branded search lift measurement work in layer two? Branded search lift measurement in layer two works by extracting branded query impression data from Google Search Console, calculating a 12-week rolling average baseline, and tracking weekly percentage deviation from that baseline alongside citation monitoring records.
How does direct traffic pattern analysis work in layer two? Direct traffic pattern analysis in layer two works by segmenting direct sessions by landing page type, isolating direct growth on informational pages from direct growth on navigational pages (the homepage and branded product pages), and correlating informational-page direct growth with AI citation periods.
How does assisted conversion tracking work in layer two? Assisted conversion tracking in layer two works by building a GA4 path exploration that segments converting users by whether their conversion path included an AI referral session, and calculating the conversion rate differential between the AI-assisted path segment and the non-AI-assisted segment.
What does the path exploration configuration require? The path exploration configuration requires defining the conversion event (lead form submission, purchase, trial signup), setting the look-back window to 30 days, and filtering for paths that include a session source matching the AI platform regex. The output is a comparison table showing the conversion rate for users with at least one AI referral session in their 30-day path versus users with no AI referral session in the same period. A conversion rate differential of 5 percentage points or more in favor of the AI-assisted path segment is interpretable as evidence that AI referral exposure correlates with higher conversion probability, supporting an AI influence attribution inference.
3. Combine GA4, Search Console, and Citation Monitoring
The 3 sources are combined by aligning all data to a shared weekly timeline, placing verified AI session counts (GA4), branded search lift percentages (Search Console), and citation frequency records (citation monitoring) in parallel columns of a single reporting table. The parallel presentation is the mechanism that prevents accidental data mixing. Each source occupies its own column. No figures from separate columns are added together. The reporting table shows, for each week. GA4 verified AI sessions, estimated total AI sessions with dark traffic range, Search Console branded lift percentage versus rolling average, Search Console non-branded AI query impression trend, and citation frequency from AI platform monitoring. The analyst reads across rows to identify co-variation patterns rather than computing a combined total.
What does the three-source combination produce that no single source provides? The three-source combination produces a corroborated AI visibility picture. Periods where GA4, Search Console, and citation monitoring simultaneously show AI-consistent patterns carry higher interpretive confidence than periods where only one source shows a change.
What does GA4 alone show? GA4 alone shows verified clicks but not zero-click influence. Search Console alone shows query impressions but conflates AI and non-AI query patterns without segmentation. Citation monitoring alone shows citation activity but not downstream behavior. The combination allows the analyst to construct a narrative: “During the week of [date], AI referral sessions increased by X% (GA4), branded search impressions increased Y% above baseline (Search Console), and citation monitoring recorded the brand appearing in Z% of monitored AI responses for the target query category, the highest recorded rate.” That narrative is interpretively stronger than any single data point because 3 independent sources co-vary in the same direction.
4. Separate Verified AI Traffic From Estimated AI Influence
Verified AI traffic and estimated AI influence are kept separate by placing them in distinct report sections with different confidence labels, and by never summing or averaging figures from the two layers in the same calculation. The report structure assigns layer one (verified AI traffic) to a section labeled “Measured: AI Referral Traffic” and layer two (estimated AI influence) to a section labeled “Estimated: AI Influence Signals.” Each section opens with a single sentence describing the confidence level of the data it contains. Layer one data carries the label “measured, session counts from GA4 with dark traffic adjustment.” Layer two data carries the label “estimated, proxy signal correlations, not causal attribution.” The labels are present on every page of the report, not only in an introductory footnote.
What is the risk of mixing verified and estimated figures in the same report row? The risk is that stakeholders read both figures as equivalent in confidence, draw causal revenue conclusions from estimated proxy signals, and make budget and strategy decisions based on overstated AI attribution.
What does mixing create? Mixing creates a false equivalence. A report row that shows “AI sessions: 1,200 | AI influenced conversions: 340” implies both numbers have the same evidentiary basis. The 1,200 is a measured GA4 session count. The 340 is an inference derived from assisted conversion path differentials, a legitimate proxy measure, but one that carries uncertainty not present in the session count. A stakeholder reading a combined table has no mechanism to distinguish the two confidence levels. The downstream decision error is budget allocation to AI-channel optimization based on a revenue attribution figure that the data does not actually support.
5. Report Cadence for AI Traffic and AI Influence Metrics
The correct reporting cadence is weekly data collection and monthly formal reporting for both layers, with a 90-day review cycle that recalibrates baselines and updates the dark traffic adjustment factor. Weekly data collection for GA4 AI sessions, Search Console branded lift, and citation monitoring frequency is the minimum frequency needed to detect trend breaks quickly. Monthly formal reporting aggregates the weekly data into period comparisons and presents layer one and layer two side by side with confidence labels. The 90-day review cycle updates the rolling baselines used for branded search lift calculation, refreshes the dark traffic adjustment factor using any new server log data, and recalibrates the AI platform regex pattern if new platforms have gained material traffic share.
What triggers an out-of-cycle review? An out-of-cycle review is triggered by any single-week change of 25% or more in verified AI sessions, a sudden disappearance of a major AI platform from the referral source list, or a citation monitoring alert indicating that brand citations dropped to near-zero for a target query category.
What Are the Best Practices for Reporting AI Traffic and AI Influence?
The 3 best practices for reporting AI traffic and AI influence are listed below.
1. Use Proxy Signals Alongside Session Data
Proxy signals are used alongside session data by presenting them in a dedicated estimated-influence section of the report with explicit confidence labels, never aggregated with session counts or expressed as a session-equivalent figure. The correct placement of proxy signals is in layer two, separated from layer one session data by a clear report section boundary and a confidence level statement. Proxy signals function as directional indicators. They describe whether AI influence appears to be increasing, stable, or decreasing. They do not produce revenue attribution figures or session-equivalent counts without additional modeling that carries explicit uncertainty intervals.
What baseline requirements make proxy signals meaningful? 4 baseline requirements make proxy signals meaningful for AI influence estimation.
- A minimum of 12 weeks of pre-measurement baseline data for each proxy signal type, collected before the AI visibility program being measured began, to establish a normal variation range and avoid mistaking pre-existing trends for AI-driven effects.
- A documented list of known confounders for each baseline period, paid branded search spend changes, PR campaigns, major product launches, seasonality events, so that proxy signal lifts occurring during confounded periods are flagged rather than attributed to AI.
- A citation monitoring start date that precedes the proxy signal measurement period by at least 4 weeks, so that citation frequency data is available to contextualize early proxy signal movements.
- A weekly data collection discipline is maintained without gaps, because proxy signal baselines computed from months with missing weeks introduce errors that compound in rolling average calculations.
2. Monitor AI Citations Independently From Referral Traffic
AI citation monitoring is conducted by systematically querying AI platforms with a defined set of target queries, recording citation and mention data in a structured log that is maintained separately from GA4 referral data and never merged with it. Citation monitoring operates on the output side of AI systems. It measures what the AI platform says, not what users do after reading it. GA4 referral data operates on the input side of the website. It measures what users do when they click. The 2 datasets answer different questions and require different collection methods. Merging them produces measurement artifacts.
What specific data does AI citation monitoring produce? There are 4 types of data that AI citation monitoring produces.
- Citation frequency rate. The percentage of monitored queries for a target category that return a response citing the brand URL, expressed as a weekly or monthly figure for trend tracking.
- Brand mention rate. The percentage of monitored queries that include the brand name in the response text, regardless of whether a URL citation appears, distinguishing named influence from URL-level citation.
- Citation position. Whether the brand URL appears as the first citation, a middle citation, or a later citation in multi-source AI responses is relevant because first citations receive proportionally more user attention.
- Hallucination rate. The percentage of AI citations that point to non-existent or incorrect URLs on the brand domain is a data quality indicator that affects the reliability of click-based attribution from AI citations.
3. Build Reporting Models Around Attribution Ranges
Reporting models for AI visibility are built around 3 confidence tiers that correspond to 3 evidence types, and each tier presents its figures as ranges rather than point estimates to reflect the actual precision of the underlying measurement. The 3 confidence tiers in the attribution range model are listed below.
- Tier one covers verified AI sessions, GA4-confirmed referral sessions with the dark traffic adjustment applied, presented as an exact count plus an estimated total range.
- Tier two covers corroborated AI influence signals, proxy signal measurements that co-vary with citation monitoring data, presented as directional percentage changes relative to baseline.
- Tier three covers inferred AI influence, proxy signal observations without concurrent citation monitoring confirmation, presented explicitly as unconfirmed signals requiring further data before interpretation.
What does presenting attribution ranges accomplish in stakeholder reporting? Presenting attribution ranges in stakeholder reporting prevents overconfident AI attribution from becoming embedded in budget decision-making processes, where it would cause strategic misallocation. Attribution ranges communicate honest measurement capability. A reporting model that presents tier one data (verified sessions) alongside tier two data (corroborated influence signals) alongside tier three data (unconfirmed signals) in separate rows with explicit confidence labels gives stakeholders the information they need to weight each data type appropriately.
How AI Search Changes Attribution and Analytics?
AI search changes attribution and analytics by fragmenting the query-to-session path into cases where a click occurs and cases where it does not, making traditional last-touch and even multi-touch session-based attribution incomplete for measuring the full contribution of content to business outcomes. Traditional search attribution worked because every organic session started with a click. The click created a session, the session had a source, and the source was attributable to a piece of content or a keyword ranking. AI search breaks this chain in 2 places. First, answers satisfy queries without clicks, and the content contributes to the user’s information state without creating a session. Second, when clicks do occur, the referrer header is stripped in 20% to 40% of cases, creating sessions without attributable sources. Both failure modes produce the same outcome in GA4. An organic or direct session that carries no AI provenance signal. Analytics built for a click-based world undercount AI channel contribution by a factor that grows as AI search share grows.
What does AI search do to organic search performance metrics? AI search reduces organic CTR, compresses click volume for informational queries, and inflates direct session counts through dark AI traffic, causing traditional organic search performance metrics to understate total content reach while appearing to show a stable or declining organic channel.
The mechanism is query-type selective. Informational queries, which historically produced high impression counts and moderate CTR, now frequently resolve inside AI interfaces without generating clicks. Google Search Console continues to record impressions for queries where the site appears in AI Overviews or is indexed as a potential AI source, but CTR drops because the click is not required. The organic impression count holds steady or grows while click volume falls, producing a misleading CTR decline signal that looks like a ranking quality problem rather than an AI-driven behavioral change.
What new attribution signals does AI search require? There are 4 new attribution signals that AI search requires to supplement traditional session-based analytics.
- AI citation frequency. The rate at which AI platforms cite the brand in responses to target query categories is tracked through direct AI platform monitoring rather than derived from click data.
- AI-influenced branded search lift. The incremental growth in branded query impressions above baseline that correlates with AI citation periods, extracted from Search Console and adjusted for known confounders.
- Dark traffic adjustment factor. The estimated multiplier applied to verified GA4 AI sessions to account for referrer-stripped sessions misclassified as Direct, derived from server log cross-referencing or the 20-to-40% default range.
- Assisted conversion AI path rate. The percentage of converting user paths that include an AI referral session, extracted from GA4 path exploration reports, quantifies the AI channel’s contribution to conversion sequences beyond last-touch attribution.
What Are the Limitations of AI Traffic and AI Influence Measurement?
There are 5 main limitations of AI traffic and AI influence measurement. They are listed below.
- Referrer data loss. 20-40% of AI-originated sessions lose their referrer header in transit, producing a structural undercount in GA4 that no analytics configuration fully remediates.
- Zero-click structural invisibility. AI-mediated exposures that do not generate clicks produce no session data whatsoever, making direct measurement impossible and requiring proxy signal inference.
- Hallucination contamination. Between 3% and 13% of URLs cited in AI responses are hallucinated, meaning a portion of AI citation monitoring data attributes clicks to pages that were never actually cited.
- Benchmark instability. AI platform referrer behavior, citation patterns, and answer format change frequently enough that baselines established 6 months ago no longer accurately reflect current platform behavior.
- AI system opacity. The mechanism by which AI platforms select sources, weight citations, and generate answers is not fully disclosed, making it impossible to determine whether optimization actions caused observed citation changes or whether platform algorithm shifts caused them independently.
What does the referrer data loss limitation mean practically? The referrer data loss limitation means that every AI traffic figure reported from GA4 alone is a minimum estimate, not a true count, and that the gap between the GA4 figure and the true figure is not precisely knowable without server log verification. The practical implication is that AI traffic is systematically undercounted in every analytics platform that relies on browser-transmitted referrer headers. The 20-to-40% dark traffic range is the best available estimate of the undercount magnitude, but it is a range derived from measured population analysis, not a site-specific calculation. A site in a niche where users predominantly access AI platforms through mobile apps faces a higher dark traffic rate than a site whose AI-referred traffic comes predominantly from desktop Perplexity users.
What does benchmark instability mean for goal-setting? Benchmark instability means that AI traffic and AI influence performance goals set for one quarter become structurally unachievable or unexpectedly easy to achieve in the next quarter due to platform behavior changes outside the practitioner’s control. AI platforms change referrer policies, citation formats, answer structures, and URL inclusion patterns as they update their products. A platform that passes referrer headers consistently in Q1 reduces referrer passing in Q2 during a privacy policy change, causing a step-change drop in verified GA4 AI sessions that is indistinguishable from a genuine reduction in AI referral traffic without server log verification.
What Common Mistakes Break AI Attribution Reporting?
There are 5 common mistakes that break AI attribution reporting. They are listed below.
1. Confusing Dark AI Traffic With AI Influence
Confusing dark AI traffic with AI influence breaks AI attribution reporting because dark AI traffic is recoverable AI session data that belongs in layer one, while AI influence describes exposures without clicks that belong in layer two. Treating them interchangeably inflates the estimated influence figure with sessions that belong in the verified traffic count.
When does an analyst classify dark AI traffic as AI influence? The measurement framework double-counts the AI channel’s contribution. Dark AI traffic represents real sessions that arrived from AI platforms but lost their referrer. Those sessions are already captured (incompletely) in GA4’s Direct channel. Counting them as AI influence signals in layer two adds them a second time, inflating the influence estimate by the volume of dark traffic. The correct treatment is to apply the dark traffic adjustment in layer one and exclude those adjusted sessions from all layer two proxy signal calculations.
What is the practical test for distinguishing dark AI traffic from AI influence? The practical test is whether the interaction produces a session. Dark AI traffic produced a session that was misattributed. AI influence produced no session at all. The test applies at the individual interaction level. A user who clicked a ChatGPT link and arrived at a page produced a session. That session is dark AI traffic if the referrer was stripped, or verified AI traffic if the referrer was intact. A user who read a Perplexity answer citing a brand, found the answer sufficient, and did not click produced no session. That non-session interaction is AI influence. The distinction is binary and observable at the session level. Any activity that produced a GA4 session is AI traffic (verified or dark), regardless of what channel GA4 assigned it to. Any activity that produced no GA4 session is a potential AI influence.
2. Treating AI Influence as Proven Revenue Attribution
Treating AI influence as proven revenue attribution breaks AI attribution reporting because proxy signals are correlated with multiple possible causes, and attaching revenue figures to them without confidence qualifications misrepresents the evidentiary basis of the attribution claim.
Are branded search lift, direct traffic growth, and assisted conversion rate improvements real and measurable? Branded search lift, direct traffic growth, and assisted conversion rate improvements are real and measurable. What they do not prove, by themselves, is that AI influence caused them. Each signal reflects multiple simultaneous causes. Presenting a branded search lift of 15% as “AI-driven revenue of $X” requires a causal chain. AI citation exposure caused branded awareness, branded awareness caused branded search, branded search caused conversions, which the proxy signal data supports only weakly and only under assumptions that are not verifiable from analytics data alone. The claim is plausible but not proven. Reporting it as proven corrupts the reporting framework’s credibility and risks producing strategic decisions based on inflated AI attribution.
How does this mistake manifest in stakeholder reporting? This mistake manifests as a single-row “AI-influenced revenue” figure in a dashboard that combines proxy signal inferences with session-based conversion data to produce a total that appears to be measured but is largely estimated. The specific presentation pattern is a revenue or conversion table where “AI Referral” conversions (layer one, measured) appear in the same format as “AI Influenced” conversions (layer two, estimated), with both rows summed at the bottom to a total “AI-Driven Revenue” figure. A stakeholder reading this table has no mechanism to identify which rows are measured and which are estimated. They read the total as a measured figure. Subsequent budget requests and channel allocation decisions reference that total. The decision-making process becomes dependent on an attribution figure whose confidence level was never accurately communicated.
3. Using AI Crawler Activity as Evidence of AI Visibility
Using AI crawler activity as evidence of AI visibility breaks AI attribution reporting because AI crawler visits are bot requests that reflect indexing activity, not user interactions, and high crawler frequency does not correlate with citation frequency or AI referral traffic volume. GPTBot (OpenAI’s crawler), ClaudeBot (Anthropic’s crawler), PerplexityBot, and Google’s extended AI crawlers visit pages to index content for potential inclusion in AI training data or retrieval systems. A crawler visit records a bot request in the server log. It does not indicate that the page was cited in an AI response, that a user saw the page content in an AI answer, or that the page generates AI referral traffic.
What does a dashboard that mixes crawler and referral data produce? A dashboard that mixes AI crawler data with AI referral session data produces a false AI visibility metric, an inflated count that makes pages appear to have AI channel performance they do not actually have. The specific error appears when server log analysis counts GPTBot and ClaudeBot requests as evidence of “AI engagement” and adds that count to GA4 AI referral session counts. The resulting combined metric has no coherent meaning. It sums bot indexing activity with human user session activity. The practical consequence is that pages receiving heavy AI crawler activity appear to be AI-visible in the dashboard, even if they generate no AI citations and no AI referral traffic. Optimization decisions based on this metric direct effort toward pages that AI crawlers index rather than pages that AI systems cite and users visit.
4. Overstating Attribution Confidence
Overstating attribution confidence breaks AI attribution reporting by embedding inflated certainty into baseline figures that future analyses reference, causing subsequent period-over-period comparisons to be built on overconfident foundations. Attribution confidence is overstated when estimated proxy signals are reported without confidence qualifications, when dark traffic adjustments are presented as exact figures rather than ranges, or when correlation-based AI influence estimates appear alongside measured session counts without differentiation. Each instance of overstated confidence becomes a data point in the historical record. Future reports compare against those data points as if they were measured facts. The compounding effect is a reporting history where the confidence level of historical figures is unknown, making trend analysis unreliable.
How is attribution confidence correctly stated? Attribution confidence is correctly stated across 3 tiers that correspond to the evidentiary basis of each figure. The tiers are listed below.
- Tier one confidence (high). Verified GA4 AI referral sessions, exact counts, labeled as “measured.” The limitation stated alongside is: “Verified minimum, actual AI-originated sessions estimated 20-40% higher due to dark traffic.”
- Tier two confidence (medium). Proxy signal measurements that co-vary with citation monitoring data, presented as percentage changes relative to baseline, labeled as “estimated, directional indicator.” The limitation stated alongside is: “Multiple causes possible, directional signal only, not causal attribution.”
- Tier three confidence (low). Proxy signal observations without citation monitoring corroboration, presented as preliminary observations, are labeled as “unconfirmed, requires corroboration before attribution.” Tier three figures are excluded from all revenue and conversion attribution calculations.
5. Ignoring Multi-Touch Conversion Paths
Ignoring multi-touch conversion paths breaks AI attribution reporting because AI referral sessions appear predominantly as early-touch or mid-funnel assists rather than last-touch conversions, and last-touch attribution therefore assigns near-zero AI channel conversion credit while the channel is contributing materially to conversion paths. AI referral sessions are high-engagement, high-intent visits that frequently precede a conversion by several sessions. The AI platform delivers a discovery or consideration touchpoint. The user converts later via branded search, direct navigation, or retargeted paid interaction. Last-touch attribution records the final touchpoint’s channel as the conversion source. The AI referral session, which appeared earlier in the path, receives no conversion credit.
What is the magnitude of the multi-touch attribution gap? The multi-touch attribution gap for the AI channel is measurable through GA4 path exploration, in populations where AI referral sessions have been isolated and analyzed. AI-assisted conversion paths show conversion rates 5-15 percentage points higher than non-AI-assisted paths for the same user acquisition cohorts. The 5-to-15 percentage point differential is not a universal figure. It varies by industry, content type, and AI platform mix. It represents the directional magnitude observed in path exploration analyses of sites with significant AI referral traffic. The practical implication is that last-touch attribution assigns AI channel credit for only the fraction of AI-assisted conversions where the AI referral session happened to be the final session before conversion.
Why AI Visibility Does Not Always Produce Clicks?
AI visibility does not always produce clicks because AI interfaces are designed to satisfy queries within the interface itself, and a complete answer removes the user’s motivation to navigate to the source. The design architecture of conversational AI interfaces prioritizes answer completeness over source navigation. An AI platform that answers “What is dark AI traffic?” with a complete 3-paragraph definition citing a brand as the source has fulfilled the user’s query. The user’s goal, understanding dark AI traffic, is achieved. The citation appears in the response, the brand name is visible, but the user has no information gap that requires clicking through. The click to the source page is optional. For a user who found the answer adequate, no click occurs. The brand received citation exposure. Zero sessions appeared in GA4.
What query types produce the most zero-click AI interactions? Definitional, instructional, and factual comparison queries produce the most zero-click AI interactions. That’s because AI systems answer these query types with responses complete enough that source navigation is unnecessary.
Why AI Attribution Is Never Fully Precise?
AI attribution is never fully precise because the combination of referrer data loss, zero-click invisibility, and AI system opacity creates irreducible uncertainty gaps that no analytics configuration eliminates. The 3 uncertainty sources are independent and additive. Referrer data loss creates a gap in AI traffic measurement. Zero-click invisibility creates a gap in AI influence measurement. AI system opacity means that even when citations are observed, the mechanism, pre-training influence, retrieval augmentation, and editorial scoring that caused the citation are unknown, making it impossible to attribute citation changes to specific optimization actions with confidence. These gaps exist at the level of the underlying technology and data architecture. Better tooling narrows them but does not close them.
What does accepting attribution imprecision mean for reporting practice? Accepting attribution imprecision means building reporting models that present confidence tiers and ranges rather than point estimates, and communicating to stakeholders that AI attribution is a directional indicator system rather than an exact accounting system. The reporting practice implication is structural. Reports present tier one data (verified sessions) as exact counts with stated measurement limitations. Tier two data (corroborated influence signals) is presented as directional percentages with explicit “estimated” labels. Tier three data (unconfirmed signals) is flagged as preliminary and excluded from attribution calculations until corroborated.
How AI Search Changes SEO Performance Measurement?
AI search changes SEO performance measurement by making click volume an incomplete proxy for content reach, requiring practitioners to supplement traditional ranking and traffic metrics with AI citation, AI influence, and dark traffic adjustment metrics.
What does traditional SEO measurement track? Traditional SEO performance measurement track 4 primary signals. They are keyword rankings, organic impressions (Search Console), organic sessions (GA4), and organic-attributed conversions. These 4 signals formed a complete picture when every relevant search query produced a SERP with clickable results, and users clicked those results to find answers. AI search disrupts the measurement completeness of this framework at the query-to-click step. A page ranks in position one on a query where AI Overview is present and receive 58% fewer clicks than the same position on a non-AI-Overview query. The ranking metric shows strong performance. The traffic metric shows compression. The gap between the two is the AI-driven CTR discount.
What new metrics does AI search add to SEO performance measurement? There are 4 new metrics that AI search adds to SEO performance measurement. They are listed below.
- AI citation rate. The percentage of monitored AI platform queries for a target topic category that return a response citing the brand or a specific page, measured through direct AI platform monitoring.
- AI Overview presence rate. The percentage of target queries where Google AI Overviews appear, measured through position tracking tools that flag AI Overview presence alongside ranking data.
- AI-channel CTR discount. The ratio of actual organic CTR to expected organic CTR on queries with AI Overview presence, calculated from Search Console CTR data segmented by query type and AI feature presence.
- AI-assisted conversion path rate. The percentage of all converting users whose conversion path included at least one AI referral session in the look-back window, calculated from GA4 path exploration reports.
Does an AI Citation Without a Click Count as AI Influence?
Yes. An AI citation without a click counts as AI influence because the citation exposes the brand to the user and affects their subsequent awareness, search behavior, and purchase consideration even without generating a tracked session. A zero-click AI citation is the definitional case of AI influence. The AI system cited the brand. The user saw the citation. The user’s information state changed. The user now knows the brand exists, knows the brand was cited as a source on the query topic, and holds an updated opinion about the brand’s relevance or authority in the category. None of that information state change is measurable directly. The citation is the evidence that the exposure occurred. The downstream behavioral effects appear as branded search lift, direct navigation, or AI-assisted conversion path activity.
What evidence confirms that zero-click AI citations produce real influence? The evidence that confirms zero-click AI citations produce real influence is the co-variation between citation monitoring data and branded search lift measurements observed in analyses of sites with documented AI citation history. Sites that track AI citation frequency and branded search trends simultaneously observe that periods of high AI citation frequency correlate with periods of above-baseline branded search lift. The correlation is not causal proof. It is a consistent association across multiple independent observation periods, consistent with the hypothesis that AI citations drive brand awareness that subsequently manifests as branded search behavior.
Does High AI Crawler Activity Mean a Page Has AI Influence?
No. High AI crawler activity does not mean a page has AI influence because AI crawlers index content for training and retrieval purposes, and indexing frequency does not determine citation frequency in AI-generated responses. A page with daily GPTBot visits is indexed frequently and never cited in a user-facing AI response in many cases. A page with infrequent GPTBot visits is retrieved through cached index data and cited frequently in other cases. The crawl frequency reflects the AI system’s assessment of the page’s crawl priority. Its freshness, update frequency, and technical accessibility. It does not reflect the page’s relevance or citation worthiness for specific query categories. Citation decisions in AI systems are driven by relevance scoring, content quality assessment, and query matching at response generation time, not by crawl recency.
What data correctly indicates AI influence, as opposed to AI crawler activity? AI citation monitoring data, branded search lift measurements, and assisted conversion path analysis correctly indicate AI influence. These are the 3 data types that reflect user exposure to AI-generated content, not bot-level indexing activity. AI citation monitoring queries AI platforms directly with representative queries and records whether the brand appears in the response. This data reflects the output that users see, not the indexing infrastructure that processes the site. Branded search lift reflects user behavior changes that follow AI exposure. Assisted conversion path analysis reflects conversion behavior changes traceable to AI referral sessions. All 3 data types operate at the user interaction level. AI crawler data operates at the infrastructure level and is correctly used for technical crawlability assessment, confirming that AI platforms index the site, not for AI influence measurement.