It’s frustrating when your campaigns aren’t delivering the results you expect, and the first step to improvement is to analyze your Google Ads performance and find the issue. 🔍
With the right insights, you can maximize ROI, fine-tune your bidding strategies, and ensure your ads hit the mark every time.
From identifying the right KPIs to using advanced PPC tools, we’ll show you how to evaluate and improve your campaigns in 2025.
4 Steps to Analyze Your Google Ads Performance
Breaking down Google Ads performance doesn’t have to be complicated. Follow these steps to analyze your campaigns, spot what’s working, and make data-driven improvements.
1. Set Clear Campaign Goals
Clear goals serve as the foundation for your campaign strategy, influencing everything from audience targeting to budget allocation. They enable you to measure success accurately and make data-driven adjustments.
Here’s how you should go about it:
- Define Specific Objectives: Common goals include increasing website traffic, generating leads, or boosting sales. Once you know your goal, use it to tailor your campaign structure and messaging.
- Ensure Measurability: Set objectives that can be quantified, such as aiming for a 20% increase in conversions over three months. This allows for precise tracking and assessment.
- Align with Business Goals: Your campaign objectives should support broader business aims. For example, if brand awareness is a priority, focus on metrics like impressions and reach.
- Utilize AI and Automation: Leverage AI-powered tools for tasks like bidding and targeting to enhance efficiency and effectiveness. However, maintaining oversight to it still aligns with your goals.

2. Choose Key Performance Indicators (KPIs)
KPIs act as navigational tools and help you assess the effectiveness of your advertising strategies. By focusing on relevant KPIs, you can identify strengths, uncover areas needing improvement, and make informed decisions to boost your return on investment (ROI).
We will talk more about metrics later, but here are some general rules on choosing them:
- Align with Campaign Objectives: Ensure KPIs align with goals. For brand awareness, prioritize impressions and reach. For sales growth, focus on conversion rate and cost per acquisition.
- Prioritize Actionable Metrics: Select KPIs that offer insights you can act upon. Metrics such as Click-Through Rate (CTR) and Quality Score not only indicate performance but also suggest areas for optimization.
- Consider Industry Benchmarks: Compare your chosen KPIs against industry standards to gauge competitiveness. This context helps in setting realistic targets and understanding market positioning.
- Limit the Number of KPIs: Focus on a manageable set of key metrics, and it’ll be easier to adjust your strategy. Otherwise, you may just end up overwhelmed.
3. Spot Underperforming Ads
An ad is underperforming if key metrics indicate low engagement, high costs, or poor conversions. Here’s what to watch for:
- Low CTR: If your ad isn’t getting enough clicks, it may not be relevant or compelling. Compare it to industry benchmarks.
- High Cost-Per-Click (CPC): If your CPC is too high without delivering strong conversions, your ad might not be competitive.
- Low Quality Score: A low score (under 6) signals issues with ad relevance, expected CTR, or landing page experience.
- Poor Conversion Rate: If people click but don’t take action, your ad or landing page might need adjustments.
- High Cost-Per-Conversion: Spending too much per conversion means your ad isn’t efficiently driving results.
- Low Impression Share: A low percentage suggests your ad isn’t competitive in auctions, possibly due to budget, bid strategy, or ad relevance.
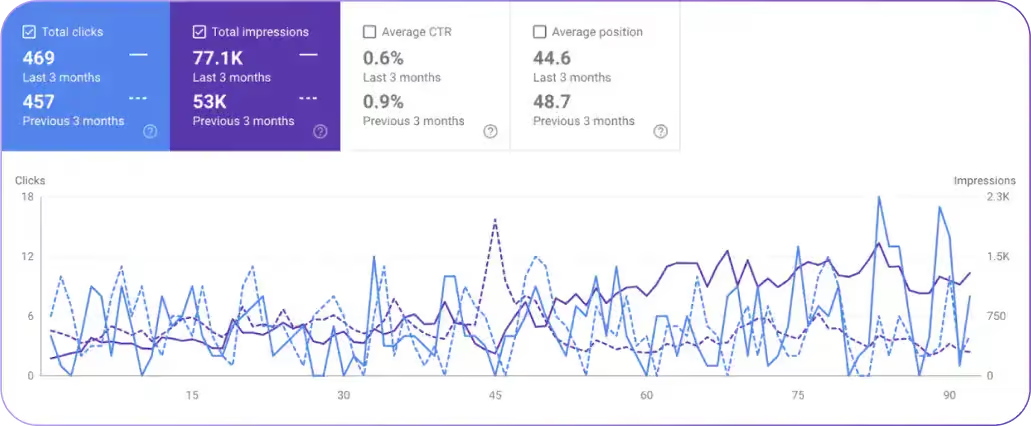
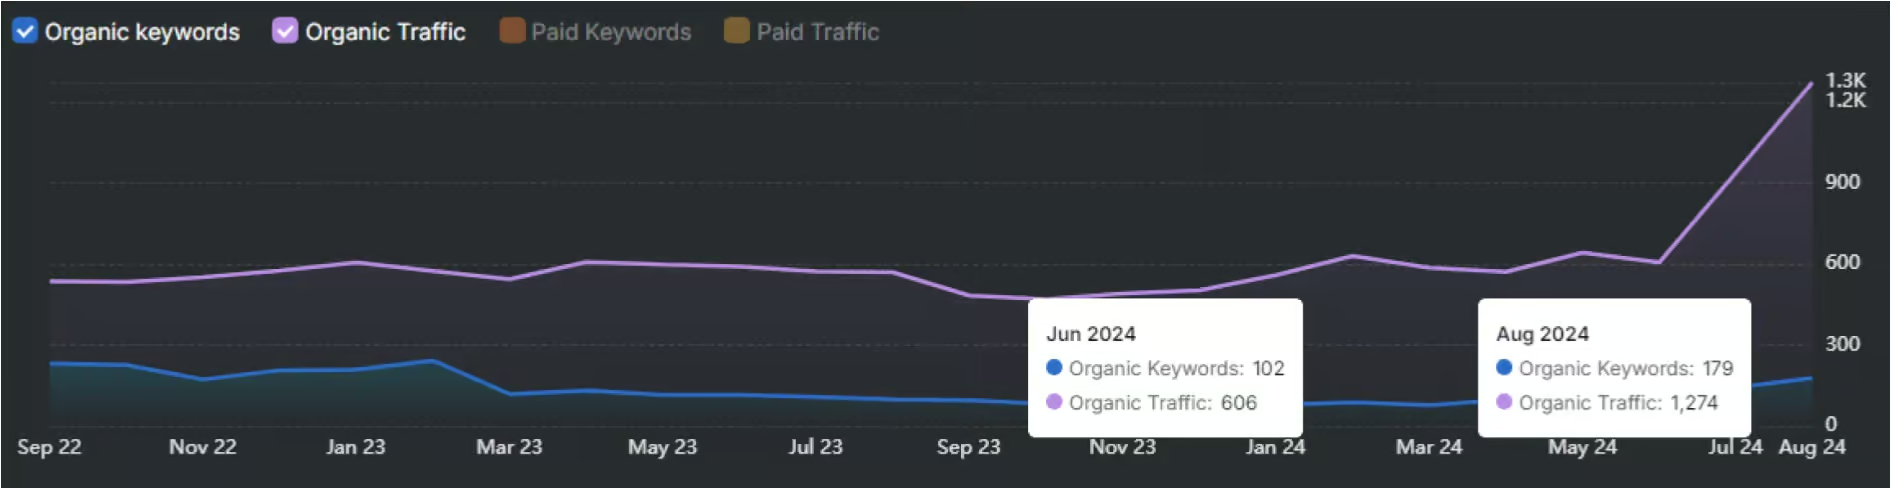
 Use Search Atlas’ GSC integration to check traffic, CTR, impressions, Google Analytics metrics, and much more.
4. Adjust Bidding and Budgeting Strategies
To get the most out of your Google Ads campaigns, you need to regularly adjust your bidding and budgeting strategies. Once you fine-tune these elements, it will be easier to control costs and improve your overall ROI.
Besides choosing the right bidding strategy for your business goal, you can also refine ad scheduling to run ads during peak performance hours. ⌚
This ensures you’re spending your budget when it’s most likely to drive results.
Finally, review your daily or monthly budgets to ensure they align with your goals. Shift funds between campaigns based on performance—more budget for the high-performers and less for underperforming ones.
 OTTO interface for Google Ads management, allowing users to easily activate or pause campaigns with a single click for streamlined ad performance control.
What Google Ads Metrics Should I Pay Attention To?
We will go through the most important Google Ads metrics that show you ad quality, effectiveness, and the financial results of your campaigns. 💰
You’ll also see how to interpret the value of each metric.
Click-Through Rate (CTR)
CTR shows how often people click on your ad after seeing it. If 100 people see your ad and 10 click, that’s a CTR of 10%.
A high CTR means your ad is grabbing attention and is relevant to your audience, while a low CTR could mean your ad copy isn’t compelling or you’re targeting the wrong people.
How will you know whether your CTR is low or high?
Look for the average in your industry, as what is average in one industry could be pretty bad in another. For example, fashion has an average CTR of 1.88% for search ads, while travel is much higher at 5.22%.
Quality Score
Google gives each of your keywords a Quality Score from 1 to 10 based on how relevant and useful your ad, keywords, and landing page are. A high Quality Score (7-10) can lower your costs and improve your ad position, while a low score (1-3) suggests your ad isn’t matching user intent well.
Google doesn’t share an official “good” Quality Score benchmark, but aiming for 7 or higher is a solid goal.
Landing Page Bounce Rate
Your quality score, CTR, and landing page experience will determine the quality of your ads and affect your Ad Rank.
While these first two factors are easier to measure, landing page experience is a bit more complex. Bounce rate is a bit more complicated to interpret in this case.
So, bounce rate tells you the percentage of visitors who leave your landing page without taking any action. If someone clicks on your ad but exits immediately, that’s a bounce.
Bounce rate can be tricky to interpret because it doesn’t always tell you why users are leaving your landing page. A high bounce rate could mean the page isn’t engaging, the content doesn’t match user expectations, or there’s a technical issue—but it could also mean users found what they needed quickly and left satisfied.
A low bounce rate seems like a good thing, but if people are just clicking on another part of your site (like your homepage logo) without taking meaningful action, it can give a false sense of success.
So while it’s important to look at this metric, you should always view it together with other engagement metrics: like time on page, conversions, or where users go next.
Engagement Rate
Engagement rate measures how often people interact with your ad—whether that’s clicking, watching a video, or engaging in some other way. A high blog engagement rate means your ad is resonating with viewers, while a low rate suggests it’s not grabbing attention.
Since engagement varies based on ad format and industry, there’s no universal benchmark, but improving your ad’s relevance and appeal can boost this metric.
Conversion Rate
Conversion rate is the percentage of people who complete a desired action, like making a purchase or filling out a form, after clicking on your ad. If your ad gets 100 clicks and 5 results in a sale, that’s a 5% conversion rate.
A high rate means your ad and landing page are effective, while a low rate suggests something is off, either with your offer, audience targeting, or website experience.
The average conversion rate across industries is around 4.61%, but again, you need to look at numbers in your industry to know for sure.
Cost Per Conversion
Cost per conversion (also called cost per acquisition or CPA) tells you how much you’re paying for each successful action (like a sale or a lead).
If you spend $100 on ads and get 10 conversions, your CPA is $10. A high CPA means you’re paying more to get customers, which could hurt profitability, while a low CPA means your ads are driving cost-effective results. The average cost per lead in Google Ads is around $34.61., but this varies widely by industry.
Return on Ad Spend (ROAS)
ROAS measures how much revenue you earn for every dollar spent on ads. If you spend $100 on Google Ads and make $500 in sales, your ROAS is 5x. A high ROAS means your ads are profitable, while a low ROAS suggests you may need to optimize your campaigns.
On average, businesses can earn up to $8 for every $1 spent.
Cost Per Click (CPC)
CPC is how much you pay each time someone clicks on your ad. If you spend $50 and get 10 clicks, your CPC is $5.
A lower CPC means you’re getting traffic at a cheaper rate, which is great for budget efficiency. A higher CPC could mean your keywords are competitive or your Quality Score is low. CPC varies by industry, so checking benchmarks can help you see how you compare.
Impressions
Impressions count how many times your ad is shown. High impressions mean your ad has strong visibility, while low impressions might mean your budget or bidding strategy needs adjusting. However, impressions alone don’t guarantee clicks or conversions—you still need a compelling ad to get results.
Ad Rank
Ad Rank determines where your ad appears in search results. It’s calculated based on your bid, Quality Score, and expected impact of your ad.
A higher Ad Rank means better placement, while a lower rank may push your ad down the page or prevent it from showing at all. Improving your Quality Score and bidding competitively can help boost your rank. 📈
Search Impression Share
Search Impression Share shows the percentage of times your ad appeared versus how often it could have appeared. If your impression share is 50%, your ad showed up for half of the relevant searches it was eligible for.
A low impression share might mean your budget is too small or your bids aren’t high enough, while a high share means you’re dominating the search results.
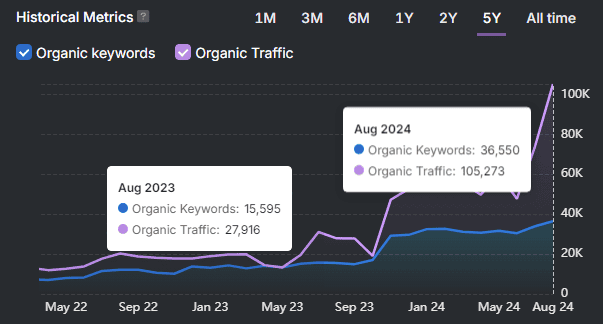
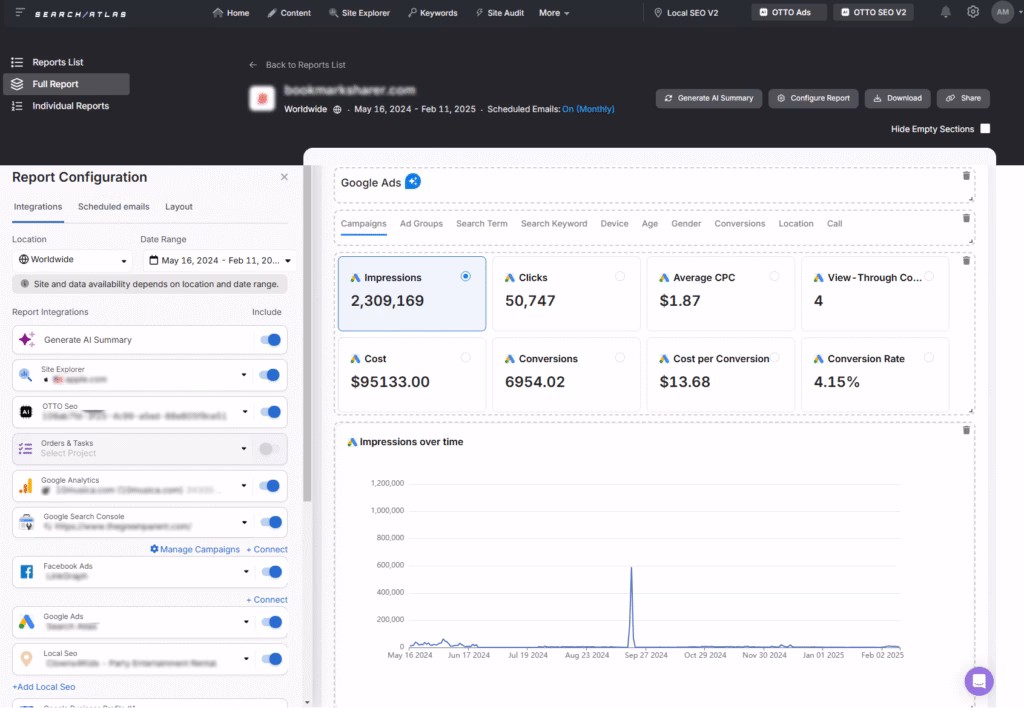
 Get AI-powered overviews and deeper insights from your Google Ads with the Search Atlas reporting tool.
Tools for Analyzing and Optimizing Your Google Ads Performance
Like any craft, Google Ads requires a set of tools. We’ll go through a mix of Google and third-party tools you can use to get the best performance.
Google Analytics
Google Analytics gives you a deeper look at what happens after someone clicks your ad—so you’re not just seeing clicks and impressions but actual user behavior.
With Google Analytics, you can track which ads drive the most engaged visitors, where they drop off, and what actions they take on your site. This helps you refine your targeting, landing pages, and even ad messaging.
One of the best features is goal tracking. You can set up conversions like form submissions, purchases, or time spent on a page to see which ads truly deliver results. You can also analyze bounce rates and engagement metrics to figure out if your landing page needs improvement.
 Via Google Ads
By linking Google Ads with Google Analytics, you can compare different traffic sources, segment audiences, and retarget visitors who didn’t convert the first time. The more insights you gather, the smarter your ad optimizations become.
Google Ads Reporting Tools
Google Ads reporting tools give you detailed insights into your campaign performance, helping you make data-driven decisions to improve your ROI. Tracking key metrics like CTR, conversions, and CPC lets you see what’s working and where to optimize.
To get started, navigate to the “Insights & reports” section in your Google Ads account. Use predefined reports to quickly analyze common performance metrics, or customize reports in the Report Editor by dragging and dropping the data points that matter most to your goals.
Another must-have tool is the Search Terms Report. It shows the actual searches triggering your ads. Once you have the report, you can identify irrelevant terms and optimize match types to improve targeting.
For consistent tracking, set up automated report delivery to your inbox.
Smart Ads
If you’re struggling to make sense of Google Ads metrics, OTTO’s Report Builder delivers clear, customizable reports with AI-powered summaries, making insights easy to share.
It tracks key performance indicators like conversion rates, cost per conversion, and clicks while also pulling in SEO, Facebook Ads, and Google Business Profile data for a full marketing overview. Reports can even be scheduled and sent automatically, keeping clients informed without extra effort.
Here’s what OTTO GA does to simplify data-driven campaign success:
- Report Builder Tool: Automates, customizes, and schedules reports for easy client communication.
- AI-Powered Campaign Creation: Builds structured, ready-to-launch campaigns in minutes.
- Smart Keyword Selection: Targets high-performing keywords for better reach.
- Optimized Ad Copy: Generates compelling, conversion-focused messaging.
- Google Ads Extensions: Enhances ads with sitelinks, callouts, and structured snippets.
- Real-Time Tracking & Optimization: Continuously analyzes performance and refines campaigns for better ROI.
Besides being an excellent Google Ads reporting tool, it’s the first tool that also automates the entire Google Ads process.
 Search Atlas has earned multiple accolades from the Gartner Digital Markets brands: Capterra, Software Advice, and GetApp.
Track and Optimize Your Google Ads Performance with AI
Take the hassle out of campaign management with Smart Ads. This powerful automation tool fine-tunes your ads in real time, optimizes bidding, and ensures smarter budget allocation—all while keeping you in full control. 🕹️
Want better results? Try Smart Ads now for free with Search Atlas and easily track all your key metrics for improved performance.
No commitment—cancel anytime!