Traditional search engine optimization (SEO) governs how brands capture visibility in organic search results. Generative engine optimization (GEO) determines how brands appear in AI-generated answers. Both systems shape digital discoverability, but it remains unclear whether industries are experiencing a measurable redistribution of visibility from traditional search toward AI-driven discovery.
SEO professionals and researchers debate whether AI-generated answers are supplementing organic search or replacing it. Some industries show declining SEO performance alongside rising AI visibility, while others remain strong across both ecosystems. The missing piece is large-scale longitudinal evidence showing how SEO performance trends and GEO visibility strength diverge across industries simultaneously.
This study analyzes 13 months of SEO performance data from January 2025 through January 2026, paired with GEO performance metrics derived from over 120 million AI citation instances. The SEO dataset covers 25,685 domains. The GEO dataset spans over 6.4 million domains across 61 industries. A matched subset of 20,543 domains that appear in both datasets enables a direct comparison of historical SEO trends with current AI visibility strength.
The findings reveal that GEO does not replace SEO uniformly across industries. Instead, visibility redistributes unevenly toward AI-generated ecosystems, with some sectors maintaining a strong AI presence while others experience weakening performance across both systems.
Methodology – How Was Industry Visibility Redistribution Measured?
This study measures how industries transition between traditional search visibility and AI-generated discovery. The analysis evaluates whether declining SEO performance aligns with stronger GEO visibility across 61 industries over 13 months.
This analysis matters because it reveals whether AI systems supplement traditional search visibility or increasingly redistribute discoverability away from organic search ecosystems. Understanding how SEO and GEO interact shows where industries maintain digital visibility, where visibility shifts toward AI-generated answers, and where overall discoverability weakens across both systems.
The dataset integrates 2 primary components listed below.
- SEO Performance Dataset. A longitudinal dataset of 25,685 SEO tracked domains mapped to industry classifications. The dataset includes monthly impressions, traffic, CTR, and ranking position metrics.
- GEO Performance Dataset. A domain-level dataset covering more than 6.4 million domains derived from more than 120 million AI citation instances. The dataset measures total AI mentions, average AI visibility, query coverage, share of voice, and rank metrics across generative answer systems.
Domains were deduplicated and cleaned before analysis. GEO domains were matched to industries through the SEO domain industry mapping. A matched subset of 20,543 domains appearing in both datasets enables direct comparison of historical SEO trends with present AI visibility strength.
This process produced a matched industry-level dataset prepared for longitudinal visibility analysis. The analytical steps are listed below.
- Calculate industry-level SEO performance trends across impressions, traffic, and CTR using linear regression slopes over time.
- Standardize SEO trend slopes using z-scores and compute a composite SEO Trend Score for each industry.
- Aggregate GEO metrics across total AI mentions, average visibility, and query coverage.
- Standardize GEO metrics using z-scores and compute a composite GEO Strength Score for each industry.
- Compare SEO Trend Score against GEO Strength Score to identify visibility redistribution patterns.
- Validate findings using side-by-side SEO and GEO rankings, trend visualizations, and correlation analysis.
- Industries with insufficient domain representation were excluded from trend ranking to reduce statistical noise.
The analysis relies on 2 composite variables to measure visibility redistribution across industries. The target variables are listed below.
- SEO Trend Score. A standardized composite of regression slopes for impressions, traffic, and CTR that measures the direction and strength of each industry’s organic performance over time. A lower score indicates a steeper decline. A higher score indicates stability or growth.
- GEO Strength Score. A standardized composite of total mentions, average visibility, and query coverage that measures relative AI visibility strength. A positive score indicates a stronger-than-average AI presence. A score near zero indicates average AI presence. A negative score indicates underperformance relative to other industries.
Industries were segmented into 4 visibility transition patterns based on SEO Trend Score and GEO Strength Score. The classification framework is defined below.
- Channel Shift Industries. Declining SEO performance with strong GEO visibility, indicating visibility redistribution toward AI systems.
- At-Risk Industries. Declining SEO performance with weak GEO visibility, indicating visibility loss across both ecosystems.
- Double Winners. Stable or growing SEO performance alongside strong GEO visibility, indicating broad digital dominance.
- SEO-Dominant Industries. Strong SEO performance with weaker GEO visibility, indicating continued dependence on traditional search.
This framework operationalizes visibility redistribution across SEO and GEO ecosystems. It identifies where visibility is redistributing, where risk is emerging, and where industries remain dependent on traditional search.
What Is the Final Takeaway?
The analysis shows that the shift from SEO to GEO is measurable but uneven across industries. Correlation between SEO decline and GEO strength remains weak across the 61 industry datasets, confirming that visibility redistribution toward AI systems is industry-specific rather than universal.
The strongest channel shift appears in service-driven and consumer-action industries. Construction & Contracting, Retail & Shopping, IT Services, Professional Services, and Healthcare combine declining SEO performance with strong GEO visibility. Discovery in these sectors is not disappearing. Discovery is redistributing toward AI-generated answers and conversational interfaces.
Double Winners maintain strong visibility across both ecosystems. Repair & Maintenance, Plumbing, Legal, and Manufacturing show stable or growing SEO performance alongside strong GEO strength, indicating broad digital resilience rather than dependence on a single discovery channel.
In contrast, informational, institutional, and content-heavy sectors show weakening performance across both systems. Media Production, Education, and Banking & Lending display declining SEO performance with weak GEO strength, signaling net visibility risk rather than migration toward AI visibility.
SEO-Dominant industries continue to rely heavily on traditional search visibility. Cannabis Dispensary, Travel & Tourism, and Beauty & Personal Care maintain stable or improving SEO performance while lagging in GEO strength, indicating slower adaptation to AI-driven discovery ecosystems.
These findings confirm that GEO functions as a compensatory visibility channel rather than a universally additive one. GEO strength frequently appears where SEO declines are steepest, reinforcing that AI visibility increasingly operates as a parallel discovery layer.
These findings confirm that GEO functions as a parallel discovery layer that compensates for SEO decline in some industries while exposing others that have not yet adapted to AI-driven visibility models. Industry-level analysis provides the clearest framework for identifying where visibility redistributes, where risk concentrates, and where GEO adaptation becomes most critical.
How Is SEO Performance Distributed Across Industries?
Manick Bhan, together with the Search Atlas research team, analyzed 13 months of SEO performance data from 25,685 domains to measure how organic visibility, traffic, and engagement are distributed across 61 industries.
The breakdown to show how industries perform within traditional search is outlined below.
Industry Representation in SEO
This analysis measures how industries are represented within the traditional search ecosystem. Domain count matters because it acts as a structural indicator of how heavily each sector participates in organic search visibility.
The headline results are shown below.
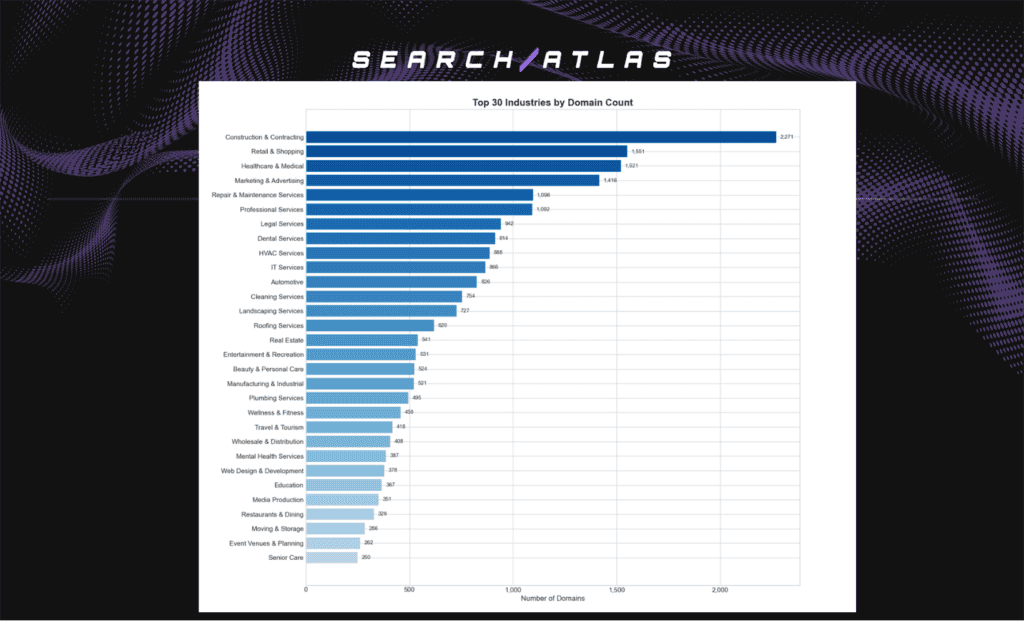
Industry participation in SEO is highly uneven, with domain representation varying nearly 10x between the largest and smallest industries shown.
- Construction & Contracting holds the largest domain footprint, indicating broad digital participation across this sector.
- Retail and Healthcare show substantial representation, reflecting strong consumer-facing search demand.
- Legal, Dental, HVAC, and Professional Services form a large service-driven mid-tier, confirming a strong SEO presence among local and intent-driven industries.
SEO Visibility Distribution
This analysis measures where search visibility concentrates across industries and how effectively sectors convert exposure into clicks. Impressions measure search exposure volume. Traffic measures how much engagement industries generate from that visibility.
The headline results are shown below.
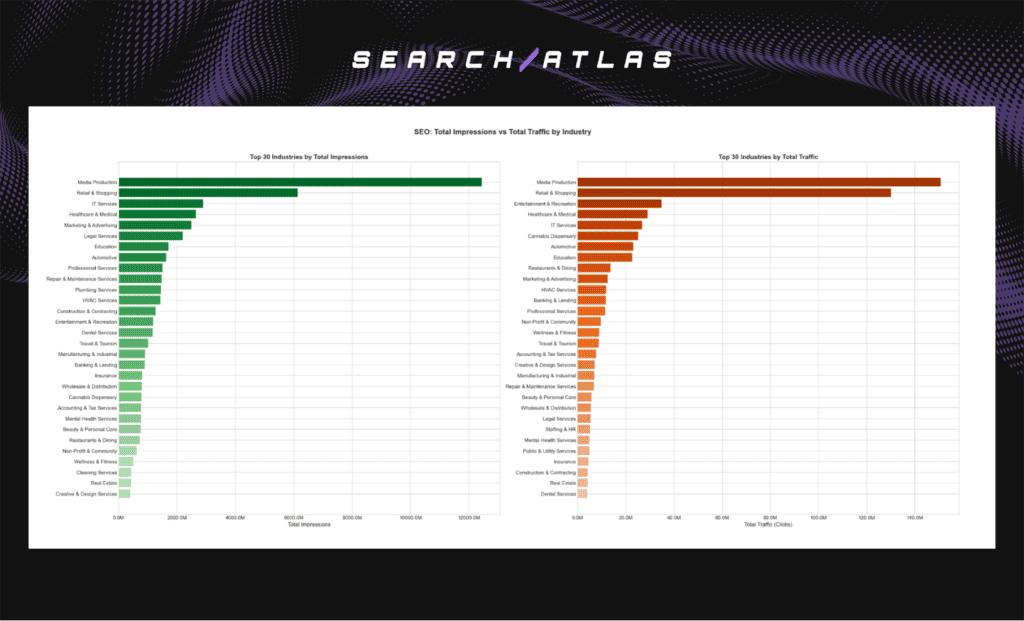
- Media Production and Retail & Shopping dominate both impressions and traffic, indicating strong visibility and engagement across traditional search ecosystems.
- Several industries maintain high impression volume but comparatively lower traffic, confirming that visibility does not always translate proportionally into clicks.
- Entertainment & Recreation and Healthcare appear more prominently in traffic rankings than impression rankings, indicating stronger engagement efficiency relative to visibility volume.
- Organic search visibility concentrates heavily within a limited number of industries, with a small group of sectors capturing disproportionate search demand.
SEO Engagement Efficiency
This analysis measures how efficiently industries convert search exposure into user engagement. CTR matters because it reflects how strongly search results align with user intent within each industry. Unlike impressions and traffic, which measure volume, CTR functions primarily as a quality and relevance signal.
The headline results are shown below.
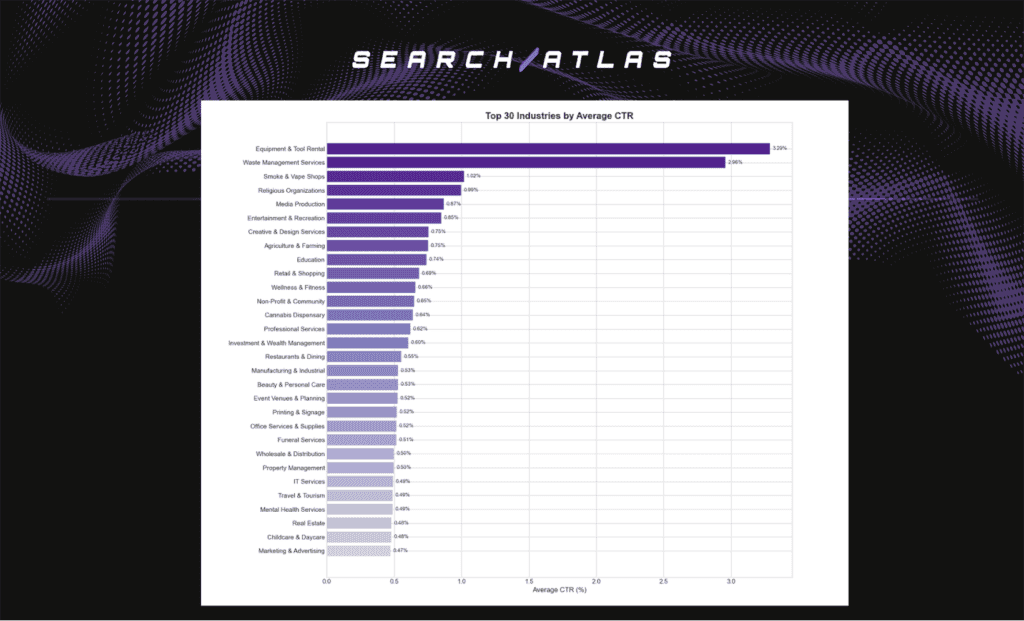
Search Atlas SEO tool displaying industry CTR data.
- Niche and intent-specific industries achieve the highest CTR performance.
- Retail and Media do not dominate CTR rankings despite high visibility volume.
- CTR variation remains narrower than impressions and traffic variation across industries.
CTR leaders differ markedly from high-impression industries, confirming that visibility volume does not necessarily translate into engagement efficiency.
Niche and intent-specific industries show stronger query alignment, while broad consumer sectors generate a larger visibility scale with lower engagement efficiency.
CTR remains more stable across industries than impressions or traffic, reinforcing that engagement quality behaves differently from exposure volume.
SEO Performance Trends Over Time
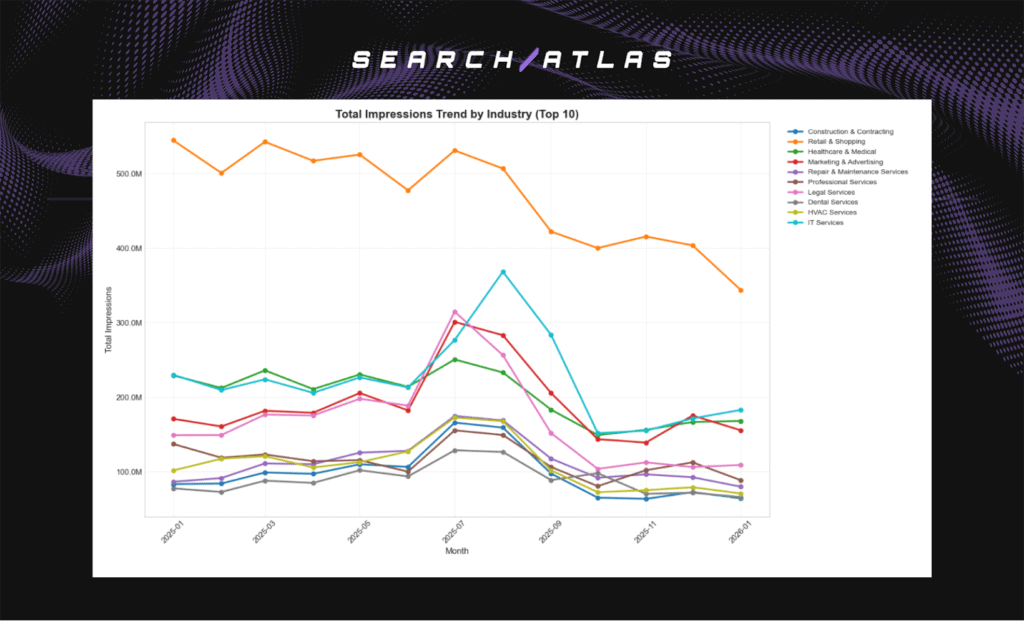
This analysis measures how traditional search performance evolves monthly across impressions, traffic, and CTR. Temporal trends matter because they reveal whether industries are gaining or losing organic visibility strength over time.
The headline results are shown below.
Impressions Trend
Traffic Trend
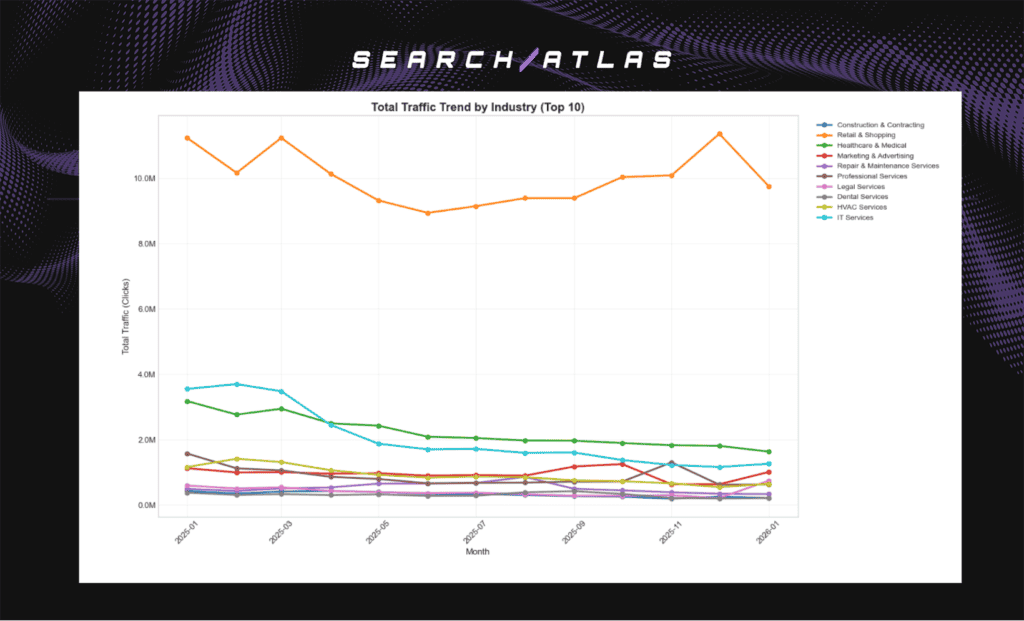
CTR Trend
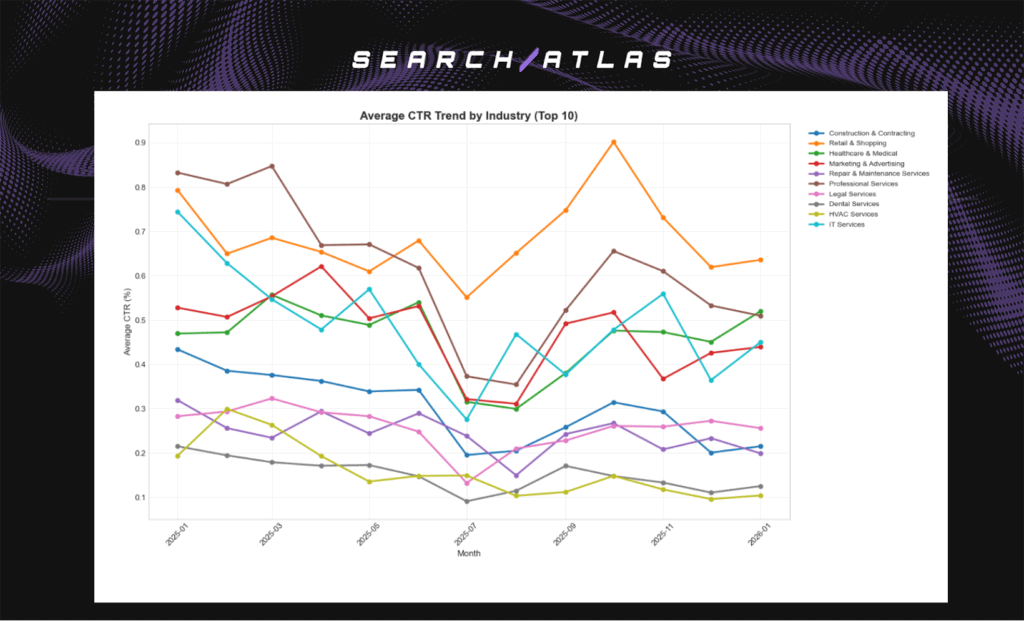
SEO industry CTR trend analysis with Search Atlas software.
- Most industries peak mid-year before declining in impressions and traffic.
- Retail & Shopping follows the same downward trajectory despite maintaining the largest visibility and traffic volumes.
- Impressions and traffic fluctuate more heavily than CTR across most industries.
- Industries (IT Services and Legal Services) maintain relatively stable CTR despite declining impressions and traffic.
The majority of sectors show rising visibility early in the study period, followed by broad reductions in impressions and clicks, confirming cross-industry organic exposure decline rather than isolated sector-specific changes. CTR trends remain comparatively stable across industries, indicating that click-through behavior does not consistently mirror visibility volume changes.
Industry SEO Performance Trend Rankings
SEO Trend Score measures the direction and strength of organic performance across industries over time. The ranking identifies which sectors show accelerating growth versus sustained organic decline.
The headline results are shown below.
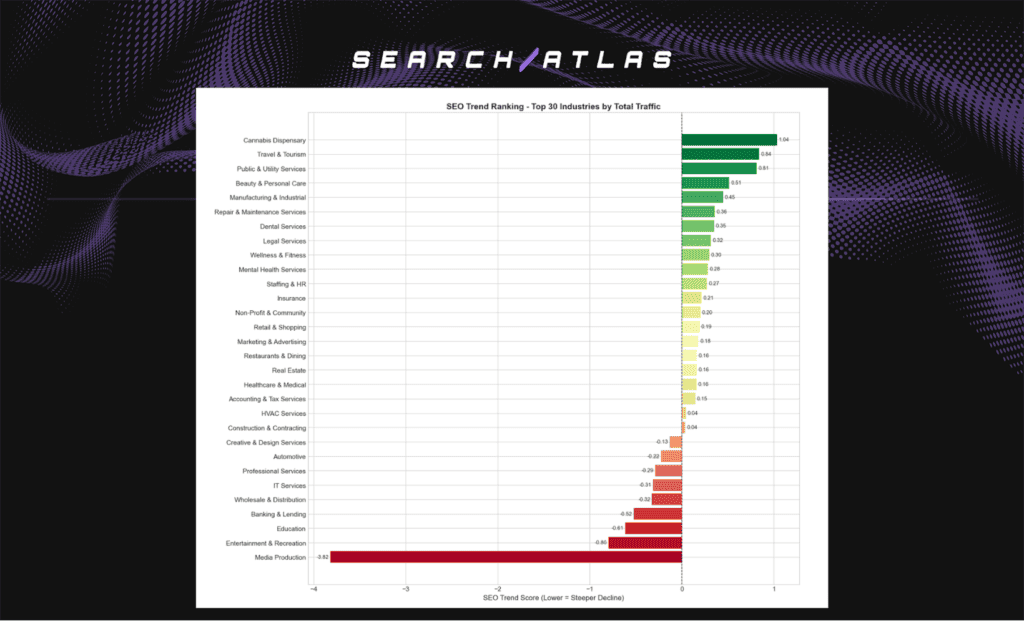
Visual of SEO trend ranking for industries using the Search Atlas software.
- Travel, Beauty, Cannabis, and Public Services show the strongest upward SEO momentum.
- Manufacturing, Repair, Dental, and Legal maintain steady but moderate SEO growth.
- Banking, Education, IT, and Wholesale show concentrated organic visibility decline.
- Media Production shows the steepest decline among high-traffic industries.
SEO performance diverges significantly across industries, producing a clear separation between growth-oriented and declining sectors. Consumer and lifestyle industries maintain the strongest positive momentum, while B2B, institutional, and media-heavy industries experience the strongest structural pressure on organic visibility.
How Is GEO Presence Distributed Across Industries?
Manick Bhan, together with the Search Atlas research team, analyzed GEO performance data from more than 6.4 million domains derived from over 120 million AI citation instances to measure how AI visibility distributes across 61 industries.
The breakdown to show how industries perform within generative AI ecosystems is outlined below.
GEO Query Coverage and Average Visibility
This analysis measures GEO presence across 2 dimensions. Query coverage measures how widely industries appear across AI-generated responses. Average visibility measures how prominently industries appear when cited.
The headline results are shown below.
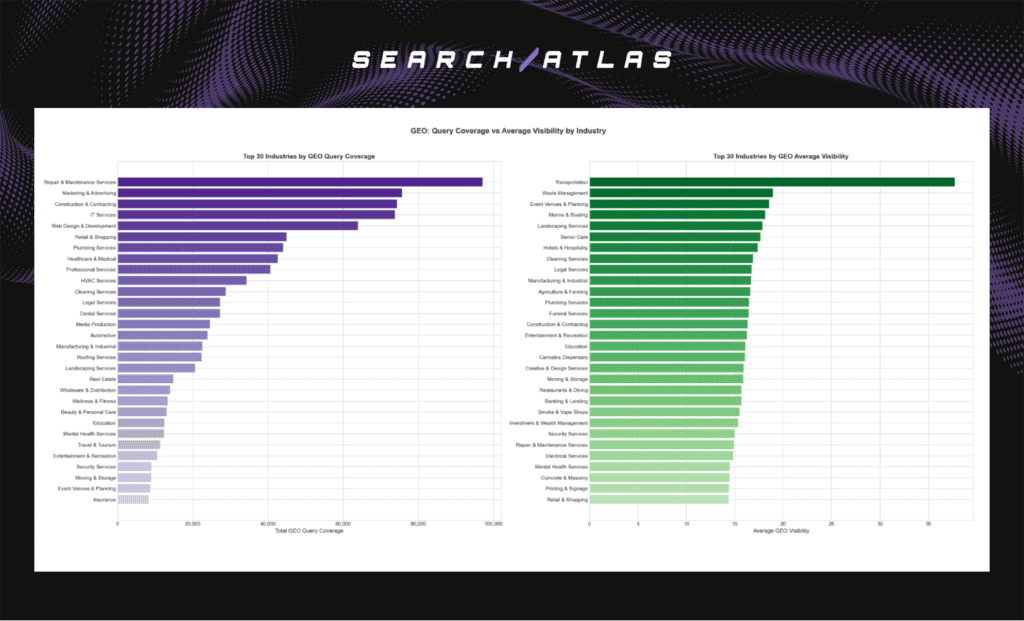
- Repair & Maintenance, Marketing, Construction, IT, and Web Services show the widest AI presence across queries.
- Transportation, Waste Management, and Event-related sectors show stronger visibility depth than query breadth.
- Retail, Healthcare, and Professional Services maintain a steady GEO presence without leading either metric.
- GEO exposure distributes unevenly across industries, with few sectors showing strength across both dimensions.
Industries differ substantially in how they appear across AI-generated responses. Some industries appear frequently across many queries, while others appear more prominently within narrower citation environments.
GEO Industry Presence: Total AI Mentions
Total AI mentions measure how frequently industries appear in AI-generated responses. Citation volume matters because it reveals where GEO visibility concentrates across generative ecosystems.
The headline results are shown below.
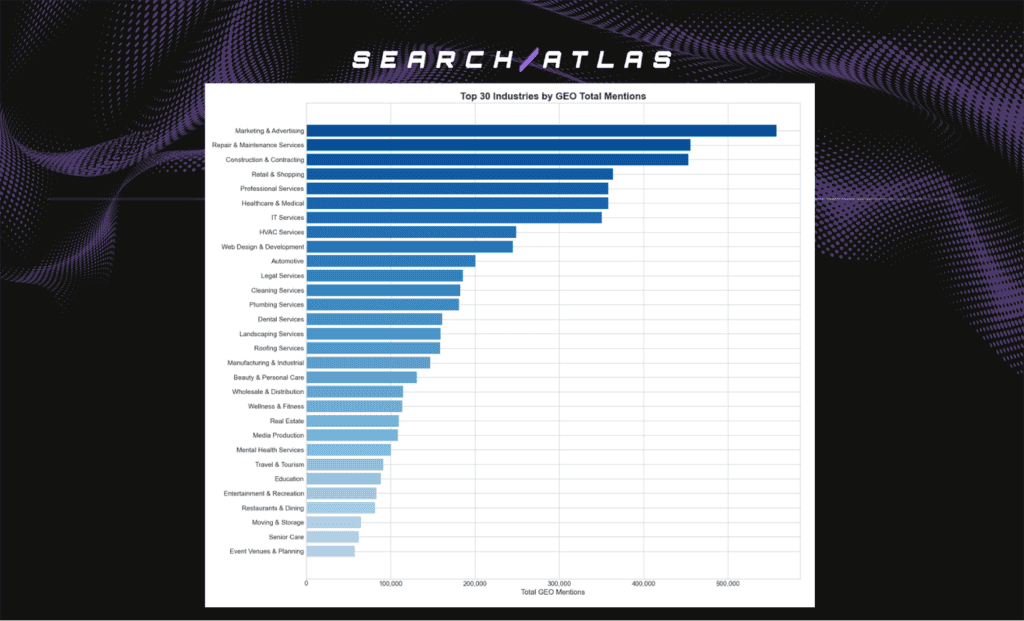
- Marketing & Advertising, Repair & Maintenance Services, and Construction & Contracting lead GEO mentions by a wide margin.
- Retail, Professional Services, Healthcare, IT Services, and HVAC dominate AI visibility across service-driven queries.
- Education, Media Production, Travel, and Entertainment maintain a comparatively weaker AI presence.
- GEO visibility drops sharply outside the leading industries, creating a long-tail distribution pattern.
GEO exposure concentrates heavily within practical, service-oriented, and problem-solving industries rather than distributing evenly across the broader digital ecosystem.
Which Industries Show the Clearest Shift from SEO to AI Discovery?
The top industries appearing across both SEO and GEO datasets were analyzed to determine where visibility is redistributing from traditional search toward AI-generated discovery.
The comparisons measure SEO Trend Score and GEO Strength Score to reveal which industries maintain visibility across both ecosystems, lose visibility across both systems, or shift discovery toward AI platforms.
The headline results are shown below.
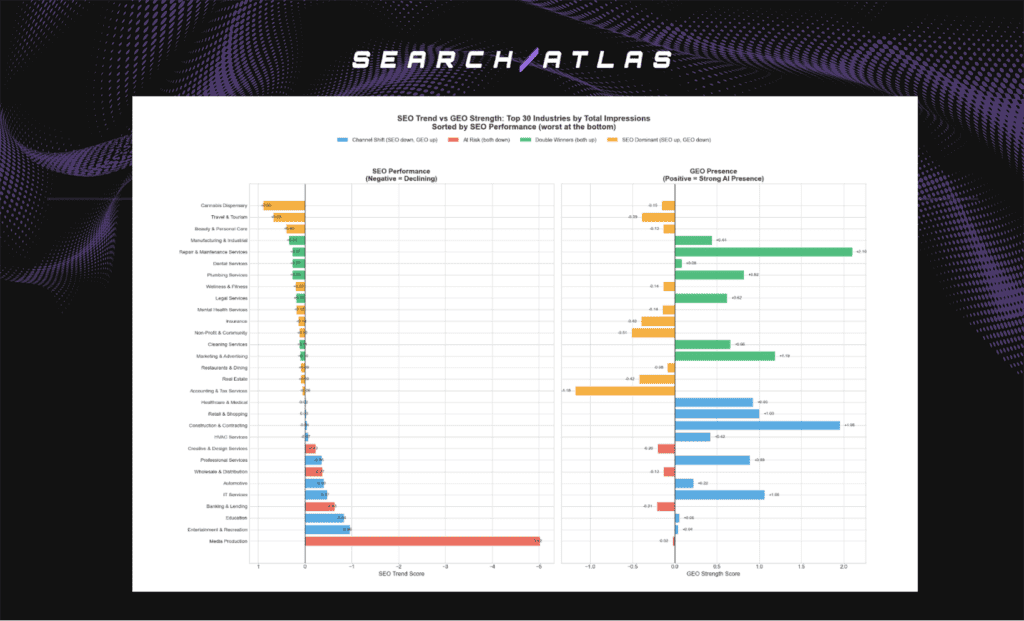
Channel Shift Industries
Channel Shift industries show declining SEO performance alongside strong GEO visibility.
- Construction & Contracting, Retail & Shopping, IT Services, and Professional Services show the clearest channel shift patterns.
- GEO visibility strengthens as SEO performance weakens across these industries.
- Discovery redistributes toward AI-generated answers rather than disappearing entirely.
GEO functions as a compensatory discovery channel within these sectors, absorbing visibility demand as traditional organic performance declines.
At-Risk Industries
At-Risk industries show declining SEO performance alongside weak GEO visibility.
- Media Production, Education, and Banking & Lending show the strongest visibility loss patterns.
- These industries lack compensating AI visibility despite weakening organic performance.
- Visibility risk compounds across both traditional and generative ecosystems simultaneously.
These sectors face the greatest structural exposure as discovery weakens across both search and AI-driven environments.
Double Winner Industries
Double Winner Industries maintains strong performance across both SEO and GEO ecosystems.
- Repair & Maintenance, Plumbing, Legal, and Manufacturing show positive performance across both systems.
- These industries maintain organic search strength while expanding AI visibility simultaneously.
- Discovery remains diversified rather than dependent on a single ecosystem.
Double Winner industries demonstrate the strongest digital resilience across evolving discovery environments.
SEO-Dominant Industries
SEO-Dominant industries maintain stable or improving SEO performance alongside weaker GEO visibility.
- Cannabis Dispensary, Travel & Tourism, and Beauty & Personal Care remain heavily dependent on traditional search.
- GEO presence remains comparatively underdeveloped across these sectors.
- Strong SEO performance currently offsets weaker AI visibility.
These industries maintain organic stability but face longer-term adaptation pressure as AI-driven discovery expands.
GEO visibility frequently strengthens where SEO decline becomes steepest, confirming that AI systems increasingly function as a parallel discovery layer rather than a purely additive channel.
What Should SEO and AI Teams Do with These Findings?
SEO and AI teams need to identify which visibility transition pattern defines their industry. Channel Shift industries require active GEO optimization because AI visibility increasingly absorbs discovery demand as traditional organic performance declines. At-Risk industries require immediate visibility recovery strategies across both SEO and GEO ecosystems.
Teams need to optimize content for AI citation visibility. Pages with strong topical focus, factual grounding, structured data, and clear entity relationships achieve stronger citation performance across generative answer systems. Industries tied to practical and service-oriented queries show the strongest GEO visibility concentration, confirming that actionable content aligns most effectively with AI retrieval behavior.
Benchmarking SEO and GEO performance together reveals the complete visibility landscape. SEO Trend Score identifies whether industries gain or lose organic strength over time, while GEO Strength Score measures how strongly industries appear across AI-generated ecosystems. Comparing both metrics together reveals where visibility redistributes, where risk compounds, and where AI visibility offsets weakening organic performance.
Integrating LLM Visibility tracking inside Search Atlas enables unified measurement across SEO and AI ecosystems. The Search Atlas LLM Visibility tracks brand mentions, citation coverage, and query-level visibility across generative systems. These signals reveal which industries, topics, and pages gain or lose discoverability as AI-driven search behavior expands.
What Are the Study’s Limitations?
Every industry-level visibility analysis introduces structural constraints. The limitations of this study are listed below.
- Temporal Asymmetry Between Datasets. SEO Trend Score measures 13 months of performance change, while GEO Strength Score reflects a recent AI visibility snapshot rather than longitudinal GEO trends.
- Matched Domain Scope. Direct comparison relies on 20,543 matched domains across both datasets. Industries with weaker domain overlap do not fully reflect broader ecosystem behavior.
- Industry Classification Noise. GEO domains were mapped using SEO industry classifications. Multi-industry domains and classification differences introduce aggregation inconsistencies.
- Visibility vs Traffic Measurement. GEO Strength Score measures AI citation visibility rather than traffic or conversion impact. Strong GEO presence does not confirm equivalent traffic recovery.
Despite these limitations, the analysis establishes a clear baseline for understanding how SEO performance trends and GEO visibility strength diverge across industries. The matched-domain framework, standardized scoring system, and 4-category visibility classification create a replicable structure for monitoring how discovery redistributes as AI-driven ecosystems continue to expand.