AI CMO KPIs are a two-tier measurement system. The first tier tracks whether the AI system is operating correctly: decision quality, coverage rate, and override rate. The second tier tracks whether marketing outcomes are improving as a result: CAC, cycle time, and content-to-pipeline ratio. Separating these two tiers is not optional: it is what prevents you from attributing business results to the AI before you have confirmed it as the causal variable.
Most teams skip the first tier entirely. They deploy an AI CMO platform, watch their rankings and conversion rates, and attribute any lift to the platform. When results plateau or dip, they have no signal for whether the AI is underperforming, whether market conditions have shifted, or whether a configuration error is compounding.
Key takeaways:
- AI CMO KPIs require two distinct tiers: AI system health and marketing outcomes, measured separately before attributing causation
- Override rate and coverage rate are AI-specific metrics absent from standard marketing KPI frameworks
- A pre-AI baseline period is required before any outcome KPI can be attributed to the platform
- The attribution problem is real: most reported AI marketing wins conflate AI decisions with market conditions
- Governance metrics (brand safety rate, model retraining frequency) are the tier most teams skip and most likely to create downstream risk
Why standard marketing KPIs do not tell you if your AI CMO is working
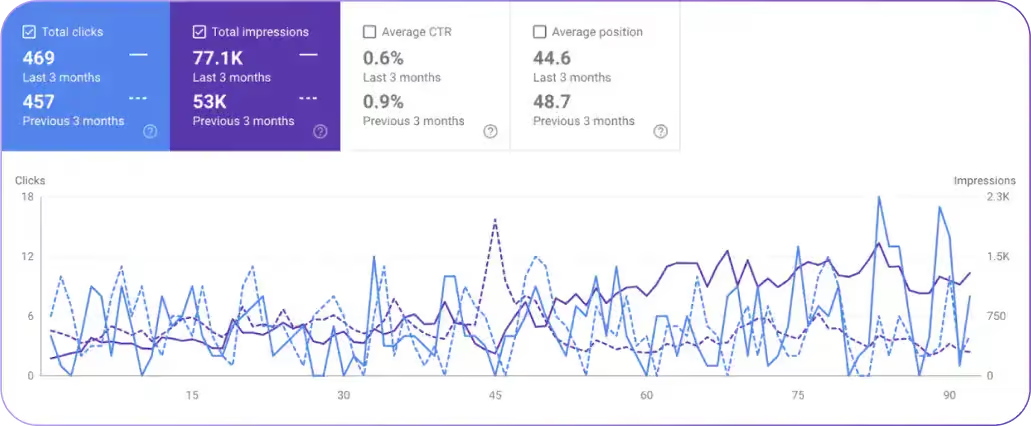
Standard marketing KPIs (CTR, impressions, CAC, conversion rate) measure channel performance. They do not measure whether the AI system making decisions on that channel is performing well, poorly, or at all.
A channel can perform well despite the AI, not because of it. Organic rankings can rise during an algorithm update that benefited your site independently of any OTTO SEO changes. ROAS can improve because a competitor paused their campaigns, not because Smart Ads made better bidding decisions. Without isolating the AI’s contribution, you are measuring marketing performance and calling it AI performance.
The standard KPI framework also has no concept of AI-specific operational health. There is no marketing industry metric for “what percentage of eligible workflows did the AI execute?” or “how often did a human override the AI’s output?”
These questions do not exist in traditional measurement because traditional marketing tools do not make autonomous decisions. An AI CMO platform does, and those decisions need their own measurement layer.
The attribution problem: separating AI decisions from market conditions
The attribution problem in AI marketing is specific: you need to confirm that the AI’s decisions caused the performance movement, not market conditions, seasonal patterns, competitor behavior, or changes the human team made independently.
The only clean way to do this is a controlled baseline. Before deploying an AI CMO platform, document performance across all key outcome metrics for a 60–90 day period. After deployment, measure the same metrics against the same period the following year or against a control group of pages or campaigns that did not receive AI-driven changes.
Without a pre-AI baseline, you cannot attribute gains to the platform, only correlate them with it. This distinction matters for stakeholder reporting. Correlation is easy to produce and easy to challenge. A proper baseline comparison is harder to challenge and more defensible when investment decisions are on the table.
Tier 1: AI system health metrics
AI system health metrics measure whether the platform is operating correctly before looking at whether marketing results are improving. Run these weekly.
1. Decision quality: are the AI’s choices improving over time?
Decision quality measures whether the AI’s optimization recommendations are producing the intended effect at the asset level, not the campaign level. For an autonomous SEO agent like OTTO SEO (Search Atlas’s SEO execution layer), decision quality tracks: of the title tag and heading changes deployed in a given period, what percentage produced a measurable ranking improvement versus a neutral or negative movement?
Tracking decision quality requires a change log with timestamps and asset-level performance data. OTTO SEO’s change log provides this: every deployed change is recorded with pre-change state, deployment date, and post-change GSC performance.
Review the log monthly and flag change categories with consistently neutral or negative outcomes: these indicate a Knowledge Graph calibration gap, not a platform failure.
Healthy decision quality benchmark: 60–70% of discrete SEO changes producing positive ranking movement within 45 days. Below 50% signals Knowledge Graph recalibration is needed.
2. Coverage rate: what percentage of eligible workflows is the AI executing?
Coverage rate measures whether the platform is working through its priority queue at an appropriate pace. An autonomous SEO agent that has touched 5% of a 400-page site after 90 days is not making meaningful progress, regardless of what the ranking trend shows.
Calculate coverage rate by dividing the number of pages that have received at least one AI-driven change by the total number of pages in scope. Track this by change category: title tags, headings, schema, internal links. A low coverage rate is an operational problem, not a performance problem: it means the platform is not running at the pace the account requires.
Healthy benchmark: 30–40% of in-scope pages touched within the first 60 days, rising to 80%+ over six months of continuous operation.
3. Override rate: how often are humans correcting AI output?
Override rate is the most diagnostic AI-specific KPI and the one least present in existing measurement frameworks. It measures what percentage of AI-generated suggestions a human team rejects, modifies before publishing, or rolls back after deployment.
A high override rate (above 30%) indicates the AI is not well-calibrated to the business. The most common cause is a generic or incomplete Knowledge Graph (the structured business profile that feeds every optimization decision). When the AI does not know who the ICP is, which competitors to differentiate against, or which content directions to avoid, it generates suggestions that require constant human correction.
A low override rate (under 10%) indicates the AI is well-calibrated and the team trusts its output. Tracking override rate over time shows whether configuration improvements are working: if you refine the Knowledge Graph and the override rate drops from 35% to 18% over 30 days, that is direct evidence the recalibration was effective.
Override rate should be tracked separately for each change category. An override rate of 40% on content suggestions but 8% on technical SEO changes tells you the content calibration is off, not the platform overall.
Tier 2: Marketing outcome KPIs
Outcome KPIs measure whether marketing performance is improving as a result of the AI system operating correctly. Only measure these against the pre-AI baseline set before deployment. Run these monthly.
1. Customer acquisition cost (CAC): baseline vs. AI-assisted period
Customer acquisition cost (CAC) is the most cited AI marketing outcome metric and the most commonly misattributed. Calculate CAC as total marketing spend (including platform subscription cost) divided by new customers acquired. Compare the AI-assisted period against the same period in the prior year, or against the 90-day pre-deployment baseline.
The platform subscription cost must be included in the numerator. An AI CMO platform at $399/month that reduces CAC from $1,200 to $900 is producing a net reduction. A platform at $399/month that reduces CAC from $500 to $450 while compressing team capacity to serve more accounts may still be producing net positive ROI, but the math requires including the platform cost.
Flag any CAC movements that coincide with external events: competitor exits, algorithm updates, seasonal patterns. These are not AI-driven and should be reported separately.
2. Cycle-time reduction: how much faster campaigns launch and iterate
Cycle-time reduction measures the operational compression an AI CMO platform produces.
Before AI: a blog post goes from brief to published in 14 days.
After AI: Content Genius produces a keyword-grounded draft in hours; editorial review adds 2 days; total cycle is 3 days.
That 11-day reduction is a measurable operational KPI that does not require attribution modeling: it is a direct output of the platform.
Cycle-time metrics to track:
– Content production: days from keyword targeting to published piece
– SEO implementation: days from audit finding to deployed fix –
Campaign launch: days from approved brief to live ad
Cycle-time reduction is the easiest AI CMO KPI to prove to leadership because it is observable before outcome improvements appear. Ranking lifts take 60–90 days to surface. Cycle-time reduction is visible within the first deployment week.
3. Content output-to-pipeline ratio: volume that converts vs. volume that does not
Not all content production is equally valuable. Content output-to-pipeline ratio measures what percentage of published content is attributable to marketing-qualified leads or pipeline movement, not just impressions or traffic.
Track this by content cohort: pieces published in a given month, measured against pipeline attribution over the following six months. A team producing 40 pieces per month with 12% pipeline attribution outperforms a team producing 15 pieces per month with 8% attribution. The ratio reveals whether the content program is optimizing for volume or for conversion-relevant topics.
In a platform like Search Atlas, Content Genius produces drafts grounded in SERP data and scored against keyword signals. Cross-referencing those keyword signals against pipeline-converting topics identifies whether the AI is producing content on high-converting clusters or filling coverage gaps with low-intent traffic.
Tier 3: Governance and risk metrics
Governance metrics protect the investment and limit downstream liability. Most teams skip this tier until something goes wrong. Run these quarterly.
Brand safety rate: AI-generated content that passes quality review without modification
Brand safety rate measures the percentage of AI-generated content that ships without substantive human revision. Track separately from override rate: override rate measures whether you approved or rejected the AI’s change; brand safety rate measures whether the approved changes meet quality and compliance standards after deployment.
A brand safety rate below 80% indicates the AI’s content output requires too much editorial intervention to be operationally efficient. The fix is not more review. Refine the Knowledge Graph content rules and the model’s input context.
Model retraining frequency: how often the AI needs recalibration
Model drift (also called configuration drift) occurs when the AI’s Knowledge Graph falls out of sync with the business’s current state: new products, new positioning, new competitive landscape, new keyword priorities. As drift accumulates, decision quality degrades, and override rate rises.
Track how frequently the Knowledge Graph requires a material update. A well-configured account in a stable category should need recalibration every 90 days. A fast-moving category (new competitors, frequent positioning changes, rapid product evolution) may need recalibration every 30–45 days.
Model retraining frequency is a planning metric, not a failure metric. If you know a major positioning change is coming, schedule a Knowledge Graph update before the change goes live, not after
The North Star KPI framework: one goal, six to twelve supporting metrics
For executive reporting, a long list of KPIs creates noise. The North Star approach selects one primary business outcome metric that the AI CMO investment is explicitly expected to move, and six to twelve supporting metrics that explain whether it is on track.
A B2B SaaS company’s North Star might be a marketing-influenced pipeline.
Supporting metrics:
– Tier 1 (AI health): coverage rate, override rate, decision quality score
– Tier 2 (outcomes): CAC trend, cycle-time reduction, content-to-pipeline ratio
– Tier 3 (governance): brand safety rate, Knowledge Graph recalibration count
A lead generation business might choose CAC as the North Star, with ROAS, organic session growth, and content production volume as supporting metrics.
The North Star KPI is not the platform’s internal metric: it is the business outcome the CFO or board cares about. The supporting metrics are what the marketing team monitors to stay on track toward it.
How to build an AI CMO performance dashboard
Structure the dashboard in two views: one for leadership and one for the internal team.
What to show leadership (business outcome tier)
Leadership needs three things: is the investment paying off, is it improving over time, and what is the risk?
Present: North Star KPI trending against baseline, CAC, and ROAS over the AI-assisted period vs. the baseline period, and cycle-time reduction as an operational proof point.
Keep the leadership view to six metrics or fewer. Every metric on the leadership dashboard should be directly mappable to a business outcome. Exclude coverage rate, override rate, and brand safety rate from this view.
What to monitor internally (system health tier)
The internal dashboard is for the marketing operations team and the platform owner. It should surface AI system health weekly and outcome KPIs monthly.
Weekly: change log volume by category, override rate by change type, coverage progress against the target page set.
Monthly: outcome KPI trending (CAC, cycle time, pipeline ratio), content cohort performance, and brand safety review count.
Quarterly: Knowledge Graph recalibration status, model retraining log, governance audit.
How Search Atlas supports this framework
Search Atlas covers both tiers from a single platform. OTTO SEO’s change log provides the Tier 1 execution data: change volume, coverage by page set, and pre/post GSC performance. Smart Ads connects paid performance data to the same Atlas Agent (Copilot CMO) optimization layer that informs OTTO SEO decisions, making cross-channel attribution possible without manual exports. LLM Visibility (Search Atlas’s brand monitoring module) adds a brand coherence layer that most measurement frameworks do not include.
Report Builder in Search Atlas produces customizable views across these data sources. The internal team configures weekly system health monitors; the leadership view is built from the monthly outcome KPI exports.
The framework above is platform-agnostic. What any AI CMO platform must provide to support it: a change log with asset-level resolution, override and approval tracking, and cross-channel data sharing that avoids the manual reconciliation overhead of fragmented tool stacks.