A local search grid is a map-based local SEO report that measures your Google Maps rankings from multiple locations across a defined service area. Each grid point shows where your business ranks for a specific local keyword when the search is performed from that location.
This matters because local search rankings change based on the searcher's location. A business might rank #1 for "plumber near me" close to its address but fall outside the top results only a few blocks away. A single average ranking can hide these differences.
Reading a local search grid shows where your business has strong Google Maps visibility, where rankings begin to decline, and where competitors outrank you. This makes it easier to identify geographic ranking gaps and prioritize local SEO improvements.
This piece covers what the grid measures, why it matters more in 2026 than it did a year ago, and the concrete steps to set one up and act on what it shows you.
What is a local search grid?
A local search grid is a visualization tool that plots a business's Google ranking for a specific keyword across dozens of points spread through its service area, revealing how visibility shifts by location rather than reporting one average position.
Standard rank trackers check a keyword from a single point, usually the business address, and hand back one number. That number hides the reality of local search, which is that Google's Map Pack results change depending on exactly where the searcher stands. A grid replaces the single number with a full picture, so a business can see a top-three ranking two blocks north and a total drop-off two blocks south, both true at once.

How local search grid tools work
A local search grid tool works by simulating dozens of separate Google searches from fixed points across a map, then plotting each result on a color-coded grid. The tool lays a series of points, sometimes called pins, over your target area in a pattern such as a 5x5 or 9x9 square, or a custom shape drawn around your actual service zone. Each point runs an independent search for your chosen keyword as if a real customer were searching from that exact spot.
As each simulated search completes, the tool records your ranking position and, usually, the top few competitors who outrank you at that point. The full set of results renders as a heatmap, with color standing in for rank so a person can scan the whole service area in seconds instead of reading a table of coordinates and numbers.
Grid density is a real trade-off worth understanding before you run a scan. A small 5x5 grid covers 25 points and loads fast, which works fine for a tight, single-neighborhood business.
A larger 9x9 grid covers 81 points across the same area, giving a far more granular picture of exactly where visibility breaks down, at the cost of a longer scan and more data to review afterward. Most local businesses do fine starting with a mid-size grid and only stepping up to denser coverage once they've identified a specific zone worth studying closely.
What do the colors in a local search grid mean?
The colors in a local search grid map directly to ranking position, with green marking strong visibility and red marking little or none. Search Atlas's own local heatmaps use this same color logic, and it's close to the industry standard:
- Green: A top-three ranking, the range that lands in the local pack where most map searches get clicked.
- Yellow: A position between four and ten, visible on the full results page but outside the pack most people actually tap.
- Red: Low or no visibility, either buried past the first page or absent from that search entirely.
As optimization work takes hold, a grid should visibly shift from red toward yellow and eventually green over successive scans, which makes progress toward a keyword measurable in a way a single ranking number never was.
Why local search grid data matters more in 2026
Local search grid data has become more important because Google's Local Pack now weighs a wider, more specific set of signals than it did even a year or two ago. Recent industry analysis breaks local ranking weight into six groups: Google Business Profile signals carry roughly a third of total ranking weight, on-page signals about a fifth, reviews close behind, followed by links, behavioral signals, and citations. Google Business Profile, often shortened to GBP, is the free business listing that shows up on Google Maps and in local search results.
A grid is the only practical way to see whether all that GBP and review work is actually landing in the neighborhoods that matter, because it shows the outcome location by location instead of asking you to trust an average.
Review signals in particular have grown fast. Review-related ranking weight has climbed several points over the past few years, and it now takes a meaningfully larger review count before a business shows up consistently, both in the Map Pack and in AI-generated answers that reference local businesses.
A grid makes that shift visible too, since two locations with near-identical review counts can still show very different grid colors. That happens when one location's reviews mention specific neighborhoods and services while the other's read as generic five-star comments, because Google's local algorithm reads relevance signals inside review text, not just star ratings.
Proximity still matters, but it's stopped being the deciding factor on its own. A location half a mile farther from a searcher can still outrank a closer competitor if it has a stronger profile, more relevant reviews, and better hyperlocal ranking signals tied to that specific area. That trade-off is exactly what a grid is built to expose, since a single-point rank check would show the closer business ranking fine from its own address and miss the fact that it's losing ground everywhere else.
Local search grids and AI search visibility
Local search grids are also becoming the starting point for tracking visibility in AI-generated answers, not just the traditional Map Pack. Google's AI Overviews and AI Mode now surface for a meaningful share of local queries, and tools like ChatGPT and Perplexity increasingly answer "best plumber near me" style questions directly instead of pointing to a search results page.
These systems lean on the same underlying signals a grid already measures. A business with strong, consistent grid coverage across its service area tends to get recommended more often in AI answers too, while one with patchy coverage tends to get skipped.
This extends what the grid is useful for rather than replacing it. A business that only checks its ranking from one address has no way to know whether an AI answer engine sees it as the obvious local recommendation or one option among many with thinner signals. Watching both the traditional Map Pack grid and how a business shows up when someone asks an AI assistant the same local question is quickly becoming standard practice for anyone serious about local visibility heading into next year.
How to set up your first local search grid scan
Here's how to get a local search grid running in a way that produces a map worth acting on instead of a colorful screenshot.
1. Choose a grid tool built for your service area
Start with a platform built specifically for grid-based local rank tracking, not a general keyword tracker retrofitted with a map view. A proper grid tool should let you drop a scan over a custom-shaped area rather than forcing a fixed radius, surface the specific competitors outranking you at each point, and render results as a heatmap that's readable at a glance.
Search Atlas's local heatmaps run inside its local SEO software and support up to seven layers or 175 scan points per map, with daily, weekly, or monthly refresh options depending on how fast a market moves.
If you're comparing options, our breakdown of local SEO tools worth using in 2026 and our separate look at local rank checkers both cover grid-capable platforms side by side, including how their pricing and pin limits stack up.
2. Use geo-keywords the way customers actually search
The keyword you feed into the grid has to match how a real customer phrases the search, not a generic head term. Skip broad terms like "plumber" and use the phrasing tied to a neighborhood, city, or service zone instead. A few examples:
- "Emergency plumber in Midtown Atlanta"
- "Tree trimming near Park Slope"
- "Family dentist 11211"
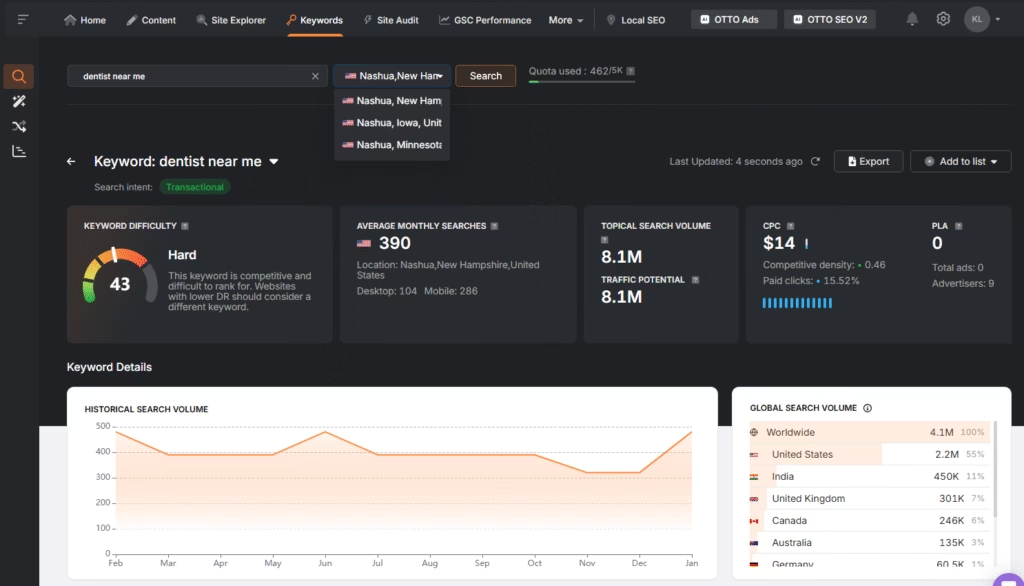 A local keyword research view showing search demand for 'dentist near me' style terms in Nashua.
These location-specific phrases show real visibility for the searches your customers are actually running, where a generic term would just tell you how you rank for a query almost nobody local types in.
3. Set your scan radius and grid size
Before running a scan, lock in the exact area worth measuring instead of defaulting to the whole city. A focused first scan usually covers one of four situations: a top-performing neighborhood worth protecting, an area where leads have slowed, a zone where a competitor keeps gaining ground, or a new area you're trying to break into.
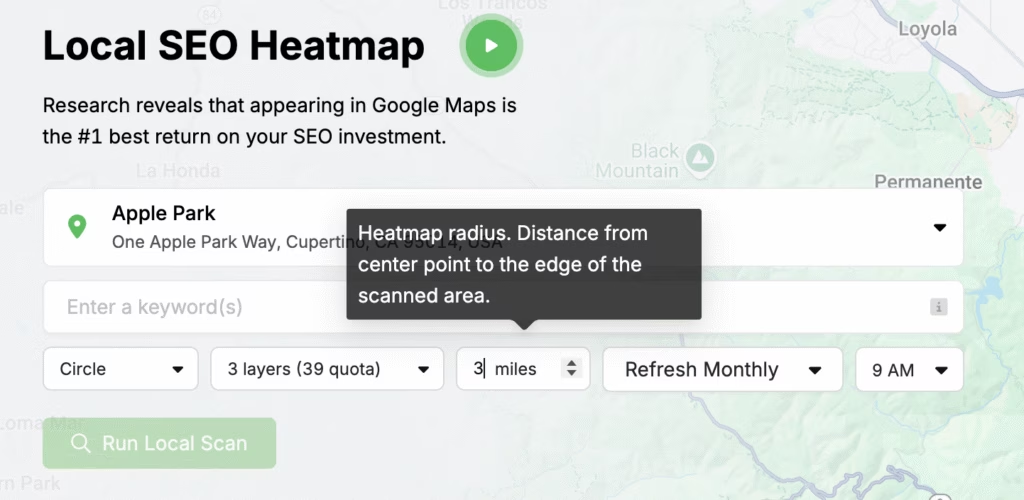
Radius controls how far each scan point reaches from your local center. A tight radius keeps the view hyperlocal and useful for a single dense neighborhood, while a wider one spreads the same number of points across more ZIP codes, trading detail for coverage. Search Atlas defaults its heatmap scans to a four-mile radius around a business's GPS location, and that radius, along with the shape of the scan area, is adjustable per map.
4. Read the heatmap and flag the gaps
After a scan completes, the real work starts with the red and orange points, since those mark where visibility drops and usually point to a specific, fixable cause.
- Business listings may be inconsistent across directories and platforms.
- Reviews might be outdated, sparse, or missing the local language Google rewards.
- The website itself may not speak to that specific neighborhood at all.
For each weak zone that falls inside your actual service area, work through three checks: find the cluster of poor visibility and figure out what's missing there, check whether the target keyword is even landing on that side of town, and review whether existing content actually speaks to the people who live there. A red zone simply tells you where the next fix belongs.
Seven local SEO moves that turn red zones green
Once a grid shows where visibility is weak, the fix usually falls into one of seven categories. Work through these roughly in order, since GBP and review fixes tend to move the needle faster than content or backlinks alone.
1. Fix your Google Business Profile first
Given that GBP signals carry the largest single share of local ranking weight, this fix moves the needle faster than any other on this list.
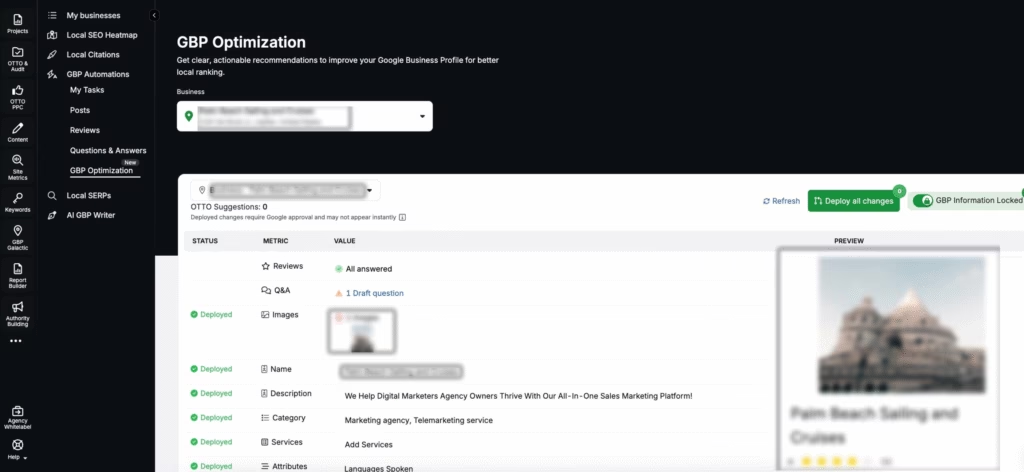 OTTO SEO can deploy GBP fixes automatically once you approve the change.
- Adjust categories. If a neighborhood you serve isn't showing up, check that your primary and secondary categories actually match what people search there.
- Review your service list. Add anything missing and phrase it the way your audience searches, not the way your team talks internally.
- Confirm service area settings. If you're weak in a place you genuinely serve, verify it's actually listed in your GBP service area configuration.
- Keep NAP consistent. Name, address, and phone number should match exactly across your website, directories, and your profile.
- Add fresh photos regularly, ideally from the specific neighborhoods you serve, since recency and specificity both read as activity signals.
GBP Galactic inside Search Atlas syncs listing data, automates review responses, and tracks profile completion across every location from one dashboard, which matters once you're managing more than a handful of listings. Our local SEO checklist covers the full profile setup in more depth if you're starting from scratch.
2. Study who's winning each grid point
A grid doubles as a competitor map, showing exactly who outranks you at each point and where. Look for the businesses that show up green across multiple points where you're red or yellow, then dig into what separates them, usually a stronger category match, more specific reviews, or content that speaks directly to that area. Our guide to competitor analysis tools walks through how to pull that comparison data at scale rather than checking listings one by one.
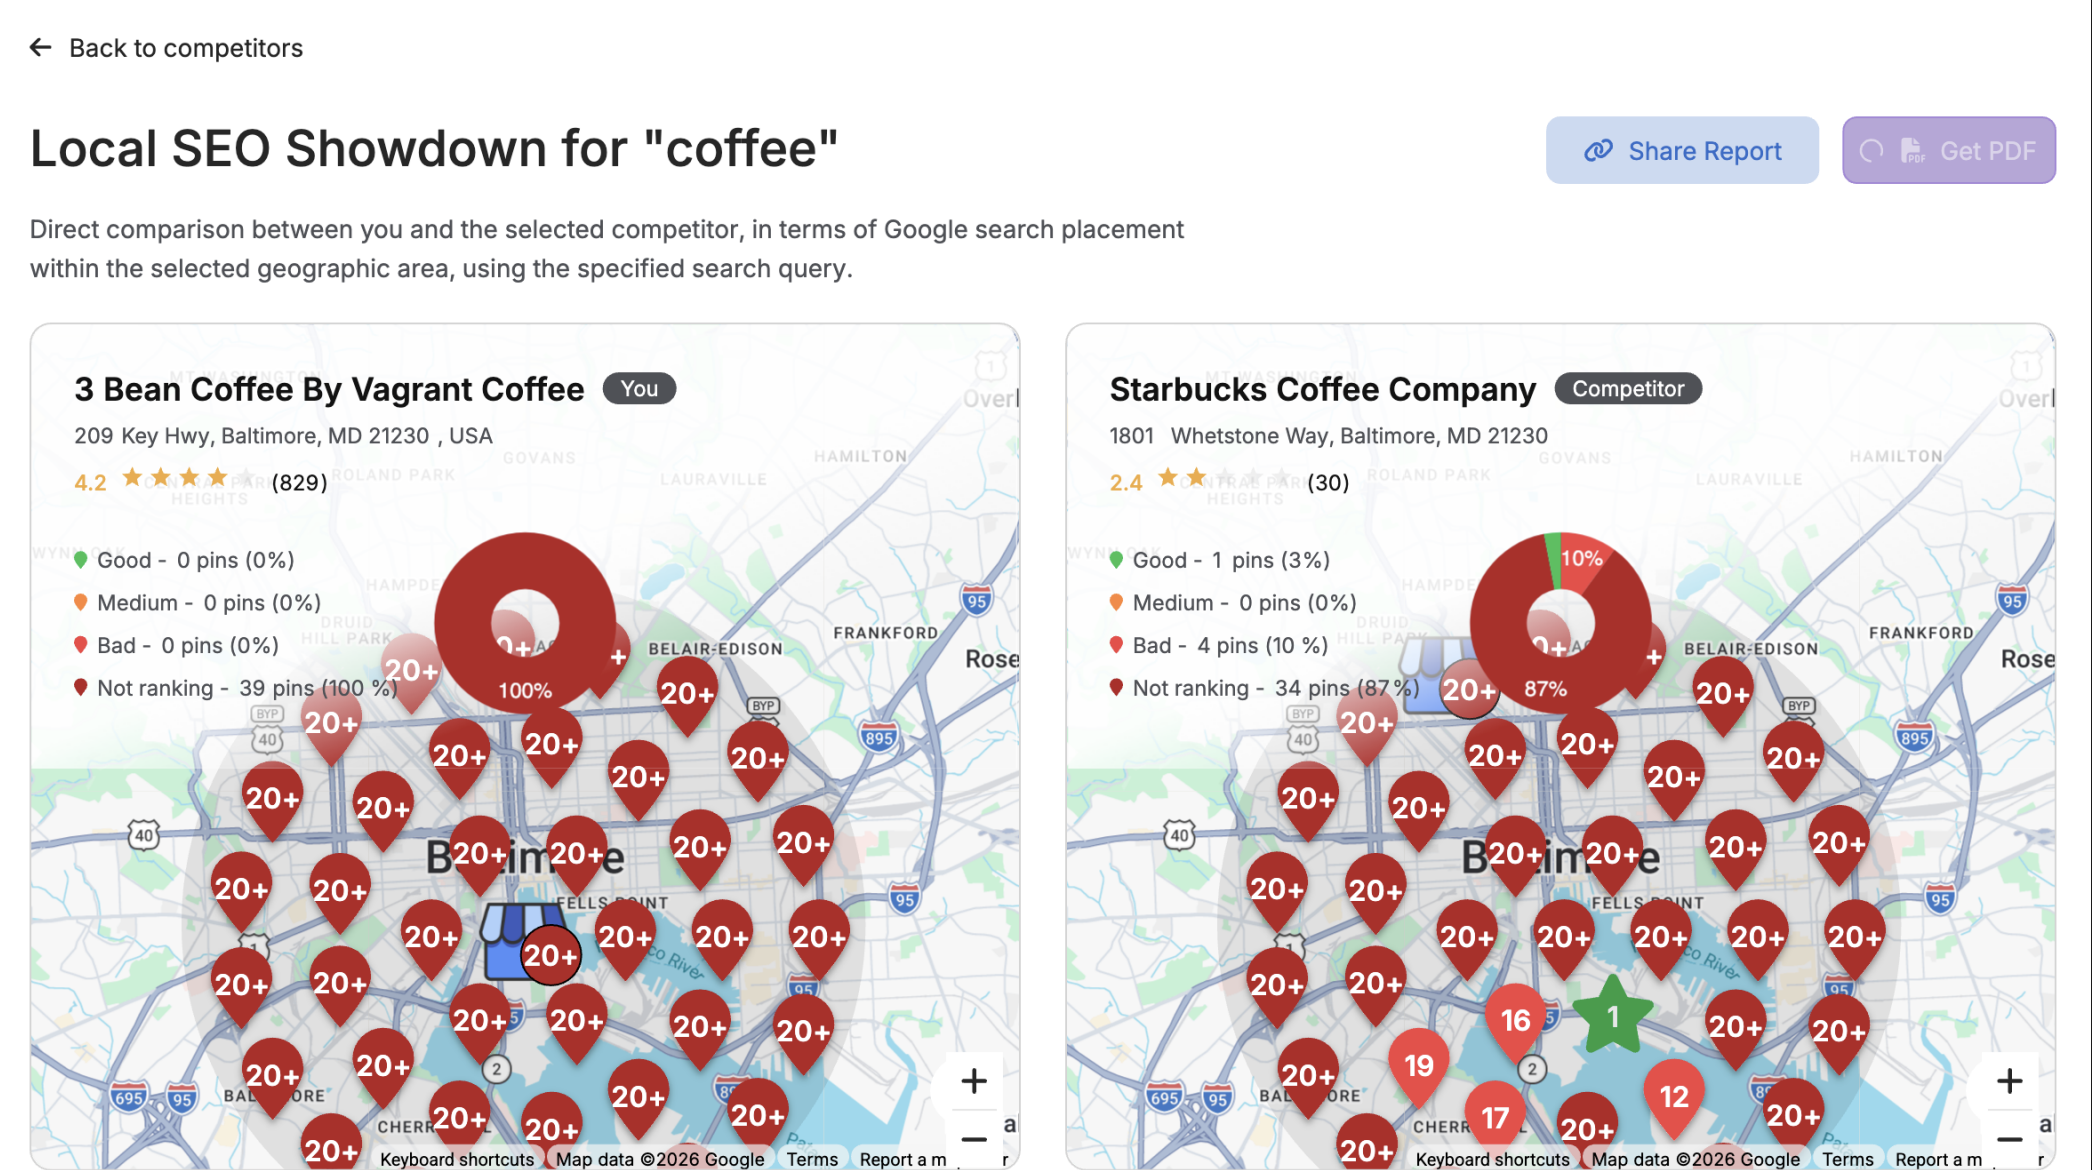 Comparing keyword strategy and ranking signals against local competitors inside Search Atlas.
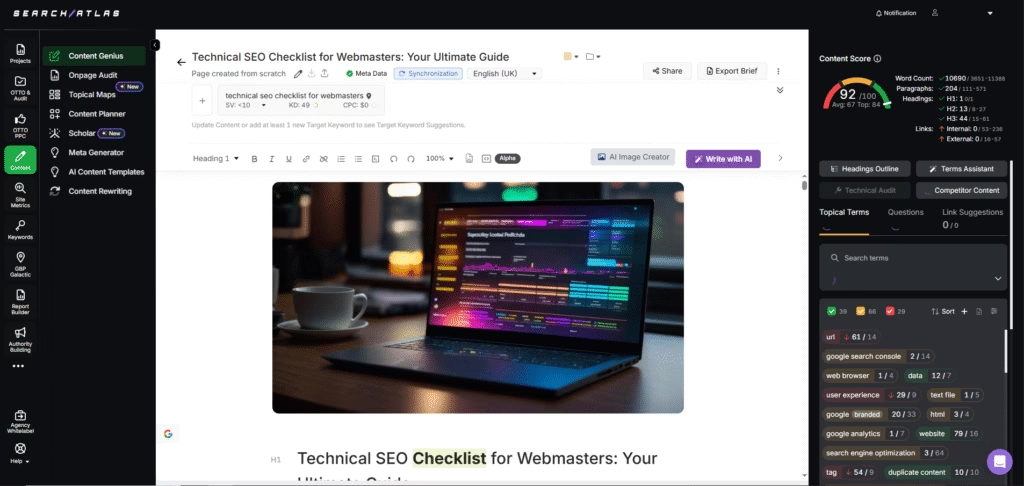
3. Build neighborhood pages for the gaps
Content built for a specific neighborhood tends to close visibility gaps that generic service pages never touch, because Google's local algorithm treats genuine neighborhood relevance as a ranking signal worth rewarding on its own.
A page titled "Plumber in Brookside" or "Lawn Care in Eastwood" only works if it reads like it was written for that neighborhood, with real landmarks, local service stats, and the questions people from that area actually ask. Blog content that references seasonal patterns or community events specific to one zone reinforces the same signal without duplicating the main service page.
4. Collect reviews from the zones you want to grow
Reviews that mention a specific area act as a local relevance signal Google can attach to that exact part of your grid. The more reviews you collect from a given zone, the more evenly your visibility tends to spread across the map instead of clustering around your physical address.
- Ask strategically, prioritizing customers from neighborhoods where visibility is currently weak.
- Make it easy: send a direct link, add a line of location-specific context, and follow up with a short thank-you.
- Respond to every review. A thoughtful reply signals activity to Google and trustworthiness to future customers.
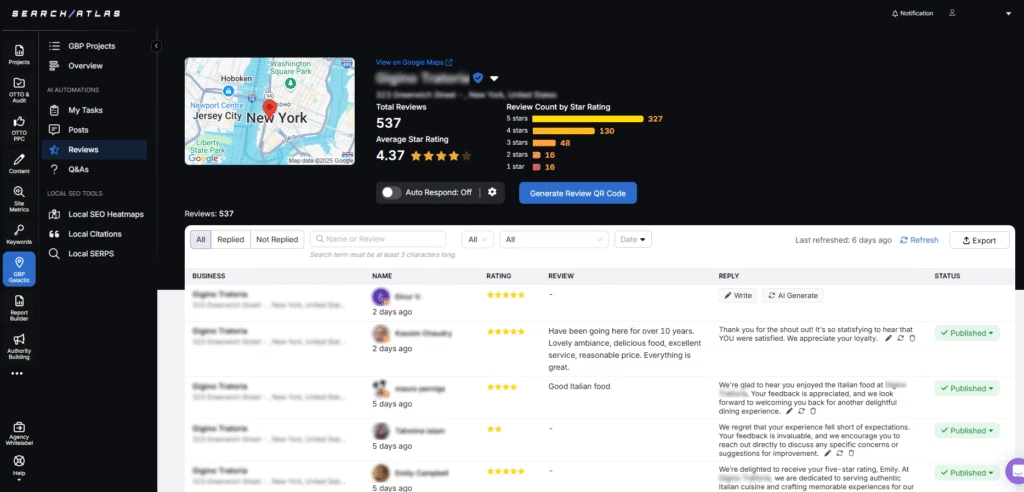 GBP Galactic centralizes review monitoring and can draft AI-assisted responses for approval.
5. Earn backlinks from local sources
When content and reviews are solid but a zone still lags, weak local backlink coverage is often the missing piece. Sponsorships, guest posts, and local newsletter features with businesses or organizations tied to a specific neighborhood tend to carry more weight for that area than a generic national link. A quick backlink analysis will usually show whether your link profile skews too broad and thin to support hyperlocal visibility.
A few sources tend to work well for this specifically: local chambers of commerce, neighborhood associations, community sports leagues, and school or nonprofit fundraiser pages, all of which link out to sponsors and partners as a matter of course. None of these links carries much weight on its own, but a handful of them anchored to the same neighborhood tells Google that a business has a genuine footprint there, which is exactly the kind of signal a grid can't manufacture through content alone.
6. Turn grid data into reports clients understand
Grid data only creates value once someone acts on it, and a clear report is what turns a heatmap into a decision. Search Atlas's Report Builder pulls rank tracking, GBP, and backlink data into a single client-ready dashboard, so a ranking shift after a GBP update or a new batch of reviews shows up as a concrete before-and-after rather than a claim.
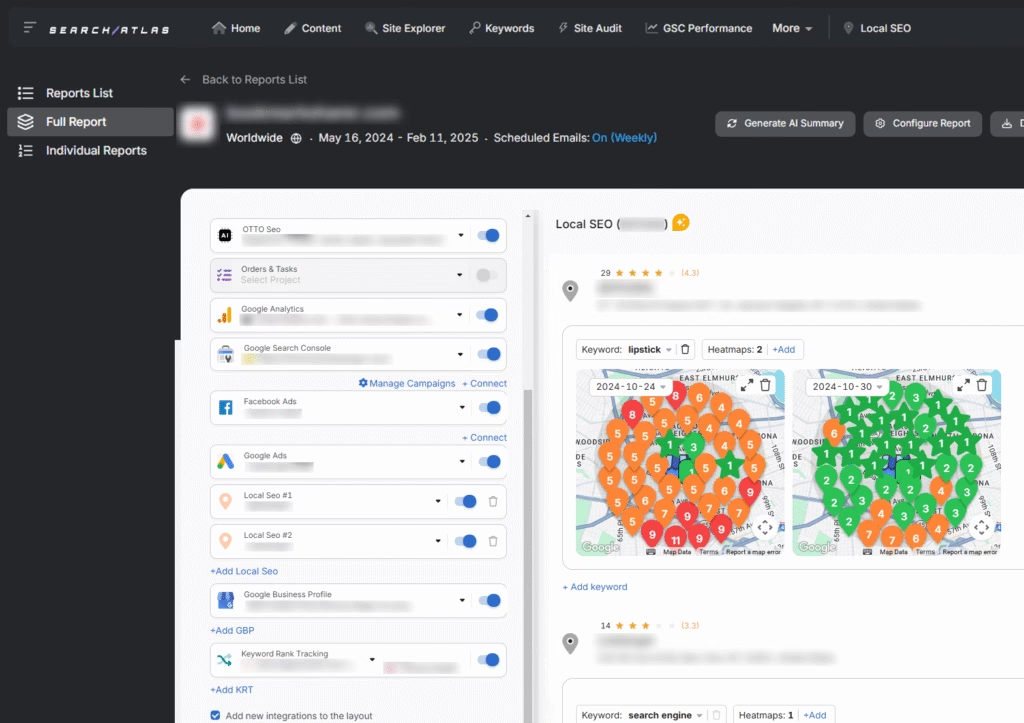 A heatmap-based client report generated inside Search Atlas Report Builder.
7. Rescan on a repeatable schedule
A single grid scan is a snapshot, but local rankings shift constantly, so the real value comes from scanning on a repeatable schedule. Regular scans catch a ranking drop while it's still small, show whether a specific fix, like a GBP update or a new review batch, actually moved the needle, and flag SERP monitoring patterns worth watching before they cost real traffic.
How often should you run a local search grid scan?
Most businesses should rescan a local search grid weekly, with tighter markets or active campaigns benefiting from daily scans and stable, low-competition areas able to stretch to monthly. The right cadence depends on how fast rankings move in your specific market and how actively you're working the fixes above.
A business in a competitive market with several changes in flight, a new GBP category, a fresh batch of reviews, new neighborhood content, benefits from weekly or even daily scans so each change's effect is visible before the next one lands on top of it. A business in a smaller, less competitive market with a stable profile can run monthly scans without missing much, since visibility there tends to move slowly.
Either way, the point of a schedule is the same. It catches a slow decline while it's still a small dip, not after it's already cost a season of leads.
Once a grid is running on a fixed cadence, the map itself becomes a running record. Comparing this month's scan against last month's, or last quarter's against the one before it, turns a single heatmap into a trend line, and a trend line is what actually tells a business or a client whether local SEO work is compounding or stalling out.