

Build an SEO ranking report by tracking keyword performance, analyzing ranking changes, and delivering clear insights to guide optimization efforts.
An effective SEO ranking report helps teams and clients understand how their keywords perform over time. It highlights successes, uncovers opportunities, and points to areas that need attention. 🔎
This report goes beyond raw data by translating numbers into actionable recommendations. In this guide, you learn what to include in an SEO ranking report, how to organize it, and which tools make the process easier and more accurate.
What Is a Ranking Report in SEO?
An SEO ranking report is a report that shows where website pages appear in search results for specific keywords. The report tracks keyword performance over time. It reveals improvements or declines in position. These changes reflect the impact of SEO efforts.
The report supports buy-in by showing SEO value with clear data. It outlines competitive positioning. It uncovers areas for optimization. Use the report to guide decisions that improve visibility, increase traffic, and raise conversions.
What Are the Key Aspects of an SEO Ranking Report?
An SEO ranking report presents clear metrics that reflect search visibility and traffic performance. Each section highlights specific areas of growth, opportunity, or concern. Clients use this data to understand how SEO efforts influence rankings, user behavior, and regional reach across search platforms.
- Location. A location section of the report defines where keywords rank across regions or cities. Clients see whether their target areas receive enough visibility and traffic. Regional gaps become clear through comparison.
- Device. Data separates rankings by mobile, desktop, and tablet. Clients understand how well content performs on each device. Results reveal optimization needs for specific platforms.
- Changes. Report tracks keyword movement across time. Clients measure SEO progress and identify position gains or losses. Trend lines show whether efforts bring positive results.
- Search Volume. Displays the number of searches for each keyword. Clients learn which terms attract attention and hold value. High-volume keywords receive greater focus.
- Average Position. Summarizes ranking strength with one metric. Clients view overall performance at a glance. Fluctuations signal the need for action or confirm stability.
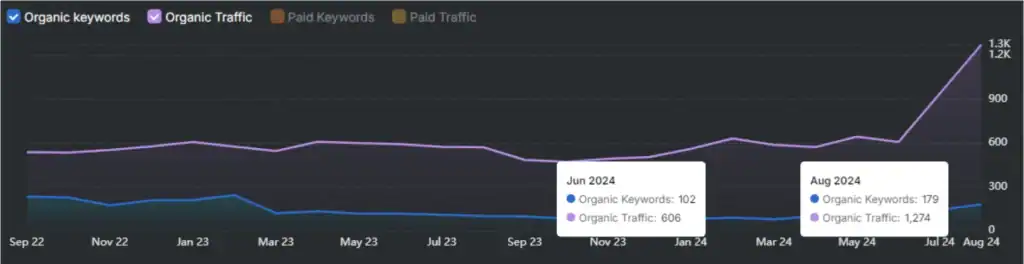
- Organic Traffic. Shows how many users visit through unpaid results. Clients assess the real impact of keyword rankings. Higher traffic confirms effective targeting.
- Local Ranking. Highlights visibility in map packs or nearby searches. Clients evaluate their presence in local search zones. Data supports decisions for regional outreach.
Google Search Console (GSC) Insights
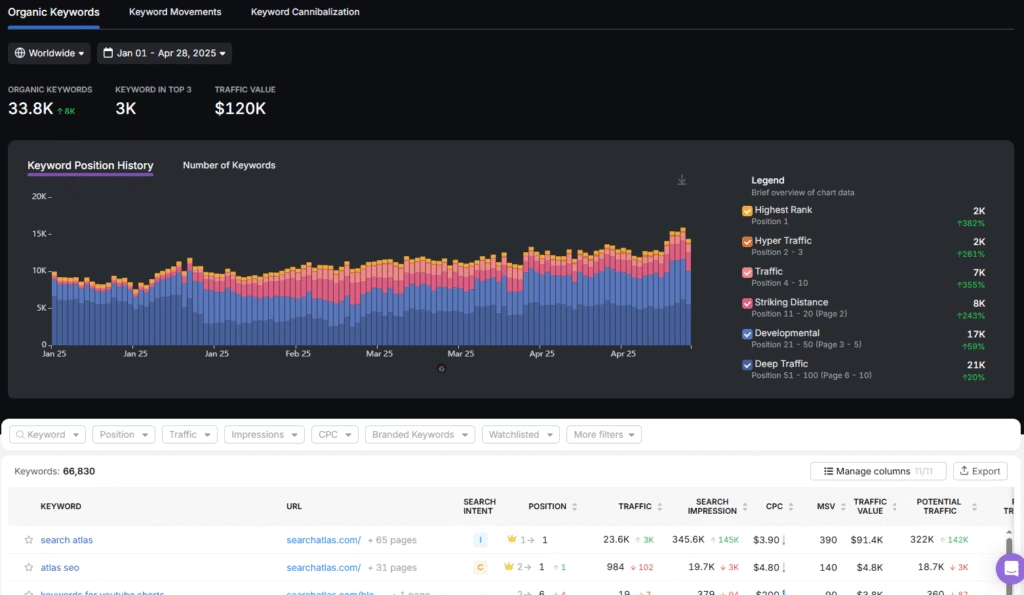
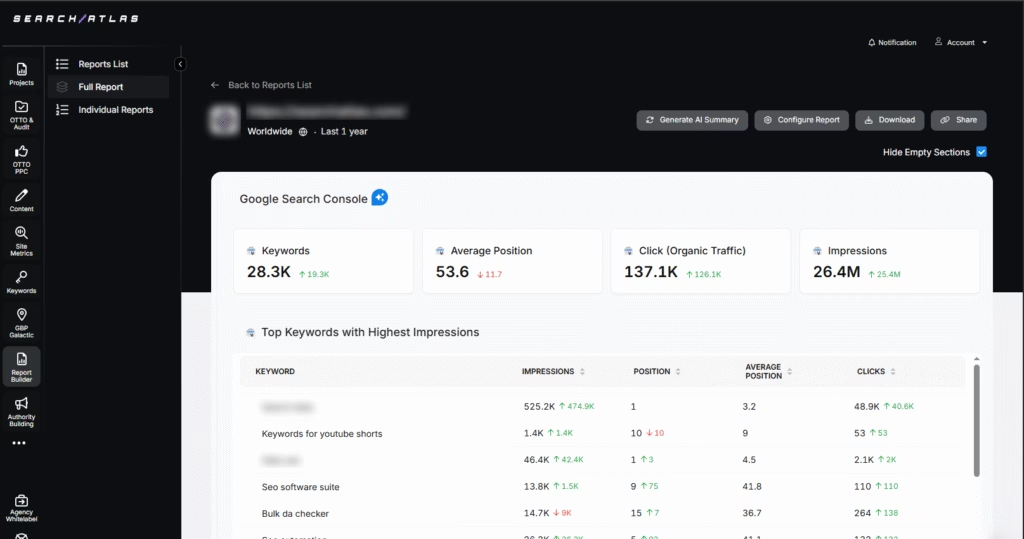
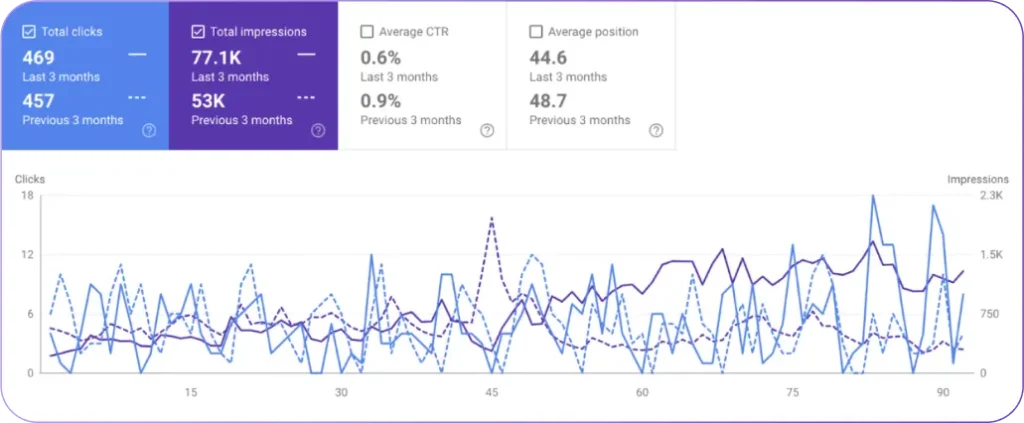
GSC Insights adds depth to a ranking report. The tool pulls keyword data from Google. The platform tracks every search term that triggers the website. It shows how often users see each listing through impression counts. Daily updates reveal exact ranking shifts.
Connect GSC to Search Atlas to centralize keyword data. GSC Insights displays full keyword history in one chart. Clients track rank movement over time. The tool shows traffic and click-through patterns by position. Reports reveal missed opportunities. GSC Insights detects keyword cannibalization across pages. Users resolve conflicts with clear data.
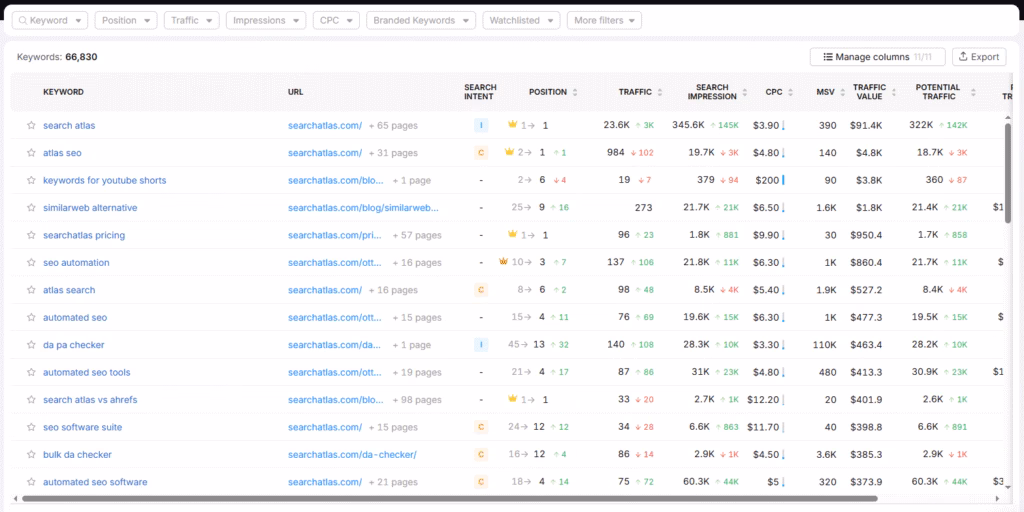
Use filters to segment keywords by performance, brand terms, CPC, impressions, traffic, and watchlist status. Direct data from the source brings accuracy to every report.
What Are the 10 Best Practices for Building an SEO Report?
Building an SEO ranking report for a client requires planning and prioritizing data points. THe key is to highlight all important changes without overwhelming the client. We listed 10 best practices below.
1. Use a Unified Platform for All Marketing Data
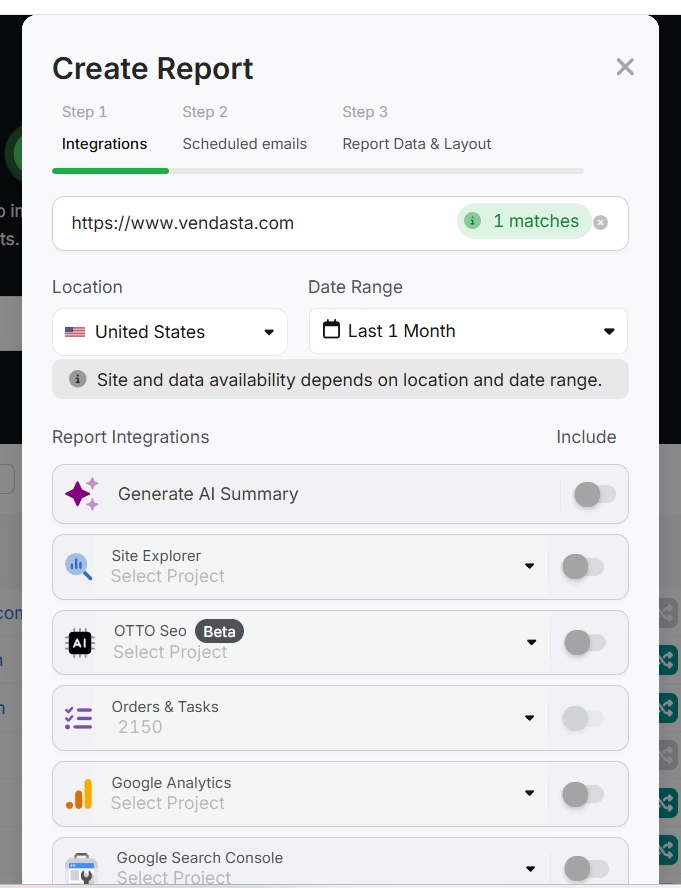
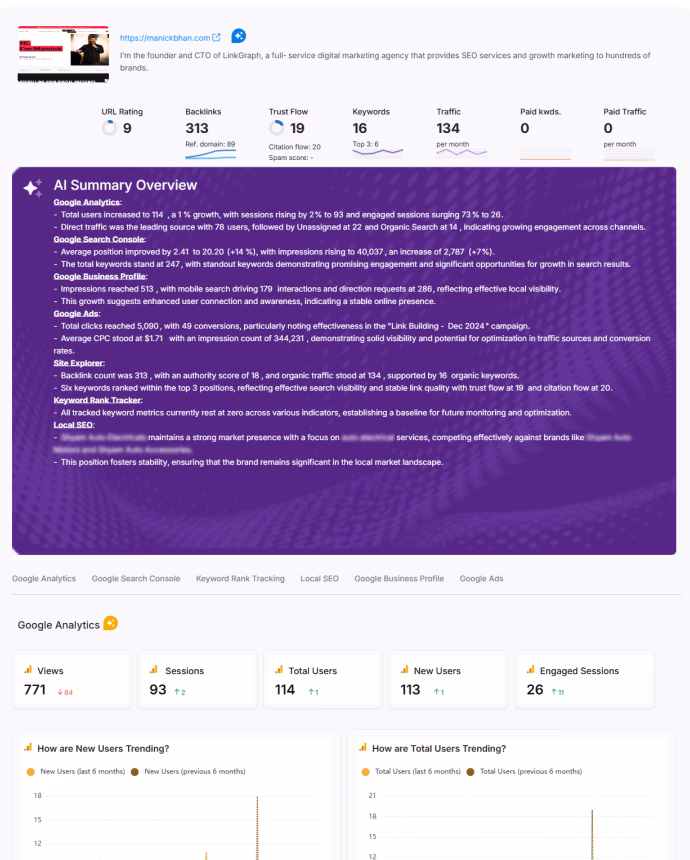
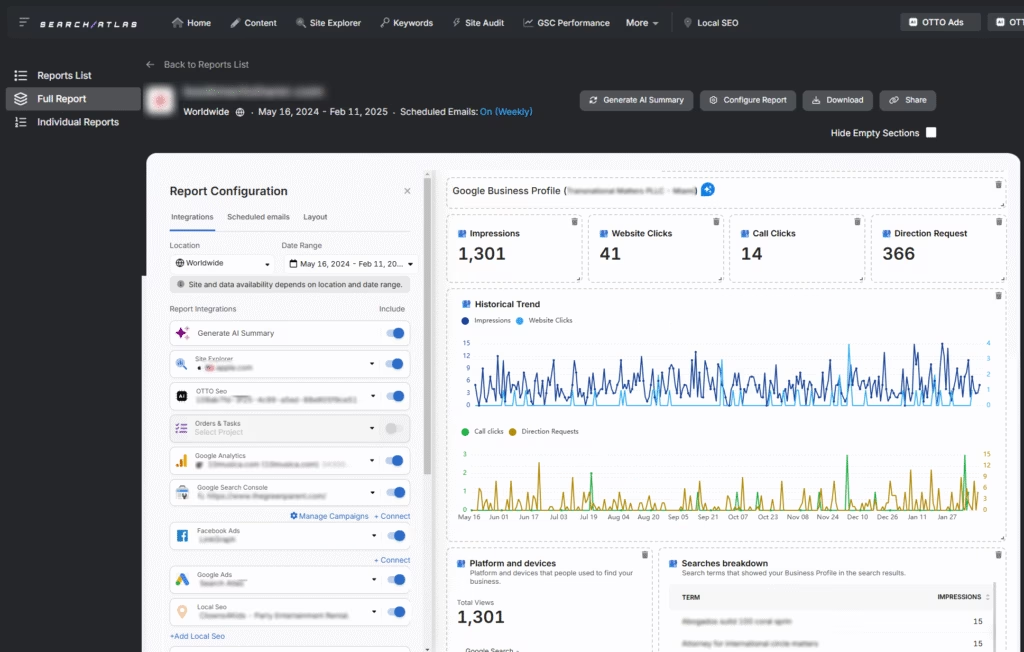
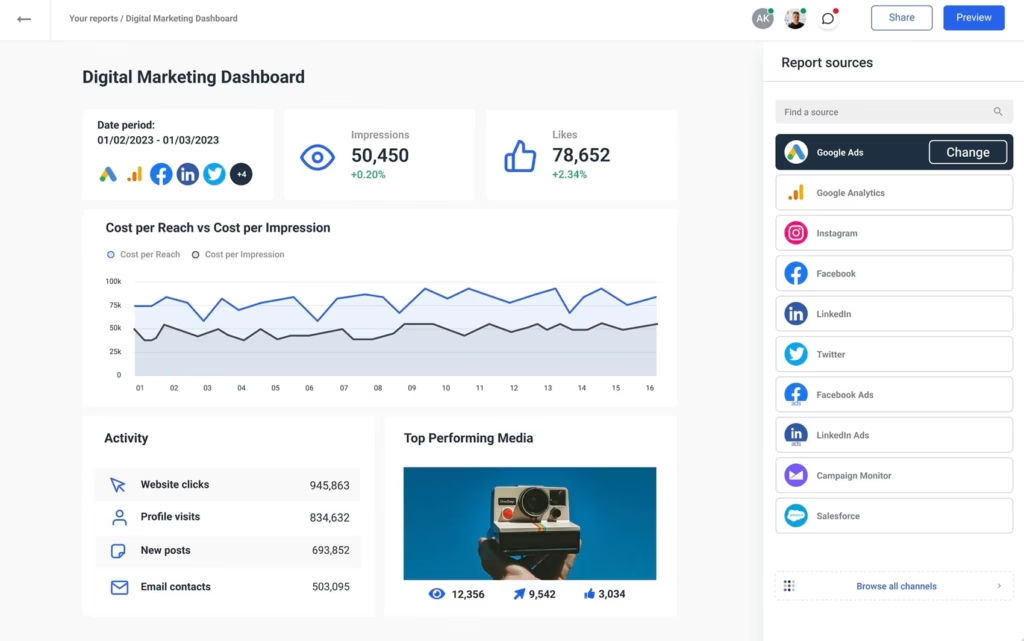
Use a unified report builder to centralize insights from all key sources. Search Atlas combines keyword tracking, GSC data, and GA4 metrics in one platform. This setup removes the need to switch tools or match data manually.
Start by selecting tracked keywords with the Search Atlas Keyword Rank Tracker. Include position changes, traffic shifts, and visibility trends. Show each keyword’s starting rank, current position, and historical movement.
Add keyword-level data from GSC Insights. Highlight impressions, clicks, and rank shifts. Include cannibalization flags and click-through rates by position. Use advanced filters to spotlight branded keywords or traffic-driving terms.
Incorporate GA4 data through the integrated view. Show how ranking pages perform after the click. Present engagement metrics like time on page, bounce rates, and conversions.
Use charts to display trends and patterns. Keep each section focused. Prioritize metrics that reflect campaign goals. Export results or share the dashboard link for collaboration. Build reports that speak to both visibility and business impact, without leaving the platform.
2. Include Only What Matters
Clients appreciate reports that focus on relevant, impactful data without clutter. Prioritize metrics that explain performance and guide next steps. Follow the guidelines below.
- Use the Search Atlas AI Overview to give clients fast and concise insights.
- Exclude branded keywords for clients focused on new customer acquisition.
- Highlight visibility score, average position, and traffic shifts rather than raw ranking lists.
- Use filters to remove low-traffic or irrelevant keywords.
- For ecommerce clients, prioritize product-related keywords and conversion data.
- For local businesses, emphasize local ranking and mobile device data.
3. Set an Automated Schedule for Reporting
Regular updates keep clients informed and engaged. Match the frequency to campaign speed and client preferences to maintain relevance. Report automation best practices are listed below.
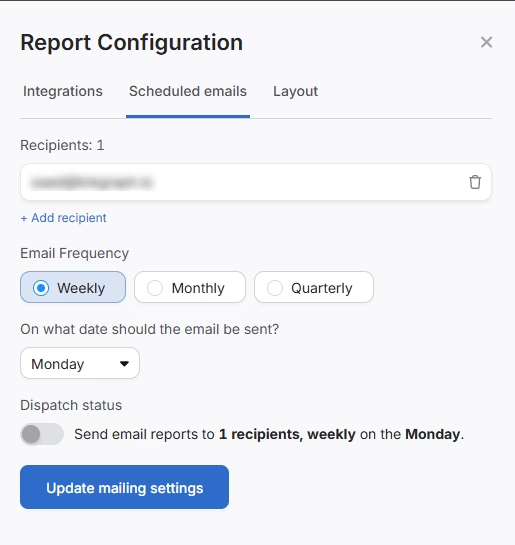
- Choose weekly, monthly, or quarterly reports based on activity level.
- Automate email delivery with clear subject lines and summaries.
- Include consistent sections for easy comparison over time.
- Schedule review meetings aligned with reporting cadence.
- Use scheduled alerts for major ranking drops or spikes.
4. Include Actionable Recommendations
Analyze the data and suggest specific SEO tasks that improve rankings and traffic. Prioritize based on impact and effort. Some starting point tips are listed below.
- Point out keywords with high impressions but low CTR for optimization.
- Recommend content updates for pages losing rank or traffic.
- Suggest fixing technical issues revealed by OTTO SEO.
- Highlight competitor strategies worth adopting or countering.
- Provide quick wins and long-term tasks separately.
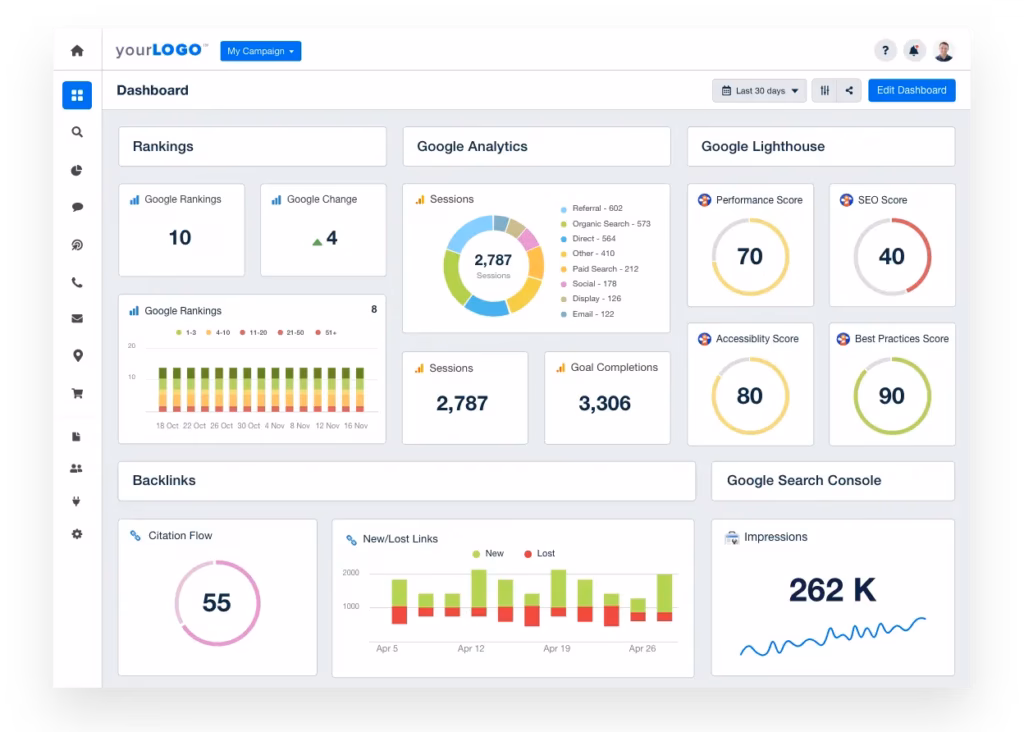
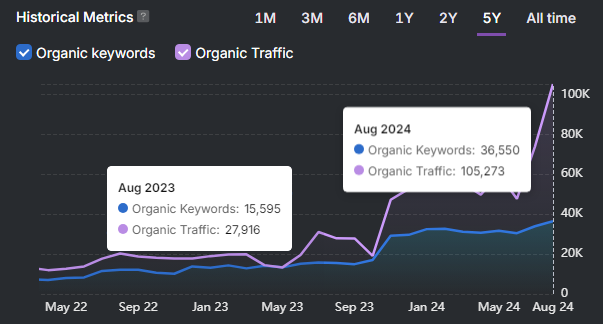
5. Visualize Trends
Visual aids make data easier to understand and remember. Simple lines or bar charts work best to show progress or issues.
Search Atlas automates visualization with reports that are fully customizable and white-label ready.
6. Compare with Competitors
Benchmarking helps clients understand their position in the market. Make comparisons actionable and relevant. Pointers for this practice are listed below.
- List competitors’ URLs, keyword counts in top 10, and visibility scores.
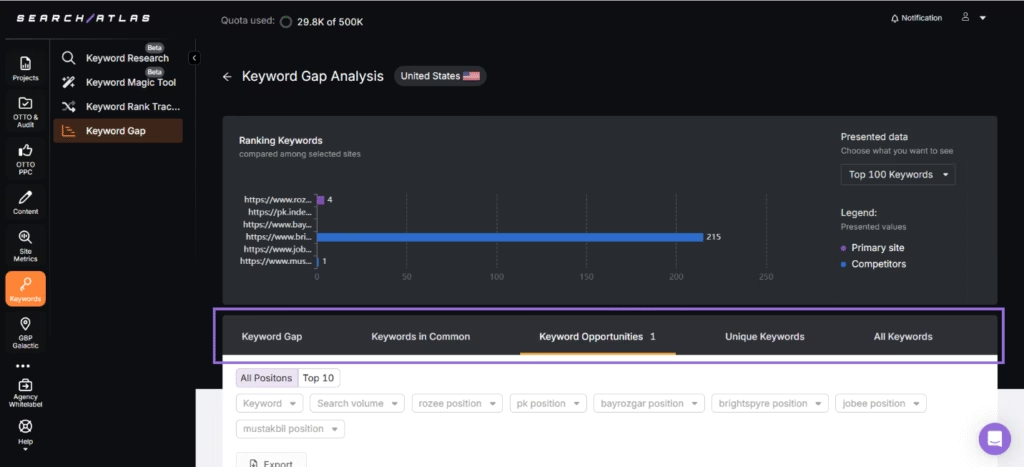
- Use the Keyword Gap Tool to highlight keywords competitors rank for and your client does not.
- Suggest targeted tactics based on competitor strengths and weaknesses.
- Update competitor list regularly to reflect market change.
- Use competitor analysis insights from the Site Explorer to give clients the full picture.
7. Segment by Location and Device
SEO results often vary by location and device type. Breaking down data uncovers performance differences and opportunities for targeted improvements.
- Report local rankings by city, region, or country as needed.
- Separate mobile, tablet, and desktop performance metrics.
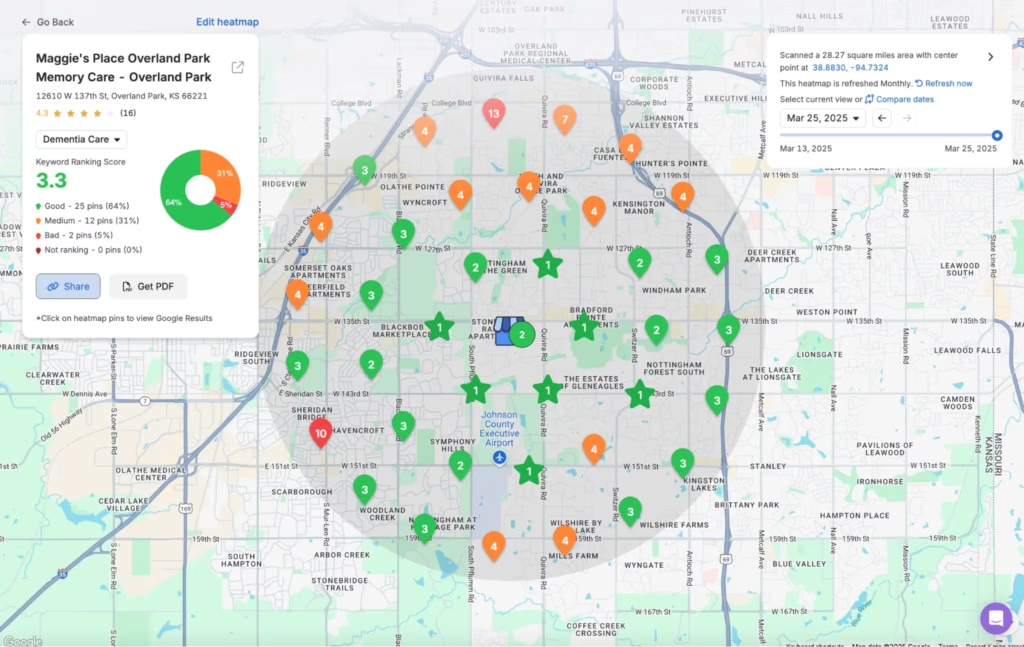
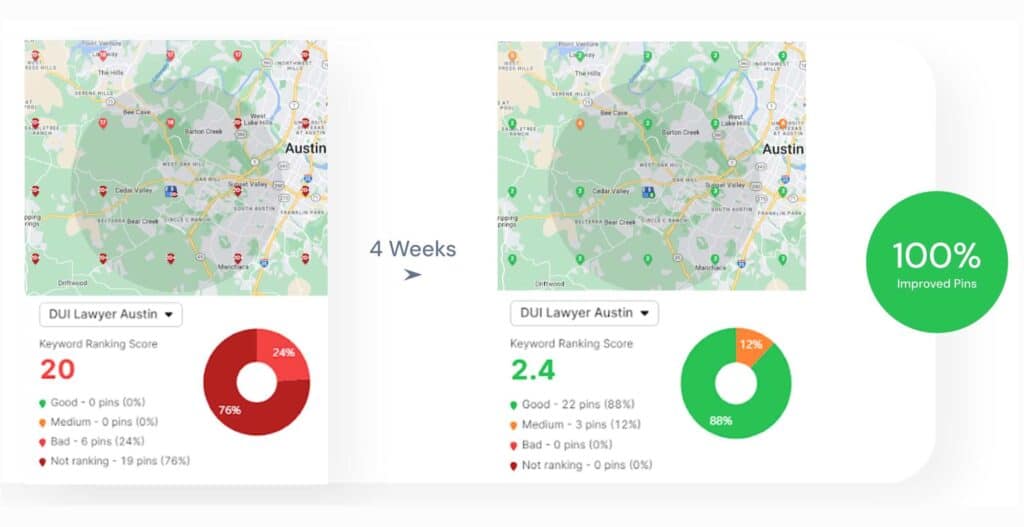
- Use a local search grid to showcase improvements in rankings around a physical location.
- Complement local ranking results with GBP calls, clicks, and other metrics.
8. Highlight SERP Features
SERP features like snippets, local packs, and videos affect click behavior. Tracking these helps optimize content and improve visibility beyond organic listings. In the report, include practices similar to those listed below.
- Identify which SERP features the site captures for target keywords.
- Report on changes in feature presence over time.
- Recommend schema markup or content tweaks to gain features.
- Analyze competitor use of SERP features for ideas.
- Use SERP feature data to explain traffic changes.
9. Call Out Keyword Cannibalization
Multiple pages ranking for the same keyword reduces ranking strength. Marketers frequently mention cannibalization issues in reports and flag them for resolving.
- Detect keyword overlaps using GSC Insights or rank tracker tools.
- Show affected pages and their rankings side by side.
- Recommend content consolidation or canonical tags.
- Track improvements after addressing cannibalization.
- Educate clients on maintaining clear keyword targeting.
10. Export or Share Dashboards
Flexible access to data supports transparency and teamwork. Sharing live dashboards or downloadable reports adapts to different client needs.
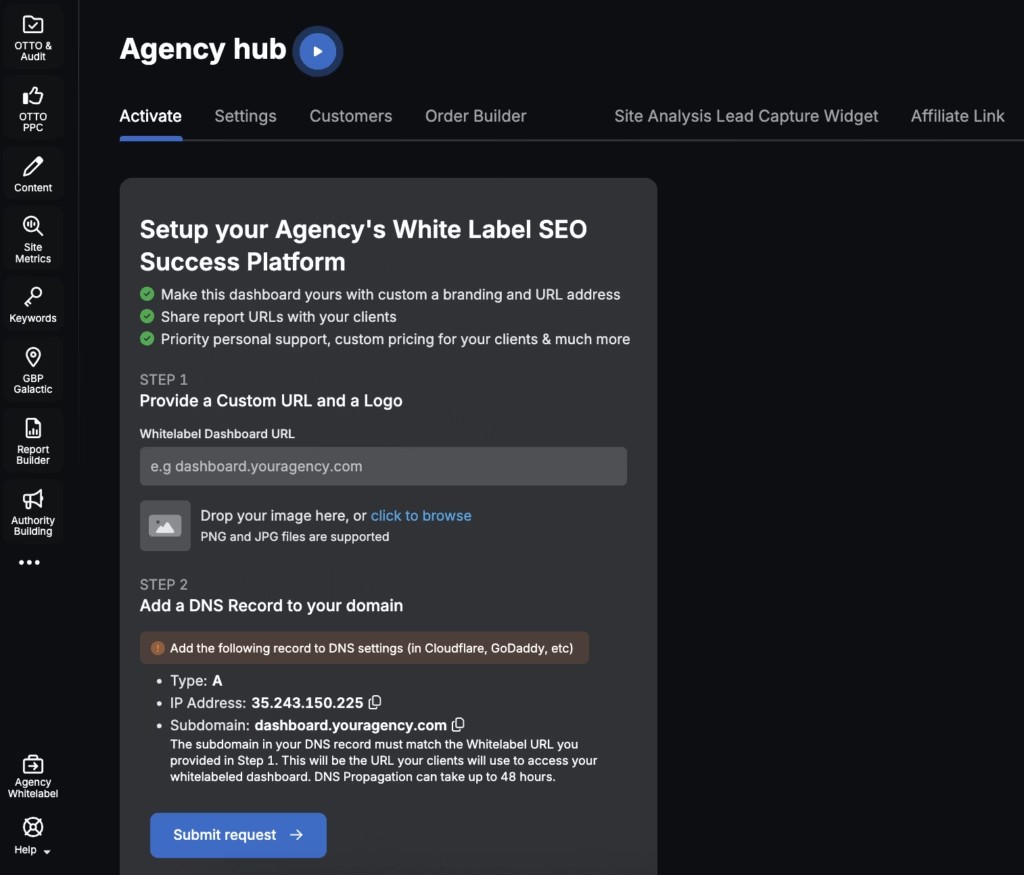
The report builder allows you to white-label features listed below.
- Metrics you want to include
- The dashboard
- The address you send the report from
- The URL
Search Atlas reporting tools offer CSV or PDF exports for offline review or presentations.
What Are the 5 Best Tools to Build an SEO Ranking Report?
The 5 best tools for building an SEO ranking report are reviewed and listed below.
1. Search Atlas
Search Atlas is an all-in-one marketing platform that supports rank tracking, local SEO management, report building, AI tools, and much more.
Search Atlas provides daily keyword updates and on-demand refreshes. The platform tracks keywords through both traditional tools and unlimited Google Search Console tracking. It automates and optimizes Google Business Profile updates.
Popular Features
- Report Builder. Merge rank data with insights from GA4, GSC, GBP, and other connected platforms.
- Rank Tracker. Display current and historical keyword rankings. Pull data from Google Search Console. Avoid disruptions from Google’s 2025 JavaScript update.
- Position Changes. Track shifts in organic and paid rankings. Detect trends with timely updates.
- Reporting Tools. Build white-label SEO and PPC reports. Centralize performance metrics. Generate AI summaries. Schedule delivery for clients.
- Local SEO Tools. Access location-based keyword data. Track local competitors. Automate Google Business Profile updates. Optimize listings through the local aggregator.
- OTTO Assistant. Automate content, technical, on-page, and link-building tasks with the AI agent.
- Local Heatmaps. Visualize rankings against competitors. Map results within a four-mile radius in a client-ready format.
Search Atlas Limitations
- Some users describe the interface as overwhelming. The number of available features contributes to this reaction.
- Some users report longer setup times for OTTO. Larger websites often require more configuration.
Search Atlas Pricing
| Price | $99/month | $199/month | $399/month |
| Free OTTO activation | 1 | 2 | 4 |
| User seats | 2 | 3 | 5 |
| Automated GBPs | 3 | 10 | 25 |
| GSC Site Projects | 5 | 15 | 100 |
| GSC Keywords Tracking per Site | Top 10,000 | Top 100,000 | Top 1,000,000 |
| GSC Pages | Top 2,000 | Top 100,000 | Top 1,000,000 |
| Keyword Rank Tracking Projects | 20 | 50 | 1,000 |
| Keyword Rank Tracking | 1,000 | 2,500 | 5,000 |
| Keyword, Competitor & Backlink Research Tools | Unlimited use | Unlimited use | Unlimited use |
| Keyword Explorer, Keyword Magic, Rank Tracker, and Keyword Gap Analysis | Unlimited use | Unlimited use | Unlimited use |
Search Atlas Reviews
- G2: 4.8/5 (95)
- Capterra: 4.9/5 (66)
2. AgencyAnalytics
AgencyAnalytics is a client reporting platform designed for digital marketing agencies. It automates reports, streamlines campaign analysis, and supports over 80 marketing integrations.
Teams use it to turn SEO, PPC, social, and email data into clear, branded reports. With drag-and-drop tools and prebuilt templates, the setup for AgencyAnalytics takes just minutes.
AgencyAnalytics Popular Features
- Track Google & Bing. Monitor keyword positions on Google, Google Mobile, Google Local, and Bing.
- Update Rankings Daily. Provide accurate daily data across search engines. Maintain consistent visibility for clients.
- Filter Keywords. Sort keyword data by page, tag, location, and language. Reveal precise performance patterns.
- Automate Reports. Send search engine ranking updates without manual work. Reduce reporting time for teams.
- Use Smart Reporting. Insert top-used metrics for each integration. Follow standard agency reporting patterns.
- Define Custom Metrics. Set formulas that reflect campaign goals. Include metrics like blended ROAS and cross-channel spend.
AgencyAnalytics Limitations
- Some users report high costs for scaling the rank tracker across multiple clients. Some users search for AgencyAnalytics alternatives to avoid increased expenses.
- Some users experience disconnections in client accounts.
AgencyAnalytics Pricing
- Freelancer: $79/month – Covers 5 clients with unlimited reports, scheduled delivery, access to 80+ integrations, client portals, and basic branding. Add more clients for $12/month each.
- Agency: $239/month – Covers 10 clients and includes all Freelancer features, plus AI Summary, Ask AI, metric alerts, budget tracking, ad markup, and full white labeling. Add more clients for $18/month each.
- Agency Pro: $479/month – Covers 15 clients with everything in Agency, along with benchmark data, trend prediction, anomaly detection, data aggregation, and priority support. Add more clients for $24/month each.
AgencyAnalytics Reviews
- G2: 4.7/5 (368)
- Capterra: 4.8/5 (114)
3. Whatagraph
Whatagraph is a marketing data platform for agencies and in-house marketing teams. It connects PPC, SEO, social media, and ecommerce data sources. It transforms the data into automated visual reports.
Users build cross-channel dashboards, schedule reports, and share insights with clients or teams. The platform lacks a built-in rank tracker. It integrates with external ranking tools. Whatagraph supports reporting-focused workflows.
Whatagraph Popular Features
- Report Builder. Present keyword rankings, CTRs, and visibility trends in a format that clients understand. Use widgets to highlight SERP KPIs without requiring SEO knowledge.
- Data Integrations. Sync platforms like Google Search Console, Google Analytics, Ahrefs, and SEMrush. Pull keyword data from each tool into one consistent report.
- Keyword Reports. Show performance shifts across tracked terms. Monitor metrics such as position changes, CTR, impressions, and keyword group behavior.
- Customization Tools. Replace branding elements with agency visuals. Edit report colors, upload new logos, and personalize URL links.
- Dashboard Editor. Control layout and structure with drag-and-drop tools. Select modules and adjust styles without touching code.
- Data Blending. Merge PPC, SEO, and social metrics from platforms like Facebook Ads and Google Ads. Produce unified views across all campaigns.
Whatagraph Limitations
- Some users report high pricing.
- Reviews describe slow syncing. Data transfers from specific third-party platforms create delays during integration.
Whatagraph Pricing
- Contact the sales team for a quote.
Whatagraph Reviews
- G2: 4.5/5 (277)
- Capterra: 4.4/5 (84)
4. SE Ranking
SE Ranking is a full SEO platform that includes tools for keyword tracking, backlink analysis, website audits, and competitor research. SE Ranking tracks rankings across Google, Bing, Yahoo, and YouTube.
SE Ranking includes local and mobile data. It uses daily updates to maintain precision. With SE Ranking, users deliver detailed SERP competitor analysis, monitor over 37 SERP features, and build simple automated reports.
SE Ranking Popular Features
- Advanced Rank Tracking. Track keyword positions daily across mobile and desktop. Use precise filters by country, city, or ZIP code.
- Competitor Monitoring. Track up to 20 competitors. Visualize their ranking changes. Reveal gaps and opportunities.
- Local SEO Tracking. Monitor local rankings and SERP features. Focus efforts using data from 190 countries.
- SERP Features Tracker. Track over 37 SERP features. Include AI Overviews. Adjust strategies based on feature presence.
- Click Data Insights. Access fresh click data every day. Measure traffic impact by keyword position.
- Keyword Tags Report. Group keywords by tags or target URLs. Gain detailed visibility. Refine keyword targeting.
Limitations
- Some reviews describe steep pricing for small businesses.
- A few users report lower data accuracy for nNiche industries and low-traffic sites.
Pricing
- Essential. $65/month – For individual SEO professionals, offering 1 manager seat, 5 projects, and 500 daily keyword tracks, plus core SEO tools and add-ons.
- Pro. $119/month – For agencies and small teams, includes 3 manager seats, 30 projects, 2,000 daily keyword tracks, core tools, and extra features with add-ons.
- Business. $259/month – For large agencies, offering 5 manager seats, unlimited projects, 5,000 daily keyword tracks, and core tools.
Reviews
- G2: 4.8/5 (1,374)
- Capterra: 4.7/5 (284)
5. Semrush
Semrush is a popular SEO and PPC platform built for agencies, in-house teams, and digital marketers. Use it to track keyword rankings, audit websites, research competitors, and analyze backlink profiles.
Run position tracking across domains and locations. Analyze both paid and organic visibility. Monitor keyword intent, traffic potential, and SERP features. Detects ranking shifts in real time. Integrate with tools like GA4 and GSC to centralize performance data.
Semrush Popular Features
- Keyword Strategy Builder. Shape targeted SEO and content plans using bulk keyword data from multiple sources. Build scalable workflows for large campaigns.
- Position Tracking. Track keyword rankings daily across devices and locations. Detect shifts through automated alerts.
- SERP Tracking Tools. Monitor search result performance. Identify new visibility opportunities from Google’s SERP layout.
- Sensor. Detect volatility patterns in SERPs. Flag possible algorithm changes across industries.
- Ranks. Analyze domain-level performance in both organic and paid search. Sort by keyword sets and regions.
- Map Rank Tracker. Track Google Maps rankings using a grid-based view. Compare your location data with nearby competitors.
Semrush Limitations
- Some reviewers describe the 100-keyword analysis limit as restrictive for larger campaigns.
- Others describe the interface as overwhelming for beginners.
Semrush Pricing
- Free: $0 – Supports 10 keyword searches daily, analyzes up to 10 domains per day, tracks 10 keywords, crawls up to 100 URLs, and monitors local listings.
- Pro: $139.95/month – Manages 5 projects, tracks 500 keywords, and supports up to 10,000 results per report.
- Guru: $249.95/month – Supports 15 projects, 1,500 tracked keywords, 30,000 results per report, includes historical data, content marketing tools, and Looker Studio integration.
- Business: $449.95/month – Supports larger teams with 40 projects, 5,000 tracked keywords, 50,000 results per report, API access, and higher limits.
Semrush reviews
- G2: 4.5/5 (2,614)
- Capterra: 4.6/5 (2,289)
Manage Your Ranking Reports Easily With Search Atlas
Tracking rankings across different tools helps highlight wins and losses, but it creates noise. When reports scatter across dashboards, it’s easy to lose focus on what really matters
A platform like Search Atlas simplifies the process. It pulls all ranking, traffic, and keyword data into one clear, customizable dashboard. Instead of jumping between tools, you get a unified view of SEO performance. For agencies and teams managing complex campaigns, that clarity changes everything.
Try Search Atlas FREE for 7 days. No commitment, cancel anytime.


