

Supermetrics vs Whatagraph are two names every data-driven marketer hears when it’s time to prove results and wow the team. 👥
Managers and marketers alike need reporting tools that save time, pull data from every corner of the web, and turn numbers into clear, impressive reports.
Supermetrics and Whatagraph lead the pack, but plenty of other alternatives exist for those chasing the perfect fit. This article dives into the key differences between these two popular marketing analytics tools and uncovers which one delivers the edge your agency or marketing team needs. Let’s get started!
What is Supermetrics?
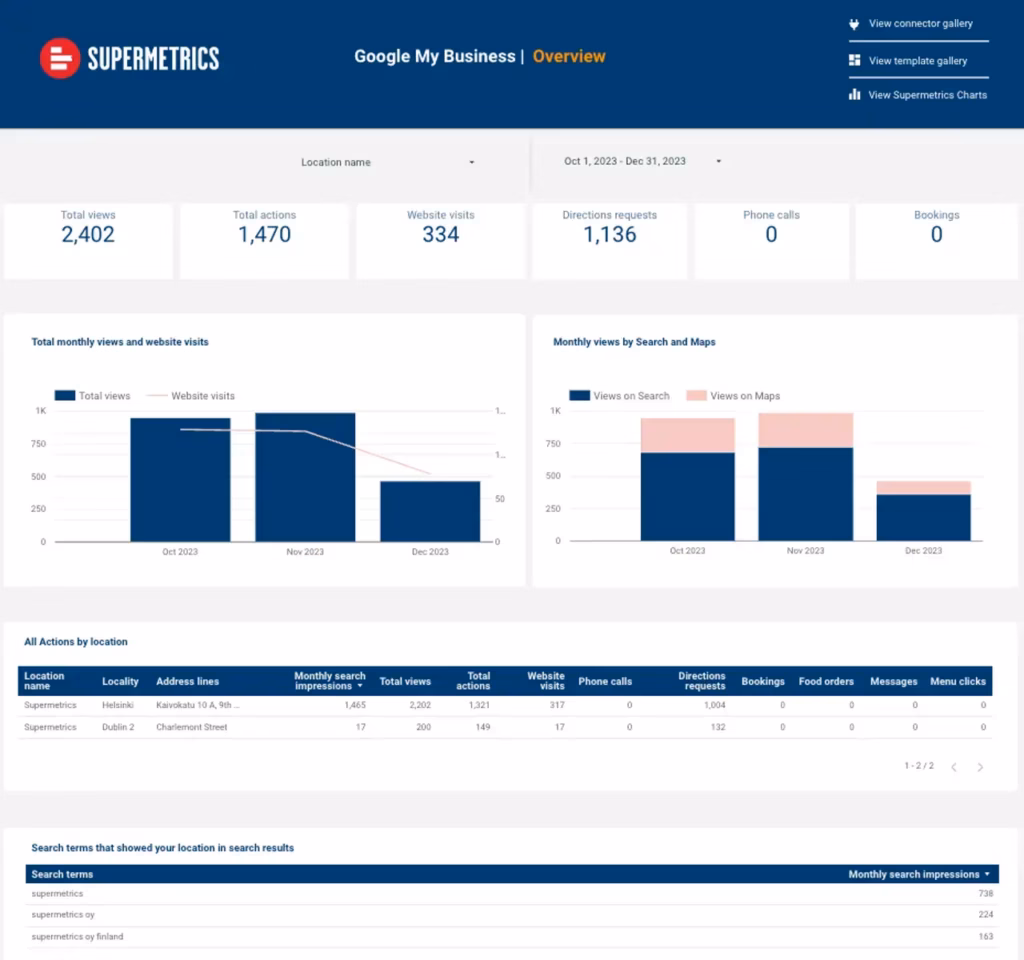
Supermetrics works as a marketing data platform (connect, organize, visualize) built for teams that need simple, clear reporting. It connects to multiple data sources and creates cross-channel reports and dashboards in minutes.
The platform handles report automation, data grouping, and data blending without hassle. Users create polished dashboards and automate recurring reports without wasting time on manual updates.
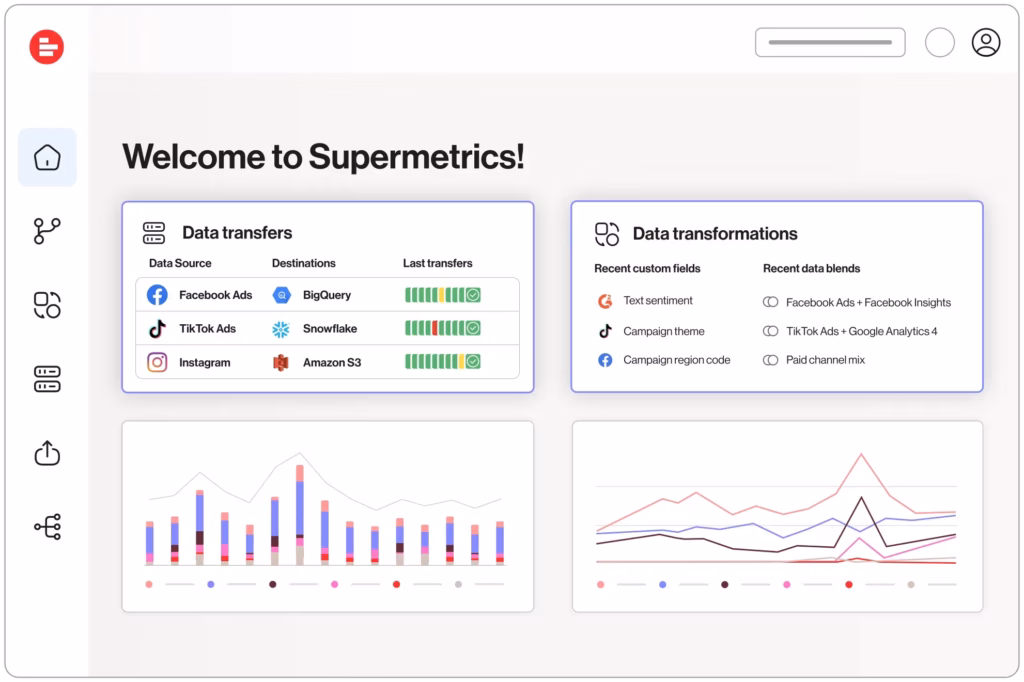
Supermetrics acts as an ETL tool (extract, transfer, load) that pulls data from 100+ marketing and advertising sources. It moves that data straight into tools like Google Sheets, Excel, Google Data Studio, and major data warehouses like BigQuery, Snowflake, and Amazon Redshift. Marketers transform, filter, and calculate data within the platform and build custom dashboards inside the tools they already trust.
Supermetrics schedules data refreshes and SEO report deliveries, which keeps analytics up to date without lifting a finger. It tracks advertising costs, reveals return over investment (ROI) insights, and helps optimize marketing budgets with precision.
What Are Supermetrics Benefits and Features?
- LinkedIn Conversions API Integration. Access conversion data beyond website tracking and automate uploads with smooth data mapping.
- Simplified Data Blending Templates. Blend data faster using 3 ready-to-go templates for quicker, easier multi-source reporting setups.
- Power BI Quick Queries. Instantly visualize important metrics with 1-click queries directly inside Power BI dashboards and reports.
- Automated Data Extraction. Pull data automatically from 100+ sources into your reporting tools.
- Custom Data Imports via Email. Import data from unsupported sources using email or custom files for flexible, tailored reporting control.
- Scheduled and Automated Reports. Set reports to run on specific schedules, delivering timely data without manual effort or delays.
- Supermetrics Storage Solution. Store extracted data safely, improve dashboard speed, and prevent data loss during API outages.
- Data Transformation Rules Management. Apply custom transformation rules during data extraction to maintain clean, consistent, and accurate reporting results.
What is Supermetrics Pricing?
Supermetrics charges a subscription fee, with pricing based on the integration tool you connect and use. Below is the pricing for different integrations.
- $29/month. Google Sheets. Looker Studio. Power BI. Microsoft Excel.
- Custom pricing. Supermetrics API. BigQuery. Azure Synapse. Azure Storage. Google Cloud Storage. Amazon Redshift. Amazon S3. Snowflake. Google AlloyDB. Azure SQL Database. SFTP.
What is Whatagraph?
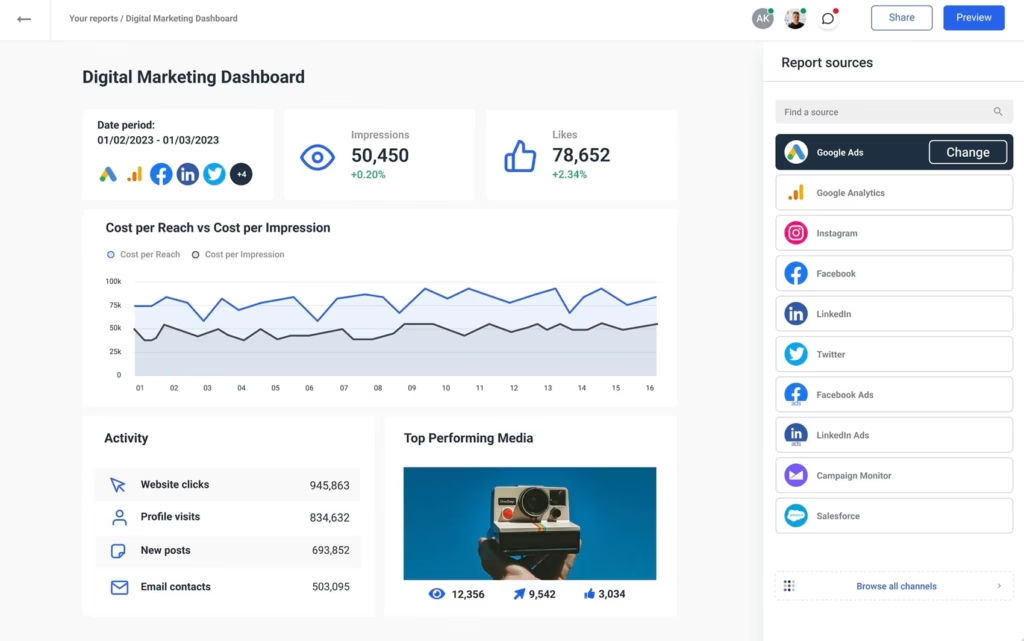
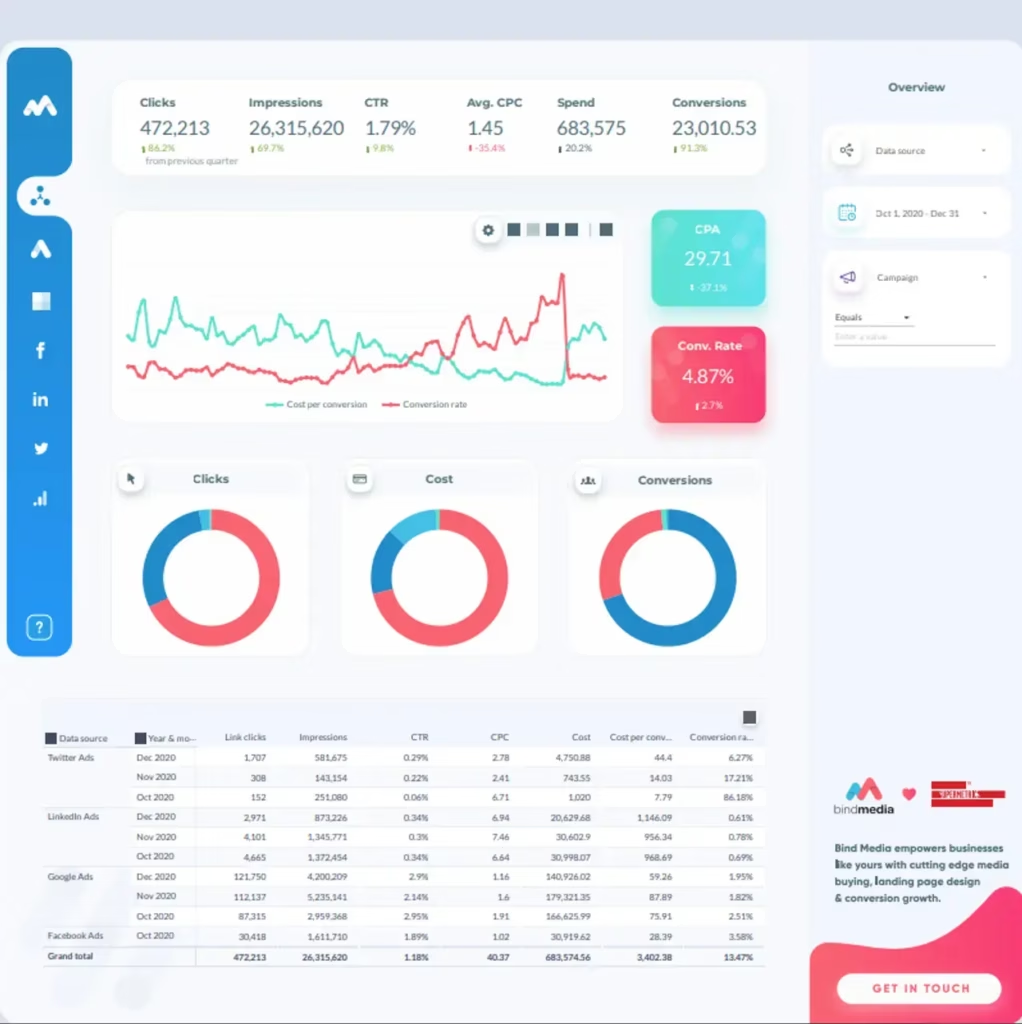
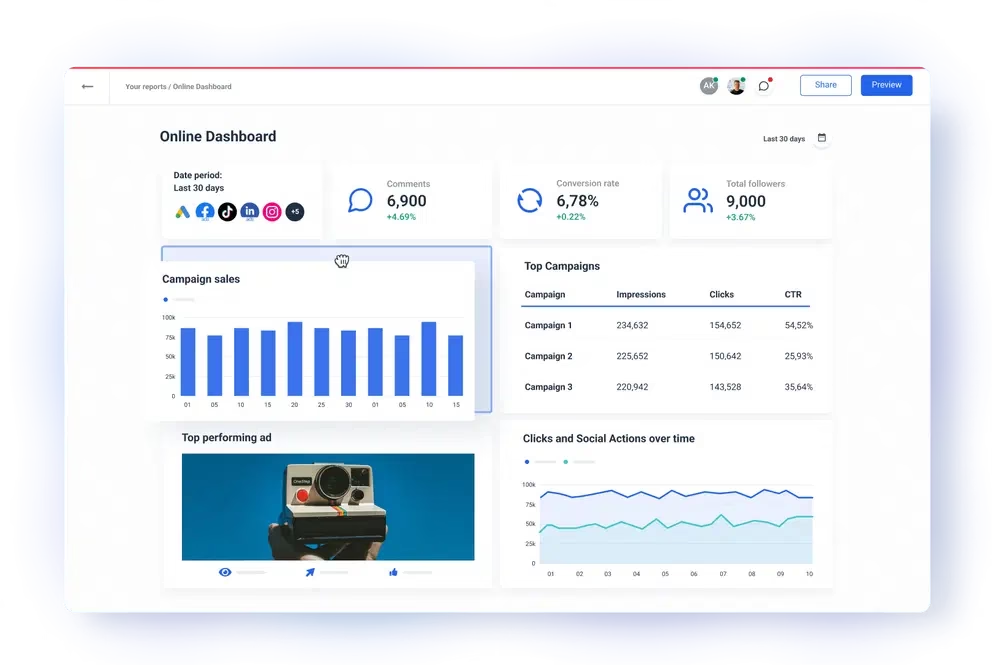
Whatagraph works as a marketing analytics and reporting tool (connect, collect, visualize) built for agencies and marketing teams. It pulls data from multiple sources, transforming numbers into interactive, easy-to-read reports packed with charts, tables, and graphs.
The platform connects to popular tools like Google Analytics (GA4), Facebook Ads, LinkedIn, Twitter, and Instagram, providing a complete view of marketing performance.
Users build cross-channel reports by blending data from different platforms, revealing insights that single-source reports often miss. Whatagraph supports 30+ direct API integrations, which means automatic data collection and fewer human errors during reporting. The platform gathers data, processes it, and delivers visual reports without the need for manual copy-paste sessions.
Whatagraph integrates with 40+ marketing platforms, delivering fresh, organized data directly into its own reporting tool. Teams save hours by replacing slow manual tasks with automated reporting processes, keeping campaign results accurate, visual, and ready for clients or managers at any time.
What Are Whatagraph Benefits and Features?
- AI-Powered Insights. Track performance proactively using AI-driven insights that highlight key trends, changes, and improvement opportunities.
- Customizable Reports and Dashboards. Build personalized reports with drag-and-drop widgets, ready-made templates, and white-label design options.
- Comprehensive Integrations Support. Connect 50+ marketing data sources (analytics, ads, social) and manage everything in one unified platform.
- Data Grouping and Blending. Combine campaigns, countries, and metrics into single widgets for clearer, multi-source performance reporting.
- Pre-Made Widgets and Templates. Speed up report creation using ready-to-use visualization elements, layout templates, and reporting building blocks.
- Automated Report Generation. Schedule and send PDF reports or email notifications, keeping stakeholders updated without manual follow-ups.
- Data Export and Warehouse Integration. Export reports in Excel, CSV, and sync data with BigQuery for advanced, large-scale analysis.
- Custom Branding and White-Label SEO reporting. Apply personalized colors, logos, and email templates to match each client’s brand identity.
What is Whatagraph Pricing?
Whatagraph offers flexible pricing plans built to match different team sizes, reporting needs, and data sources.
Supermetrics vs Whatagraph. Which Platform Deserves a Spot in Your Stack?
This section highlights each tool’s top features before pointing you toward a stronger option.
1. Data Connectors
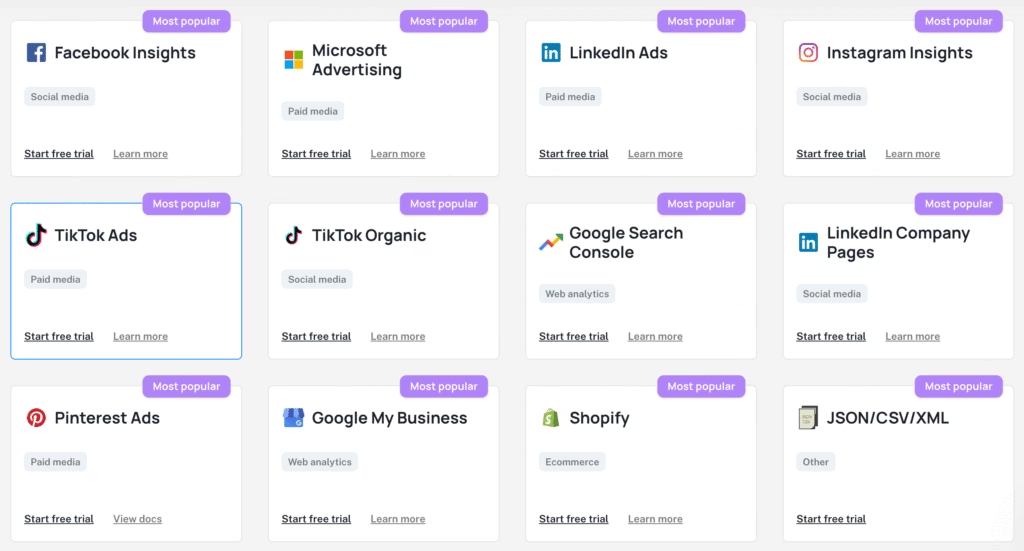
Supermetrics powers its platform with 138+ data connectors, covering every vital area of digital marketing. Users can pull data from paid media (Google Ads, TikTok Ads, Facebook Ads), social media (Instagram, TikTok, Facebook), and web analytics tools (Google Analytics, Adobe Analytics).
It connects with SEO platforms (Ahrefs) and CRM systems (HubSpot, Salesforce, CallRail).
Supermetrics organizes these connectors into clean groups (paid media, web analytics, social media) for faster, focused reporting.
Whatagraph features over 55 integrations, giving users quick access to social media, PPC, SEO, and analytics platforms. Its data connectors allow direct pulls from popular tools like Facebook, LinkedIn, GA4, and Google Ads.
Whatagraph groups connectors into categories (social, SEO, e-commerce) to simplify reporting processes. It offers smooth connections with tools like Shopify, SEMrush, BigQuery, and ActiveCampaign, keeping data streamlined within one accessible platform.
Winner: Supermetrics
Supermetrics leads with a stronger, broader network of 138+ connectors built for marketing teams. Its larger scope, deeper category options, and ETL features give users sharper control, better flexibility, and a more powerful reporting workflow across 70+ marketing and analytics platforms.
2. Ease of Use
Supermetrics keeps its interface clean, functional, and accessible for marketers managing multiple data sources. The platform uses an intuitive layout with tools like Query Manager, enabling users to test and fine-tune data pulls before launching workflows.
Its no-code setup and logical navigation speed up data transformations and report creation across various destinations.
Whatagraph simplifies reporting tasks with a drag-and-drop interface and clear, responsive navigation. Users move through report setup, widget placement, and automation settings without technical barriers.
It delivers smooth, hassle-free client reporting with automated monthly updates. The platform’s visual layout keeps everything visible, which helps marketers track data without digging through menus.
Winner: Whatagraph
Whatagraph wins on ease of use by turning complex reporting into a visual, drag-and-drop experience. Its automation tools, clean layout, and beginner-friendly design keep tasks fast, clear, and simple.
Data Destinations
Supermetrics connects data from 138+ sources and sends it to 16 destinations for smooth reporting. Popular options include Looker Studio, Power BI, Google Sheets, Microsoft Excel, and BigQuery.
The platform covers cloud storage and data warehouses like Snowflake, Amazon S3, and Azure Synapse. Supermetrics works as a data pipeline, moving information to your preferred tools for analysis. Its API handles custom workflows and connects with Tableau, ensuring flexibility.
Whatagraph offers reliable destination options focused on practical marketing reporting. Users export data to Google Sheets, BigQuery, and Looker Studio with just a few steps.
The platform provides a custom API for connecting with additional tools. It prioritizes simplicity, allowing marketers to move data into familiar environments without technical complexity.
Winner: Supermetrics
Supermetrics leads on data destinations by covering more services, storage options, and business intelligence platforms. Its API extends flexibility while providing seamless integration with major analytics and cloud environments, ensuring data flows wherever reporting demands it.
4. White-label
Whatagraph lets users apply custom branding effortlessly. Add agency logos, adjust color palettes, and configure chart designs to match brand visuals. Pre-saved templates keep reports consistent while offering individual customizations in SEO reports for clients.
Supermetrics skips white-label options for its users. Reports and dashboards display default Supermetrics visuals, leaving no room for agency-specific logos, color schemes, or branded templates.
Winner: Whatagraph
Whatagraph outshines by offering full white-label control. Agencies build client-ready reports reflecting their identity through tailored colors, logos, and templates, leaving zero generic visuals behind.
5. AI Features
Supermetrics uses AI-driven prompts to enhance data within custom fields. Apply it for sentiment analysis, text cleaning, translations, and data enrichment, creating smarter workflows across marketing campaigns (cleaning, extracting, transforming).
Whatagraph introduces an AI chatbot for instant marketing insights. This tool answers performance questions, summarizes reports, and delivers quick overviews, saving time on manual data reviews (insights, summaries, reports).
Winner: No winner
Neither platform unlocks AI’s full potential. You need to use a stronger solution that combines advanced automation with deeper, scalable AI features.
6. Pricing
Supermetrics applies AI-powered prompts inside custom fields to clean, translate, extract, and enrich data. Use it for transforming raw metrics into actionable insights (sentiment analysis, text classification, translations).
Whatagraph delivers an AI chatbot that responds to marketing performance questions, generates report summaries, and gives instant insights without extra manual reporting.
Winner: None of the options
Neither platform justifies their pricing. Both tools charge premium rates without offering balanced value for what marketers actually receive.
What does Search Atlas Brings of New in the Supermetrics vs Whatagraph Debate?
Supermetrics and Whatagraph stick to traditional metrics, static dashboards, and manual reporting. Search Atlas takes a smarter path, using machine learning (task automation, data enhancement, precision analysis) to simplify SEO reporting.
This strategy cuts complexity, reduces costs, and unlocks tools most premium platforms miss.
What Is Search Atlas?
Search Atlas delivers a complete SEO platform combining keyword research, SERP tracking, backlink analysis, competitor insights, and local SEO management. The platform includes technical audits, on-page recommendations, and automated PR outreach tools.
The Report Builder turns raw performance data into professional, client-ready reports (fast, clean, branded). Integrate essential SEO KPIs from multiple sources, customize layouts, and apply full white-label options for agency-ready documents. Share reports through direct URLs or downloadable PDFs, keeping presentations sharp and consistent.
What Are Search Atlas Features and Benefits?
The features below focus on reporting capabilities. Explore other powerful tools on the Search Atlas features page.
Report Builder
Search Atlas Report Builder centralizes multiple marketing data points into one streamlined reporting system. Generate detailed client reports by connecting essential data sources (performance metrics, keyword rankings, local results) and integrating them into branded layouts.
Firstly, start by entering a URL, choosing integrations, and setting location, date range, and scheduling preferences. Reports pull real-time data from 5 core Google services: Google Analytics (GA4), Google Search Console (GSC), Google Business Profile (GBP), Keyword Rank Tracker, and Local Heatmaps.
Connect accounts through a simple settings panel for instant data syncing.
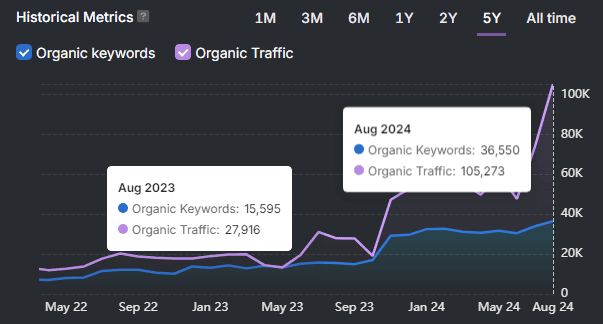
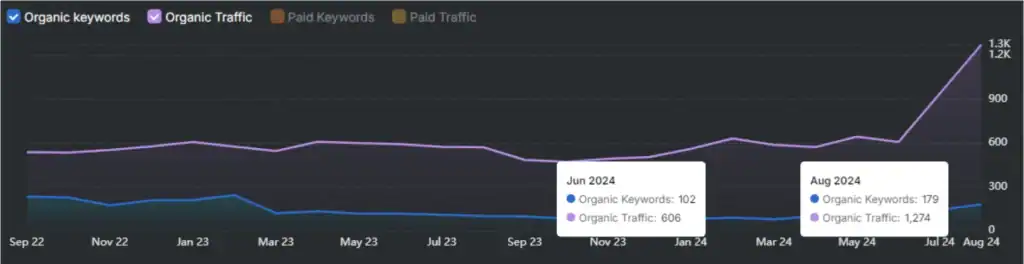
Site Explorer adds domain-level metrics (Domain Rating, URL Rating, Trust Flow), backlinks, keywords, organic traffic, paid keywords, and paid traffic.
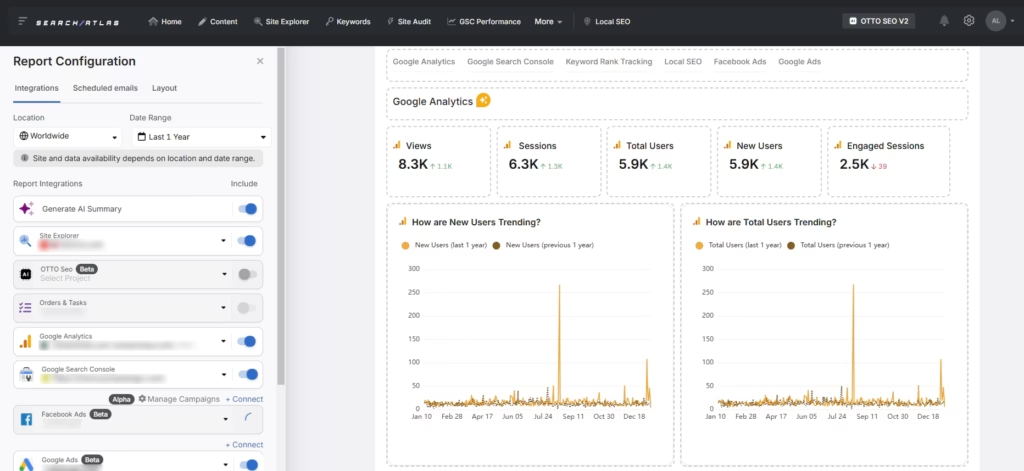
GA4 dashboards display sessions, views, new users, engaged sessions, conversions, traffic sources, top pages, and events. Measure trends through dashboards like “How are New Users Trending” and “Which Channels are Driving Engagement.”
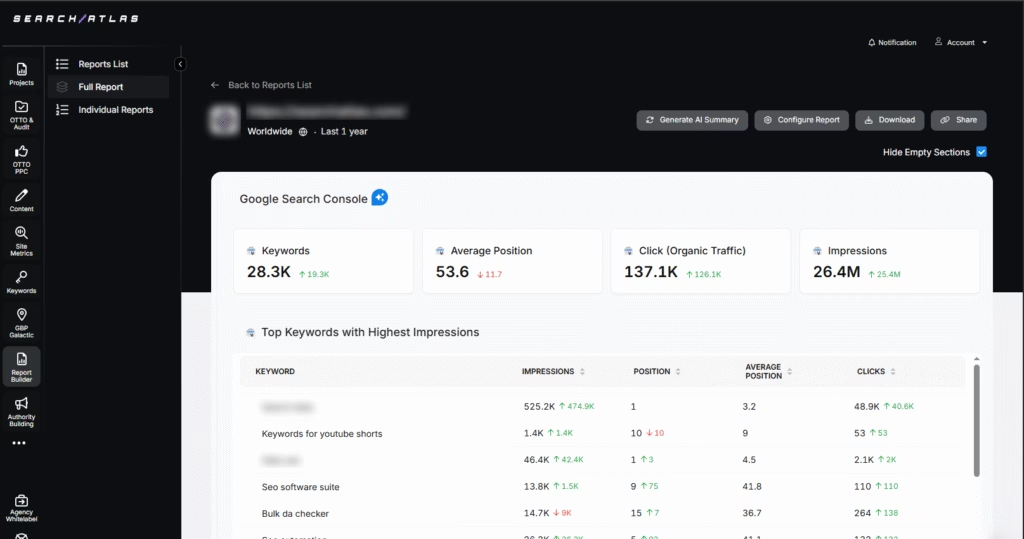
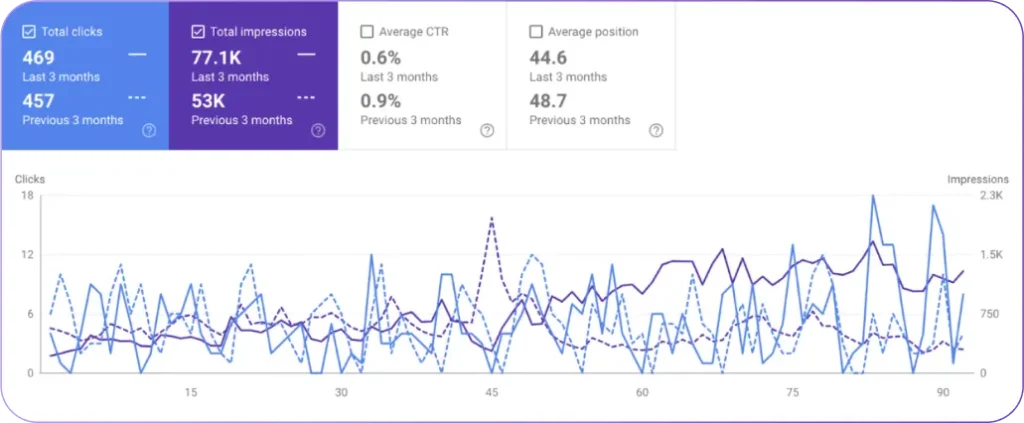
GSC data tracks keywords, impressions, clicks, average position, and keyword trends by device and day of the week. See top-performing keywords and identify organic traffic patterns.
Keyword Rank Tracker monitors tracked keywords, search visibility, average position, and the number of keywords ranking in the top 10 positions (search trends, rank shifts, visibility growth).
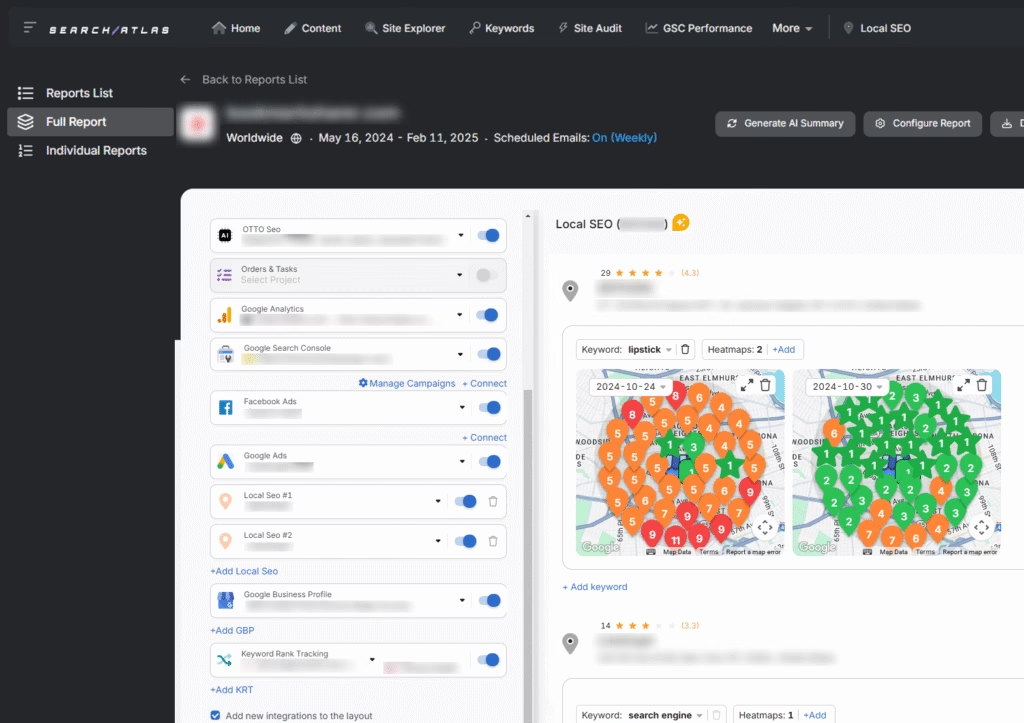
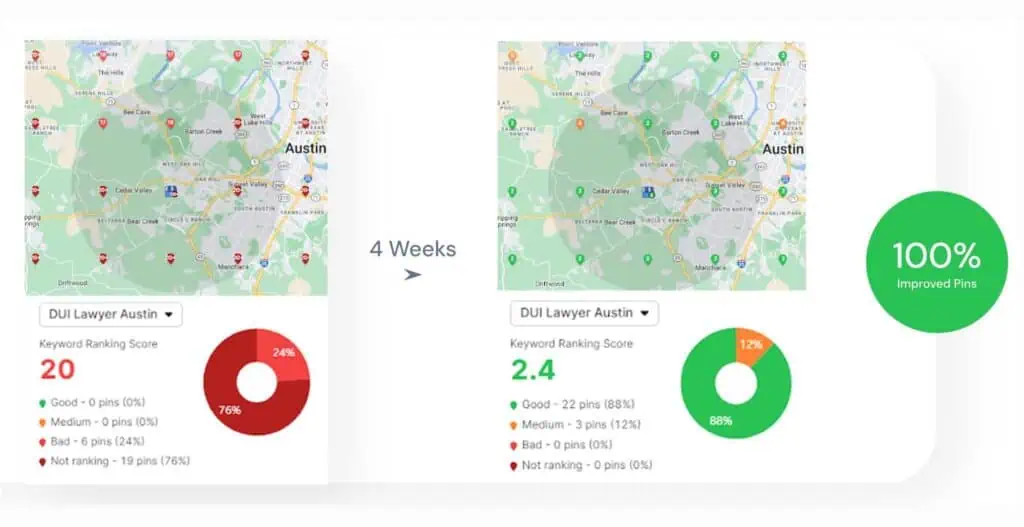
Local SEO heatmaps reveal geographic ranking variations, offering granular location-based visibility. GBP reporting tracks impressions, website clicks, call clicks, and direction requests, helping optimize local engagement strategies.
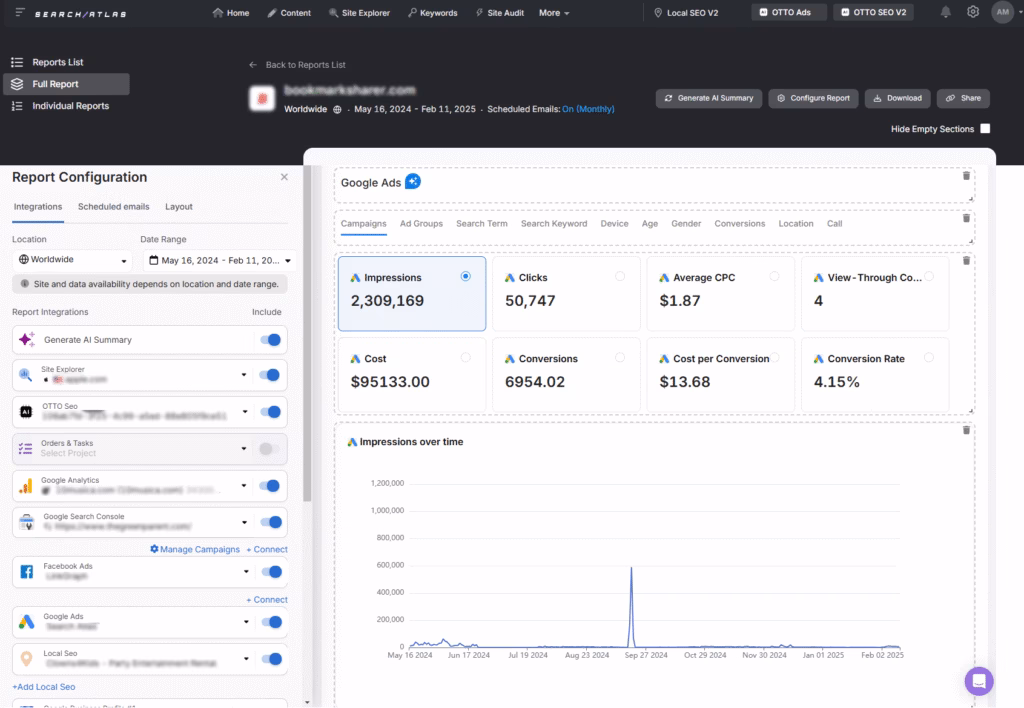
The report builder integrates Google Ads and Meta Ads. It delivers paid campaign data alongside organic performance for clear, unified reporting (ad metrics, audience insights, conversion tracking).
Each connection transforms raw data into practical, actionable insights, delivering complete, data-driven reporting with shareable URLs and PDF export options.
Ease of use
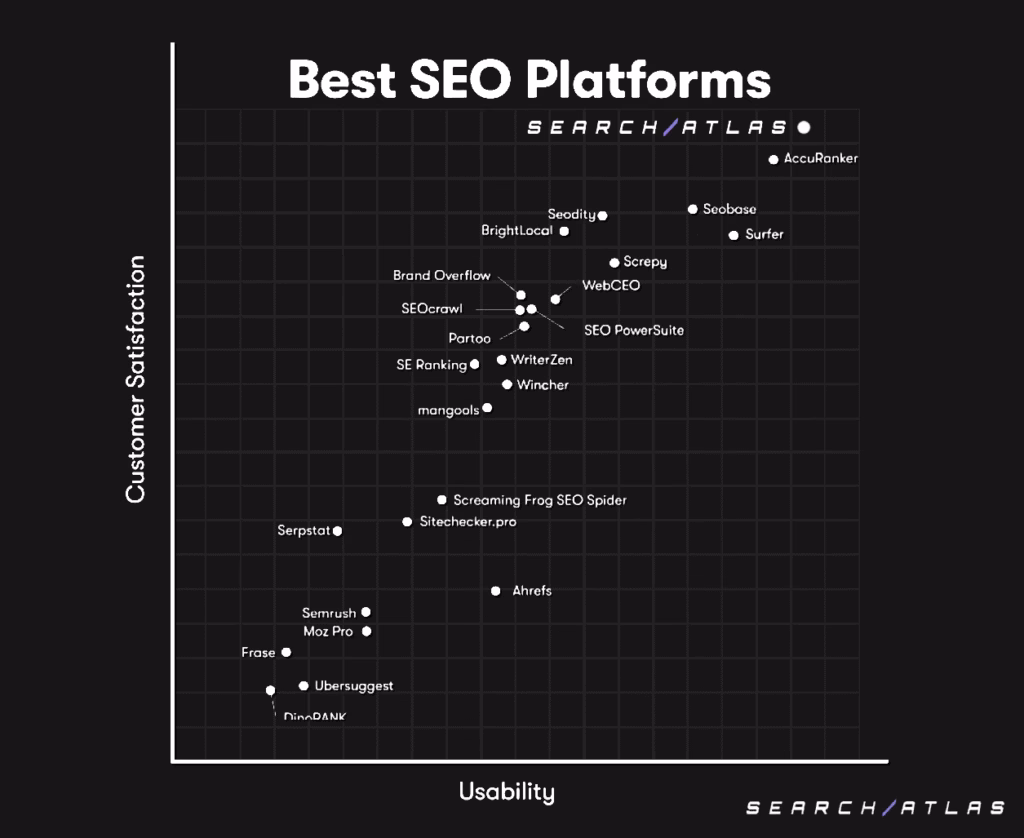
Gartner praised Search Atlas for its intuitive design, speed, and simplicity. Search Atlas ranks above Ahrefs, Serpstat, SEMrush, Moz Pro, SE Ranking, and several other platforms.
White-label
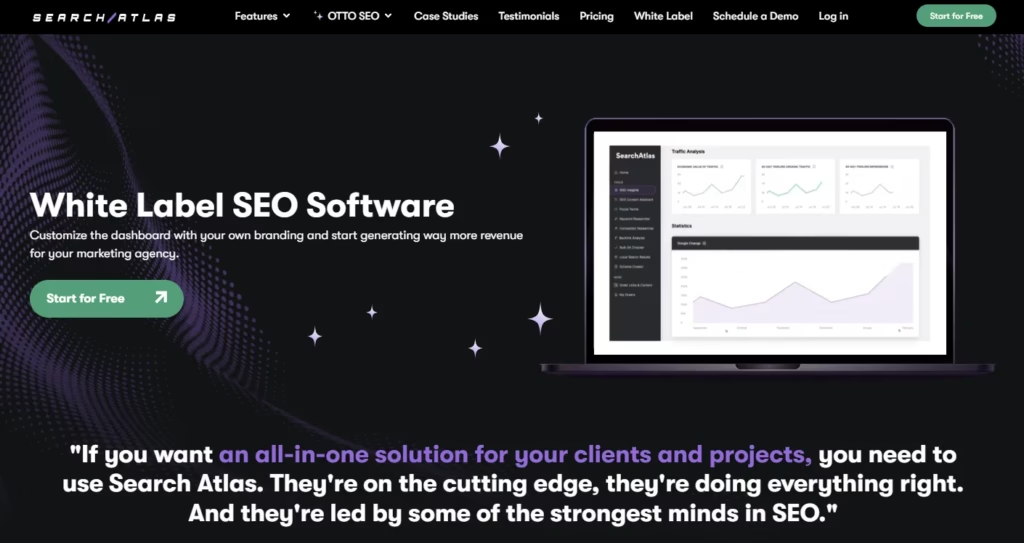
Search Atlas Report Builder turns reports into branded experiences by letting agencies use custom domains, personal logos, and tailored color schemes.
Add your agency name to the dashboard URL, control every visual detail, and deliver polished, professional reports. White-label settings keep the client focus on your brand, not third-party tools.
AI features
The Search Atlas Report Builder uses AI-powered summaries to transform raw data into clear, actionable insights.
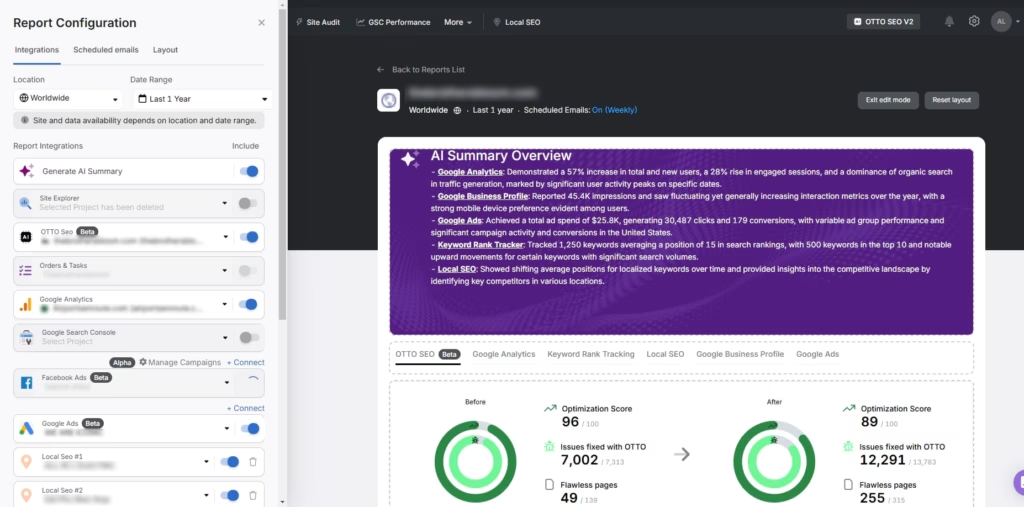
Each module (Site Explorer, Google Ads, Meta Ads) features a summary icon. Hovering reveals key takeaways. Positive trends, growth areas, and strengths appear first, while weaker data receives neutral, factual overviews.
The Generate AI Summary toggle in the configuration menu controls activation across reports. This system highlights wins, tracks opportunities, and simplifies client reporting. Regenerate summaries instantly by clicking the button, triggering real-time updates (new insights, fresh numbers, updated context).
Summaries display inside private dashboards and shared public URLs. Every report keeps context relevant and client-ready without clutter.
SEO features
Search Atlas is an all-in-one enterprise platform for SEO and PPC that brings innovation. The tools that Search Atlas brings are below.
- OTTO SEO. AI-powered website optimizations.
- OTTO Google Ads. AI-driven ad management for Google Ads campaigns.
- Enterprise SEO Software. Scalable SEO solutions for large businesses.
- White Label SEO Software. Customizable SEO platform for agencies and resellers.
- Content Optimization. AI-powered tool to enhance content for better rankings and engagement.
- GBP Management Software. Optimizes and manages Google Business Profiles.
- Site Auditor. Audit web pages for issues impacting SEO rankings.
- Site Visualization. Visualize internal linking profile and site hierarchy.
- Site Structure Analysis. Understand and visualize your web page hierarchy.
- Page Pruning. Identify low-performing content and improve SEO.
- Live Alert Monitoring. Get alerts for critical technical SEO issues.
- Issues Alerts. Receive notifications for issues affecting SEO performance.
- Schema Creator. Generate JSON-LD markup to improve SERP appearances.
What Is Search Atlas Pricing?
Search Atlas scales to fit your needs. All plans start with free OTTO SEO activations. Pay $99 per additional site (the cost drops to $39 per site) as you grow, which making it more affordable as your business expands.
| Starter plan | Growth plan | Pro plan | |
|---|---|---|---|
| Price: | $99 monthly | $199 monthly | $399 monthly |
| Free OTTO SEO | 1 | 2 | 4 |
| Free OTTO Google Ads | 1 | 1 | 1 |
| User Seats | 2 | 3 | 5 |
| GSC Sites | 5 | 15 | Unlimited |
| GBP Accounts | 3 | 10 | 25 |
| Regular AI Quota | 100 | 250 | Unlimited |
How Does Search Atlas Surpasses Supermetrics and Whatagraph in Innovation?
While Supermetrics and Whatagraph are recognized for their reporting tools, they fall short of meeting agencies’ true needs (advanced automation, scalability, and cost-effective pricing).
Their platforms, though effective, require considerable manual work, limiting automation and making scalability difficult.
Search Atlas takes a more advanced approach (offering AI-powered automation, comprehensive tools) for agencies.
It provides an all-in-one platform designed for scale and cost-effectiveness, which includes automated SEO and Google Ads agents (with free activations).
Experience everything for free with no commitment. Get your FREE trial today!