The introduction of /llms.txt has created a new proposed protocol for communicating website content to large language models (LLMs). Publishers and SEO professionals increasingly discuss /llms.txt as a potential signal for AI visibility, yet evidence connecting adoption to citation outcomes across leading LLMs remains limited.
This study analyzes HTTP-crawled /llms.txt adoption across 13,911 domains and compares those findings against 83,387 LLM visibility records spanning six major AI platforms (Copilot, Gemini, Google AI Mode, Grok, OpenAI, and Perplexity).
The analysis examines the relationship between /llms.txt implementation and LLM visibility through binary adoption patterns, quality-based classifications, and domain-authority controls designed to isolate potential causal effects.
The findings show that /llms.txt adoption does not predict LLM citation behavior. What initially appeared to be a quality-dependent dose-response effect is largely explained by underlying domain authority. Higher-authority sites tend to publish better-structured /llms.txt files, while the file itself adds no measurable visibility lift once authority is controlled for.
Methodology – How Was the Impact of /llms.txt on LLM Visibility Measured?
This experiment measures whether publishing /llms.txt is associated with differences in LLM visibility. The analysis evaluates file presence, implementation quality, and domain authority to determine whether observed visibility patterns persist after accounting for underlying site strength.
This experiment matters because the SEO community lacks large-scale evidence on whether /llms.txt functions as a meaningful AI visibility signal or acts primarily as a proxy for broader site quality. Understanding the distinction determines whether investing in the file produces measurable returns.
The dataset integrates 2 primary components listed below.
- LLM Visibility Dataset. 83,387 records from the llmv_responsebrandanalysis table in the Search Atlas LLM Visibility production database. For each domain on each platform, observations were aggregated using mean visibility score (0 to 100), share of voice, mentions, and rank.
- /llms.txt Crawl Dataset. HTTP GET requests against https://{domain}/llms.txt with a 10-second timeout and redirect following across 18,621 active domains collected within a 180-day window. Domains were labeled Has /llms.txt, No /llms.txt, or Ambiguous.
The analytical steps are listed below.
- Detect and classify /llms.txt presence across the domain cohort.
- Merge /llms.txt classifications with LLM visibility records.
- Compare visibility metrics between domains with and without /llms.txt.
- Stratify detected files into five quality buckets and evaluate quality-dependent patterns.
- Control for domain authority using Ahrefs Domain Rating (DR) comparisons.
- Evaluate statistical significance and practical relevance using p-values and r.
The dataset scope is defined below.
- Active domains crawled. 18,621.
- Final matched domain cohort. 13,911.
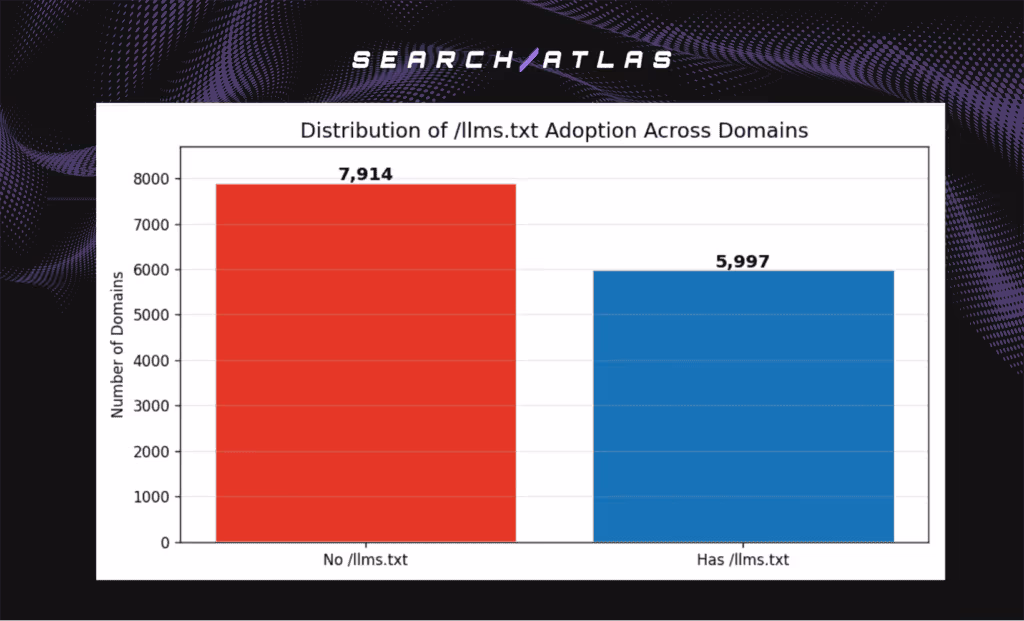
- Domains with /llms.txt. 5,997 (32.2%).
- Domains returning clean 404 responses. 7,914.
- Ambiguous responses excluded. 4,710.
- Final merged dataset. 83,387 rows across six platforms.
- Platforms. Copilot, Gemini, Google AI Mode, Grok, OpenAI, and Perplexity.
- The target variables are listed below.
The target variables are listed below.
- Visibility Score (0 to 100). Mean LLM visibility score per domain per platform.
- Mentions. Average number of times a domain is referenced per LLM response.
- Share of Voice (%). Domain share of total citations within LLM responses.
This framework enables comparisons across adoption status, implementation quality, and domain authority. The design tests whether visibility differences reflect the presence of /llms.txt itself or the broader characteristics of the sites that publish it.
What Is the Final Takeaway?
The analysis shows that publishing /llms.txt does not produce measurable gains in LLM visibility. The three-phase framework converges on the same conclusion. Binary adoption shows no meaningful visibility advantage, and the apparent quality-dependent effect observed in Phase 2 largely disappears after controlling for domain authority in Phase 3.
Phase 1 shows that the median visibility difference between domains with /llms.txt and those without is 0.42 points on a 0 to 100 scale across all platforms (r ≈ −0.02). The two distributions overlap almost completely. The direction of the small observed difference flips between the 90-day and 180-day cohorts, which indicates sampling noise rather than a stable visibility effect.
Phase 2 introduces file quality and reveals an apparent dose-response pattern. Higher quality files achieve stronger visibility, mentions, and share of voice metrics than lower quality files. Premium quality files show the largest separation observed in the study (r = −0.132 for mentions), which initially suggests that implementation quality may influence visibility outcomes.
Phase 3 controls for domain authority and substantially changes the picture. Premium publishers have higher Ahrefs Domain Rating than control domains, and the apparent visibility advantage largely disappears when Premium and Control groups are compared within matched DR ranges. The observed dose response pattern reflects underlying site authority more than the presence or quality of the file itself.
The findings support a consistent conclusion. LLM visibility is driven primarily by content, authority, and retrieval side decisions. The data does not support a causal claim that publishing /llms.txt increases visibility across major LLM platforms.
How Does /llms.txt Adoption Distribute Across Domains?
I, Manick Bhan, together with the Search Atlas research team, analyzed 18,621 active domains to measure the adoption rate of /llms.txt across the study cohort. The breakdown that shows how frequently websites publish /llms.txt and how adoption is distributed across the dataset is described below.
Adoption Analysis
The adoption analysis measures how frequently /llms.txt appears across the study cohort. Adoption matters because any visibility effect depends on meaningful implementation across websites, and adoption patterns provide context for interpreting the visibility results.
The headline results are shown below.
- Domains publishing /llms.txt. 5,997 (32.2%).
- Domains returning clean 404 responses. 7,914.
- Ambiguous responses excluded. 4,710.
The observed adoption rate of 32.2% exceeds the approximately 10% reported in broader public studies.
Plugin Origin Analysis
The origin analysis examines whether detected files were manually created or generated through SEO software. Understanding file origin helps distinguish intentional adoption from plugin-driven deployment.
The headline results are shown below.
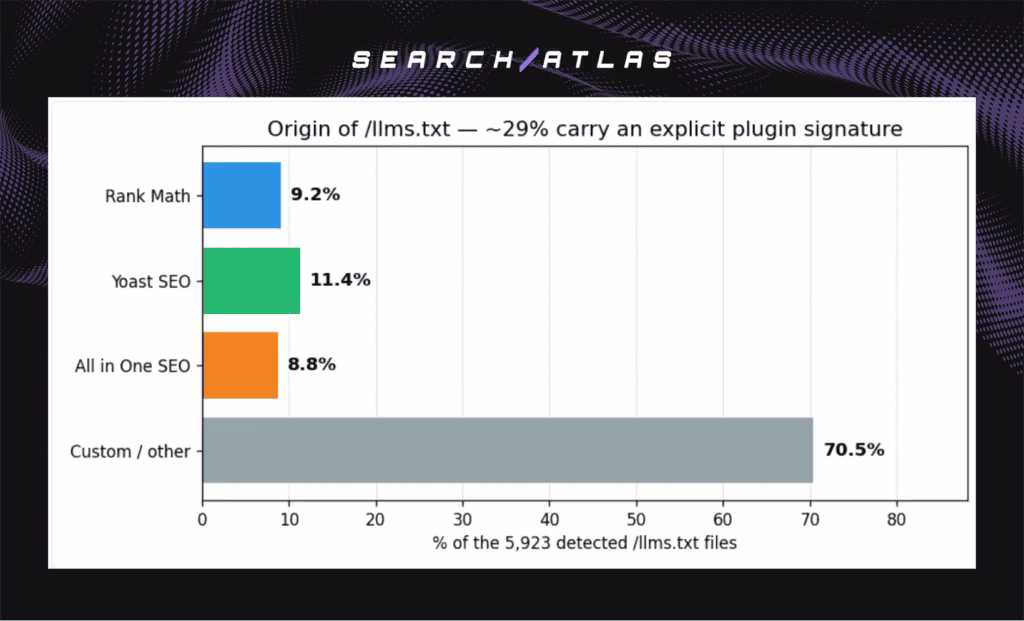
- Files with identifiable plugin signatures. Approximately 30%.
- Files without identifiable plugin signatures. Approximately 70%.
Around 30% of detected files contain signatures associated with Rank Math, Yoast, and All in One SEO. The remaining files appear manually created or have had plugin identifiers removed.
Phase 1: What Does Binary /llms.txt Presence Show?
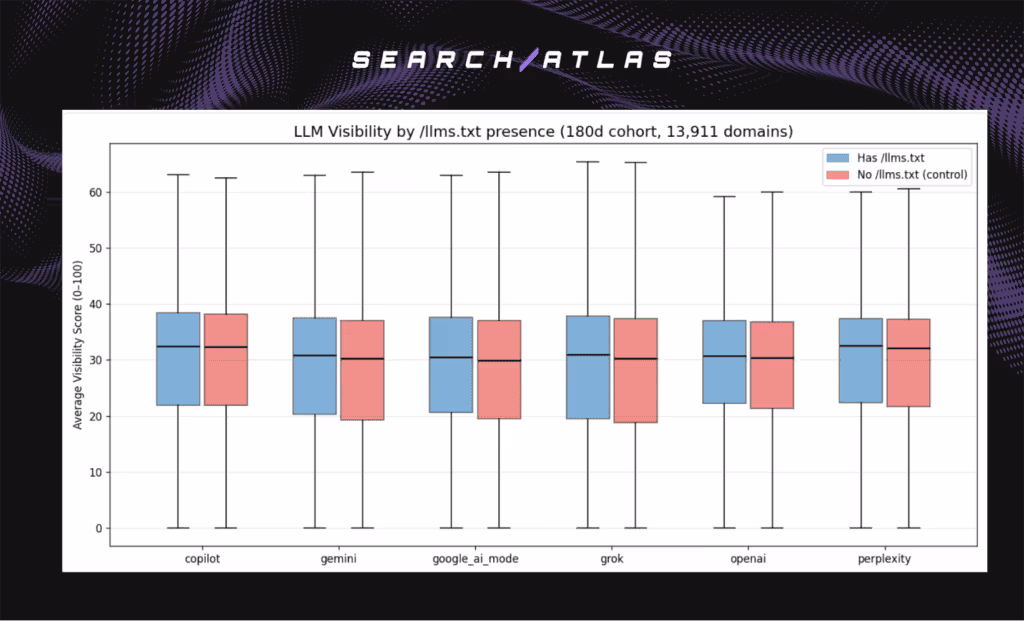
Phase 1 evaluates the simplest possible comparison by measuring whether domains that publish /llms.txt achieve higher visibility than domains that do not. The breakdown that compares the Has and No groups across six LLM platforms is described below.
Has vs No Comparison
The binary comparison treats the adoption of/llms.txt as a yes-or-no variable. This comparison matters because the primary claim behind the adoption of/llms.txt is that the presence of the file increases the likelihood of appearing in LLM-generated responses.
The headline results are shown below.
The key findings from the binary analysis are listed below.
| Platform | n (Has) | n (No) | Median (Has) | Median (No) | Δ Median | p | r |
| Copilot | 5,985 | 7,900 | 32.52 | 32.33 | +0.19 | 0.48 | −0.007 |
| Gemini | 5,994 | 7,912 | 30.80 | 30.24 | +0.56 | 0.0035 | −0.029 |
| Google AI Mode | 5,994 | 7,912 | 30.52 | 29.92 | +0.60 | 0.0007 | −0.034 |
| Grok | 5,987 | 7,898 | 30.95 | 30.27 | +0.68 | 0.0047 | −0.028 |
| OpenAI | 5,997 | 7,912 | 30.75 | 30.38 | +0.37 | 0.013 | −0.025 |
| Perplexity | 5,992 | 7,904 | 32.53 | 32.17 | +0.35 | 0.064 | −0.018 |
| All Platforms | 35,949 | 47,438 | 31.33 | 30.91 | +0.42 | 7.3e-09 | −0.023 |
- Median difference across all platforms. +0.42 points on a 0 to 100 scale.
- Effect magnitude. r ≈ −0.02 across all platforms.
- Visual separation. Distributions overlap almost completely across every platform.
- High and low performers. Domains with very high and very low visibility scores appear in both groups in similar proportions.
- Overall pattern. No measurable visibility advantage associated with publishing /llms.txt.
Domains with /llms.txt show slightly higher median visibility scores across most platforms. However, the observed differences remain extremely small relative to the underlying visibility distribution. The median gap across all platforms is only 0.42 points, while effect sizes remain near zero throughout the dataset.
Low p-values appear across several platforms, but the large sample size explains most of this statistical significance. At r ≈ −0.02, the two groups overlap almost completely. Domains with /llms.txt do not separate meaningfully from domains without the file, and file presence does not distinguish strong performers from weak performers.
Robustness Check
The robustness analysis tests whether the Phase 1 result remains consistent across different cohort definitions. To evaluate sensitivity, the binary comparison was replicated using a smaller 90-day cohort containing 4,180 domains.
The headline results are shown below.
| Platform | Δ Median (90-day) | Δ Median (180-day) | Sign changed? |
|---|---|---|---|
| Copilot | −0.43 | +0.19 | Yes |
| Gemini | −0.40 | +0.56 | Yes |
| Google AI Mode | −0.38 | +0.60 | Yes |
| Grok | −0.29 | +0.68 | Yes |
| OpenAI | +0.44 | +0.37 | No |
| Perplexity | −0.27 | +0.35 | Yes |
| All Platforms | −0.37 | +0.42 | Yes |
- Copilot, Gemini, Google AI Mode, Grok, and Perplexity. The direction of the observed difference reverses between cohorts.
- OpenAI. Direction remains positive across both cohorts.
- Overall pattern. No stable visibility advantage associated with /llms.txt adoption.
The sign of the observed median difference changes across five of six platforms when the analysis moves from the 90-day cohort to the 180-day cohort. The aggregated result across all platforms changes from −0.37 to +0.42 visibility points.
This instability suggests that the small differences detected in Phase 1 reflect sampling variation rather than a consistent visibility signal. A real visibility signal typically maintains directional consistency across cohort definitions, with larger samples improving precision rather than reversing the observed effect.
However, the binary comparison treats all /llms.txt files as equivalent. Phase 2 introduces file quality to determine whether implementation quality changes the relationship.
Phase 2: Does /llms.txt Quality Change the Results?
Phase 2 evaluates whether implementation quality changes the relationship between /llms.txt adoption and LLM visibility. The quality analysis measures whether higher quality /llms.txt implementations correspond to stronger visibility outcomes.
The 5,997 detected files ranged from minimal plugin-generated stubs to richly structured and manually curated documents. To capture this variation, each file received a quality score from 0 to 10 based on eight structural and content criteria.
The breakdown that shows how visibility changes across different quality tiers is described below.
Quality Stratified Analysis
The scoring framework evaluates content structure, formatting, completeness, and implementation characteristics. The criteria are listed below.
| Criterion | Points | How measured |
|---|---|---|
| The H1 heading is present at the top | +1 | Regex on first lines |
| Blockquote summary after H1 | +1 | Regex on top 500 chars |
| ≥ 3 H2 sections | +1 | Markdown header count |
| ≥ 3 markdown lists | +1 | Bullet pattern count |
| Healthy link density (3–25 links/KB) | +2 | Link count/file size |
| Reasonable size (1–50 KB) | +1 | File size |
| Has /llms-full.txt companion | +2 | Separate HTTP check |
| Custom (not plugin-default signature) | +1 | Pattern matching |
| Total | 10 |
Of the 5,997 originally detected files, 73 returned non-200 responses during content revalidation and could not be quality scored. These files were excluded from the quality analysis, resulting in a final scored cohort of 5,924 files.
Bucket Distribution
The quality scoring process produced five implementation tiers ranging from Minimal to Premium, alongside the No /llms.txt control group. The distribution of domains across these buckets is shown below.
| Bucket | Score range | Domains | % of scored cohort |
| 0. No /llms.txt (control) | — | 7,914 | 57.2% |
| 1. Minimal | 0–2 | 193 | 1.4% |
| 2. Low | 3–4 | 473 | 3.4% |
| 3. Medium | 5–6 | 2,409 | 17.4% |
| 4. High | 7 | 989 | 7.1% |
| 5. Premium | 8–10 | 1,860 | 13.4% |
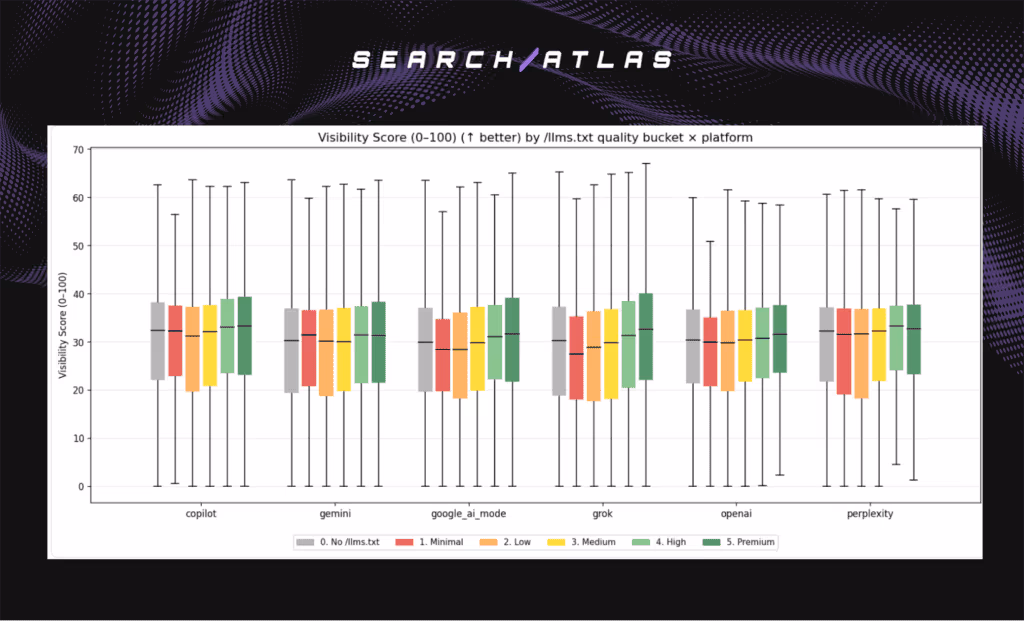
Box Plot — Visibility Score by Quality Bucket × Platform
Visibility score (0 to 100) per platform, broken down by quality bucket. The color gradient progresses from gray (control group) through red and orange (lower quality files) to green (higher quality files).
Median Comparison vs Control
The comparison below measures how each quality bucket differs from the No /llms.txt control group.
Visibility Score (↑ better)
| Bucket | n (rows) | Δ Median vs Control | p | r |
|---|---|---|---|---|
| 1. Minimal | 1,158 | −0.88 | 0.020 | +0.040 |
| 2. Low | 2,838 | −0.86 | 1.6e-05 | +0.048 |
| 3. Medium | 14,441 | −0.18 | 0.21 | +0.007 |
| 4. High | 5,928 | +1.02 | 1.1e-11 | −0.054 |
| 5. Premium | 11,146 | +1.27 | 9.6e-31 | −0.070 |
Mentions (avg per response, ↑ better)
| Bucket | n | Δ Median vs Control | p | r |
|---|---|---|---|---|
| 1. Minimal | 1,158 | −0.15 | 1.0e-04 | +0.067 |
| 2. Low | 2,838 | −0.10 | 6.6e-04 | +0.038 |
| 3. Medium | 14,441 | −0.05 | 0.03 | +0.012 |
| 4. High | 5,928 | +0.31 | 4.1e-40 | −0.105 |
| 5. Premium | 11,146 | +0.42 | 1.2e-104 | −0.132 |
Share of Voice (%, ↑ better)
| Bucket | n | Δ Median vs Control (pp) | p | r |
|---|---|---|---|---|
| 1. Minimal | 1,158 | −0.85 | 3.4e-03 | +0.050 |
| 2. Low | 2,838 | −1.28 | 6.6e-08 | +0.060 |
| 3. Medium | 14,441 | −0.21 | 0.14 | +0.008 |
| 4. High | 5,928 | +1.09 | 7.0e-15 | −0.062 |
| 5. Premium | 11,146 | +1.08 | 2.2e-24 | −0.062 |
Mentions by Quality Bucket
The box plot below shows mentions per response across quality buckets.
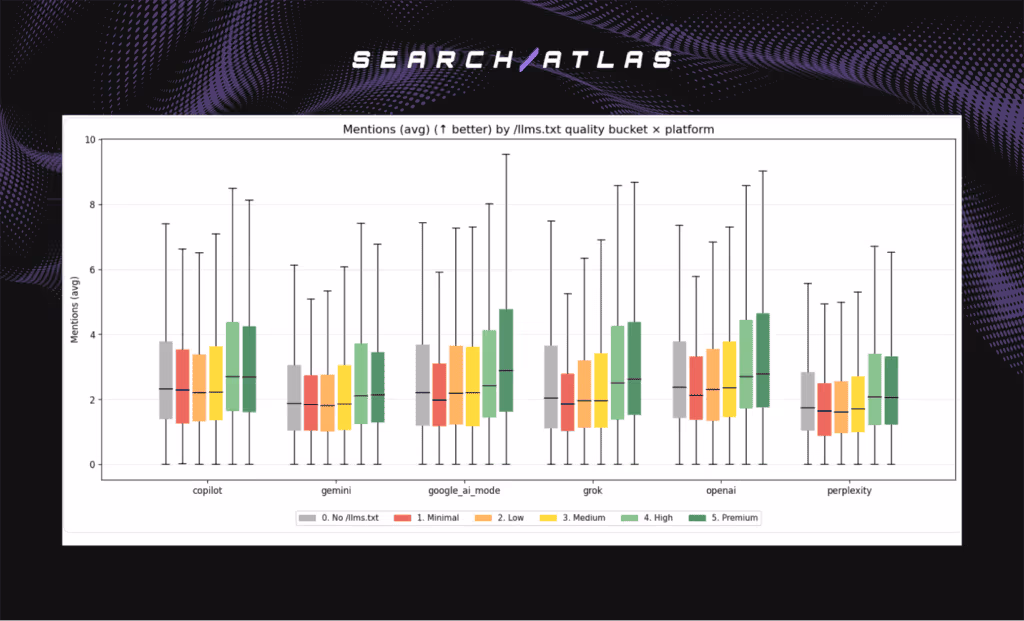
The key findings from the quality analysis are listed below.
- Quality gradient. Minimal and low-quality files underperform the control group across visibility score, mentions, and share of voice. High and Premium-quality files outperform the control group across all three metrics.
- Strongest separation. The Premium bucket reaches r = −0.132 for mentions, the largest effect magnitude observed anywhere in the study, and the only result that exceeds the threshold for non-trivial distributional separation.
- Phase 1 masking effect. The binary comparison combined all 5,997 detected files into a single Has group. Lower-quality and higher-quality implementations offset one another, producing the near-zero overall effect observed in Phase 1 (r ≈ −0.02).
- Quality distribution. Approximately 31% of detected files reach High or Premium tier (score ≥ 7). The remaining 69% fall into Minimal, Low, or Medium quality categories.
The quality-stratified analysis reveals a pattern that was not visible in the binary comparison. Domains with High and Premium quality files consistently show stronger visibility outcomes than the control group, while domains with Minimal and Low quality files consistently show weaker outcomes.
At face value, these results suggest that higher-quality /llms.txt implementations are associated with stronger LLM visibility. However, the relationship remains correlational. Higher-quality files may simply be more common on stronger websites with greater authority, content depth, and technical maturity. Phase 3 tests this directly by controlling for domain authority.
Phase 3: Does Domain Authority Explain the Quality Effect?
Phase 3 evaluates whether the visibility advantage observed in Phase 2 remains after controlling for domain authority. The quality analysis suggested that higher-quality /llms.txt files correlate with stronger visibility outcomes, but stronger websites often invest more heavily in content, technical SEO, and documentation.
The breakdown that tests whether the quality effect persists after controlling for domain authority is described below.
Domain Authority Analysis
The authority analysis addresses the two questions below.
- Do Premium-quality /llms.txt publishers have higher domain authority than control domains?
- Does the Premium-quality advantage remain when domains with similar authority are compared?
Domain authority was measured using Ahrefs Domain Rating (DR) data. DR data were available for 1,041 domains within the study cohort.
Domain Authority Distribution
The table below compares Domain Rating distributions across quality buckets.
| Bucket | n with DR | DR Median | DR Mean | DR p25 | DR p75 |
|---|---|---|---|---|---|
| 0. No /llms.txt (control) | 597 | 42 | 40.3 | 25 | 53 |
| 1. Minimal | 14 | 39.5 | 38.4 | 33.3 | 42.8 |
| 2. Low | 39 | 39 | 35.7 | 25.5 | 46 |
| 3. Medium | 123 | 40 | 36.2 | 22.5 | 48 |
| 4. High | 99 | 41 | 39.7 | 27.5 | 51.5 |
| 5. Premium | 154 | 45 | 43.0 | 35.3 | 51 |
The chart below visualizes the same relationship.
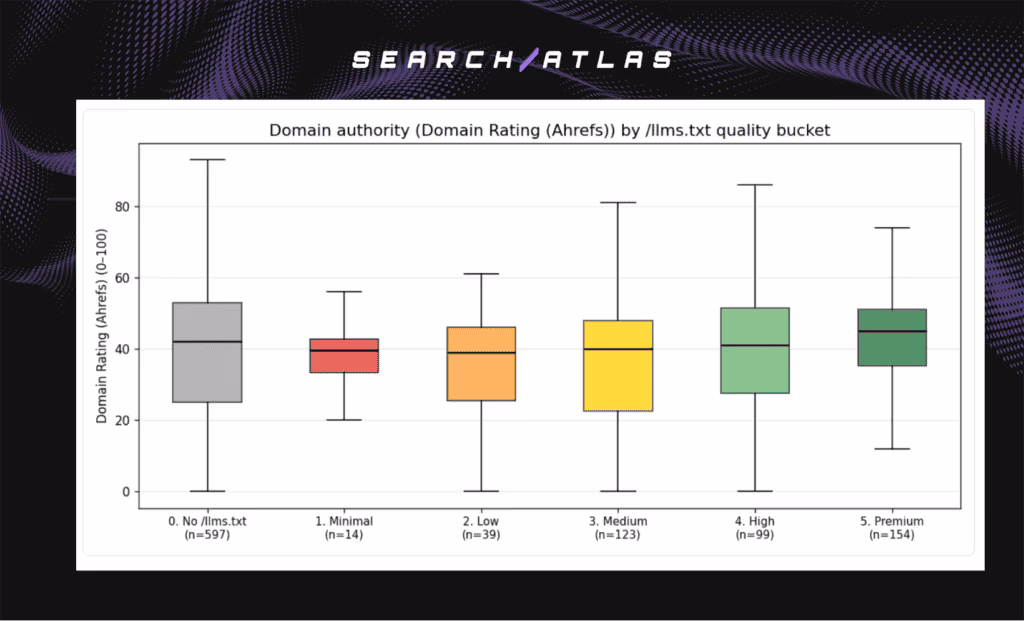
The headline findings are listed below.
- Premium publishers. Median DR 45.
- Control group. Median DR 42.
- Minimal and low-quality publishers. Median DR 39 to 40.
- Overall pattern. Higher-quality /llms.txt implementations appear more frequently on higher-authority domains.
Premium publishers show moderately higher authority than the control group. The median difference is approximately 3 points of DR, while the mean difference is approximately 2.7 points. This result indicates that higher-quality implementations are not distributed randomly across domains.
Premium vs Control Within Matched Authority Ranges
The next analysis removes authority differences by comparing Premium-quality publishers and control domains within the same DR quartile.
Visibility Score: Premium vs Control Within DR Quartiles
| DR Bucket | n Premium (rows) | n Control | Δ Median | p | r |
|---|---|---|---|---|---|
| DR Q1 (low) | 168 | 960 | +1.47 | 0.27 | −0.053 |
| DR Q2 | 216 | 888 | −1.51 | 0.52 | +0.028 |
| DR Q3 | 312 | 768 | +1.26 | 0.38 | −0.034 |
| DR Q4 (high) | 228 | 966 | −0.91 | 0.08 | +0.075 |
Mentions: Premium vs Control Within DR Quartiles
| DR Bucket | n Premium | n Control | Δ Median | p | r |
|---|---|---|---|---|---|
| DR Q1 (low) | 168 | 960 | +0.30 | 0.24 | −0.057 |
| DR Q2 | 216 | 888 | −0.09 | 0.40 | +0.037 |
| DR Q3 | 312 | 768 | +0.36 | 0.049 | −0.076 |
| DR Q4 (high) | 228 | 966 | +0.08 | 0.83 | −0.009 |
The chart below visualizes the visibility score comparison after authority matching.
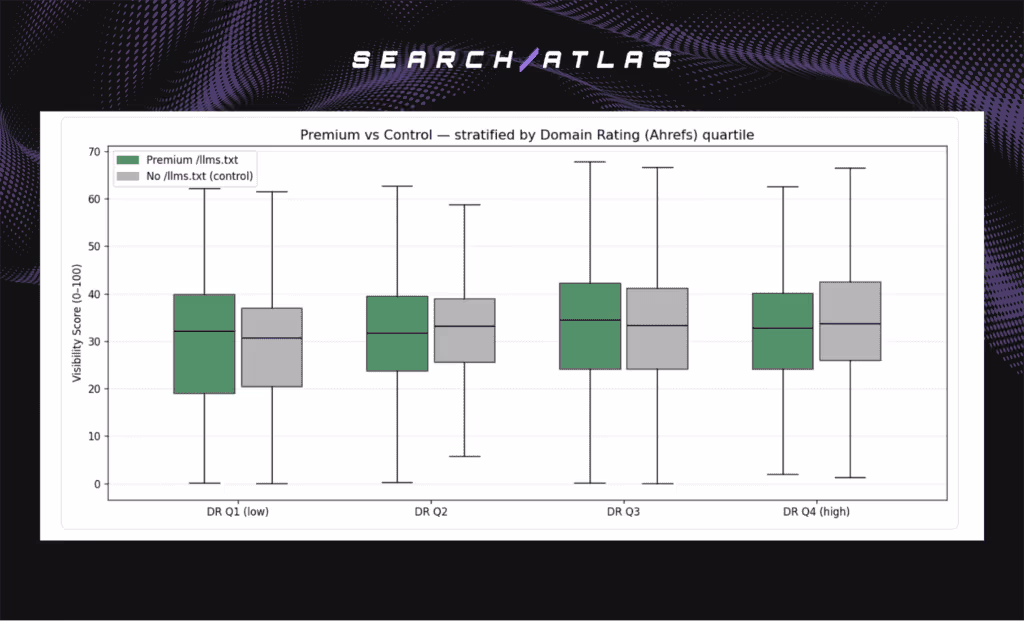
The headline findings are listed below.
- Visibility score. None of the four DR quartiles shows a statistically significant Premium versus Control difference.
- Mentions. Only DR Q3 reaches statistical significance (p = 0.049), but the effect size remains small (r = −0.076).
- Direction consistency. The observed effect changes direction across quartiles rather than remaining consistently positive.
- Overall pattern. The visibility advantage observed in Phase 2 largely disappears after authority matching.
The visibility score results provide the clearest example. Premium domains outperform controls in DR Q1 and DR Q3 but underperform controls in DR Q2 and DR Q4. The direction of the relationship changes across quartiles instead of remaining stable.
The mentions metric follows a similar pattern. Premium domains show higher median mentions in some authority ranges and lower median mentions in others. Only one quartile reaches statistical significance, and the effect remains small enough that the two distributions still overlap substantially.
These findings differ from Phase 2, where a clear quality gradient appeared across visibility score, mentions, and share of voice. Once domains are compared within the same authority range, that gradient largely disappears.
What Should Website Owners and SEOs Do With These Findings?
The results show that publishing a /llms.txt file alone does not create a measurable visibility advantage across major LLM platforms. File presence, by itself, fails to separate high-performing domains from low-performing domains. Visibility outcomes appear to depend more on overall site quality and authority than on the existence of the file itself.
1. Treat /llms.txt as Documentation, Not a Ranking Lever. The study finds no meaningful visibility difference between domains that publish /llms.txt and domains that do not. Implementation decisions should focus on documentation and content organization rather than expectations of direct visibility gains.
2. Prioritize Site Quality Before File Quality. Higher-quality /llms.txt implementations correlate with stronger visibility metrics, but much of that relationship disappears after controlling for domain authority. Strong websites tend to publish better files. Better files do not necessarily create stronger visibility.
3. Invest in Content, Authority, and Technical SEO First. The strongest visibility signals remain the fundamentals that influence overall site quality. Content depth, topical coverage, technical health, and authority show a stronger relationship with visibility than /llms.txt adoption alone.
4. Use /llms.txt as a Supplemental Asset. A well-structured file provides an additional way to organize content for AI systems. The file functions best as a complementary layer within a broader content and authority strategy rather than as a standalone optimization tactic.
5. Measure LLM visibility at the domain level, not the file level. Visibility score, mentions, and share of voice reflect how often a domain appears in LLM responses across intent categories and platforms. Tracking these signals through the Search Atlas LLM Visibility feature reveals actual citation patterns rather than proxy indicators.
What Are the Study’s Limitations?
Every empirical analysis carries limitations. The limitations of this study are listed below.
- Sampling Bias. The study relies on a defined cohort of analyzed domains rather than a random sample of all websites. Findings, therefore, reflect the characteristics of the study cohort and not necessarily the broader web.
- Limited Domain Authority Coverage. The Domain Rating (DR) analysis in Phase 3 relies on 1,041 domains (7.5% of the cohort). The sample is sufficient to challenge the Phase 2 finding but not to make strong claims about narrower segments.
- Cross-Sectional Design. The study measures relationships at a single point in time. Without verified adoption dates, the analysis cannot observe visibility changes before and after /llms.txt implementation, which would be required to establish causality.
- Unobserved Factors. Domains differ in content quality, technical SEO, backlink profiles, and publishing practices. While Phase 3 controls for domain authority, other factors may contribute to observed visibility differences.
Despite these constraints, the analysis provides one of the largest empirical evaluations of /llms.txt adoption and LLM visibility currently available. The findings remain consistent across all three phases and indicate that /llms.txt adoption does not independently increase citation visibility.
Future studies need to incorporate verified implementation dates and longitudinal measurements to evaluate whether visibility changes over time following /llms.txt adoption.