

Whatagraph alternatives are reporting and analytics platforms that replace or exceed Whatagraph in data visualization, cross-channel integration, and automated reporting. Alternatives to Whatagraph range from full SEO suites to lightweight dashboard tools that fill gaps in the feature set.
Whatagraph is a marketing data platform that provides cross-channel reporting, automated dashboards, and data transfers through visual builders and integrations. It centralizes campaign monitoring across platforms like Google Ads, Facebook Ads, and LinkedIn Ads. However, Whatagraph reviews highlight limited customization, steep pricing, complex credit structures, and a learning curve, which lead many teams to seek alternatives.
Whatagraph pricing starts with a Free plan offering 5 credits as of September 2025. The Start plan costs $286/month ($229/month billed annually) with 20 credits and essential integrations, the Boost plan costs $724/month ($579/month billed annually) with 60 credits and white-labeling, and the Max plan is custom-priced with 100+ credits, premium integrations, and SSO (Single Sign-On).
The best Whatagraph alternatives in 2025 are Search Atlas, Looker Studio, and Coupler.io, which stand out for stronger data integration, flexible dashboards, and more transparent pricing.
What are the Best Whatagraph Alternatives?
The 34 best Whatagraph alternatives are listed below.
| # | Whatagraph Alternative | Best For | Price |
| 1 | Search Atlas | Complete SEO automation | $99/month |
| 2 | Looker Studio | Google Ecosystem integration | Free, with paid upgrades for enterprise |
| 3 | Coupler.io | No-code data transfers | $32/month |
| 4 | ReportGarden | Agency client management | $75/month |
| 5 | Salesforce Marketing Cloud Intelligence | Enterprise marketing data | $3,000/month |
| 6 | NinjaCat | Consolidated agency reporting | Custom pricing |
| 7 | Adverity | Robust enterprise ETL | Custom pricing |
| 8 | TapClicks | High-volume agency data management | Modular pricing |
| 9 | Swydo | Automated PDF media reports | $49/month |
| 10 | Cyfe | Simple KPI dashboards | $29/month |
| 11 | Supermetrics | Data pipeline integration | Modular pricing |
| 12 | Funnel.io | Advanced data workflows | Custom pricing |
| 13 | Databox | Mobile-first KPI snapshots | $47/month |
| 14 | DashThis | Simple automated agency reports | $49/month |
| 15 | Klipfolio | Customizable data visualizations | $140/month |
| 16 | Improvado | AI-powered marketing analytics | Custom pricing |
| 17 | Fivetran | Automated data replication | Custom pricing |
| 18 | Geckoboard | TV dashboard displays | $75/month |
| 19 | HubSpot Marketing Hub | Integrated marketing automation | €9/month per seat |
| 20 | Semrush | Comprehensive competitive analysis | $139.95/month |
| 21 | Google Analytics | In-depth website insights | Free |
| 22 | Microsoft Power BI | Cost-effective interactive analysis | Free |
| 23 | Tableau | Advanced data visualization | $75/user/month |
| 24 | Reportei | Visual client reports (Brazil) | $29/month |
| 25 | Dataslayer | Automated sheet reporting | Modular pricing |
| 26 | Windsor.ai | Affordable marketing ETL | $23/month |
| 27 | Grow.com | Business intelligence | Custom pricing |
| 28 | Better Reports | Shopify analytics | $19.90/month |
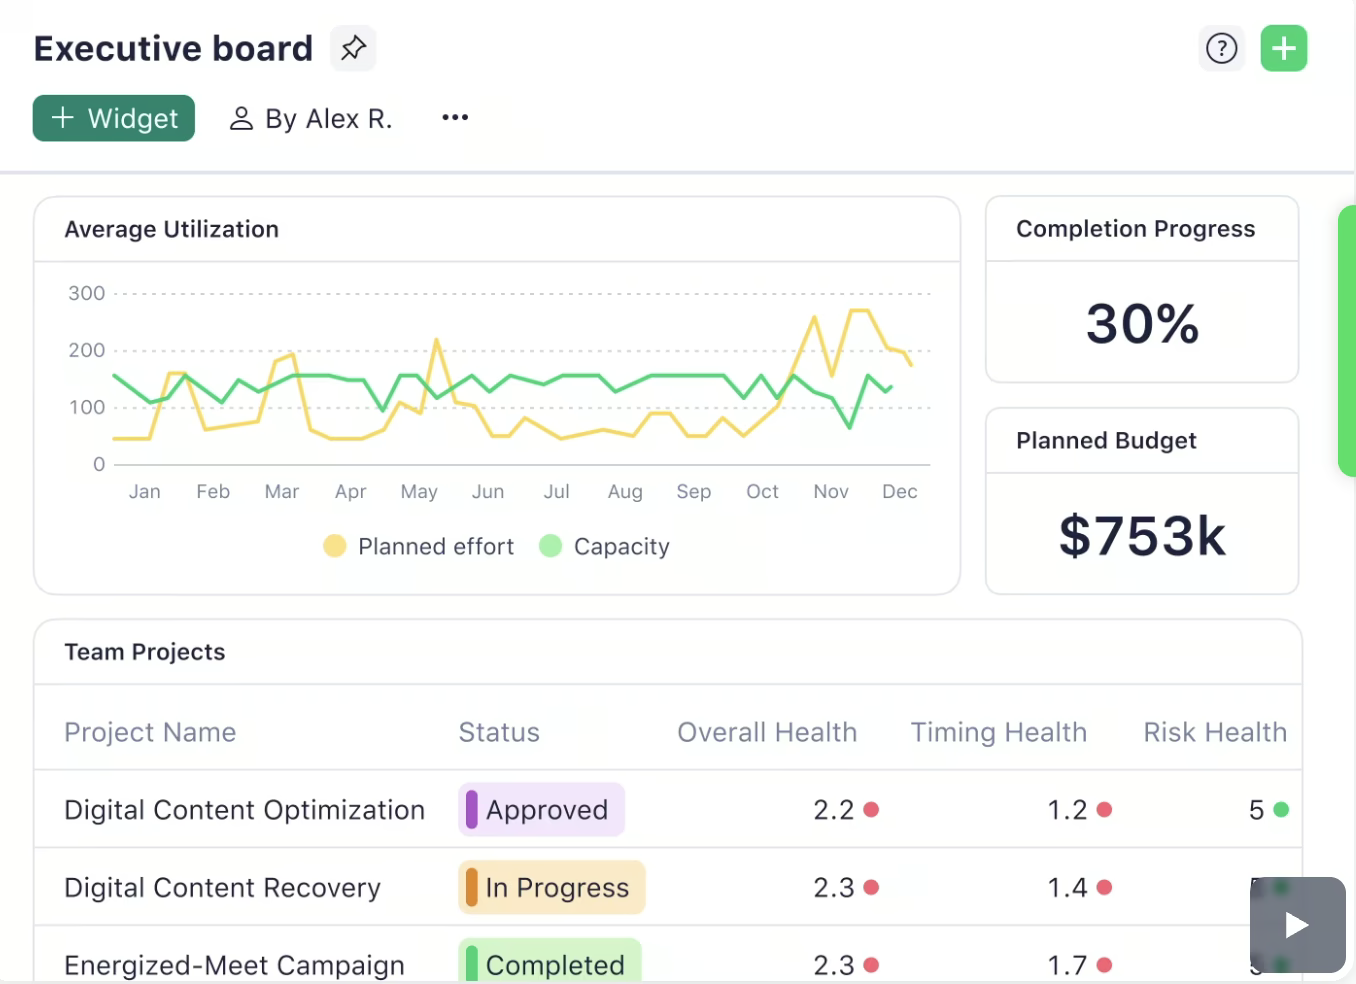
| 29 | Wrike | Dynamic timelines | $10/user/month |
| 30 | Smartsheet | Work management | $12/user/month |
| 31 | Jira | Tracking tasks | $7.53/user/month |
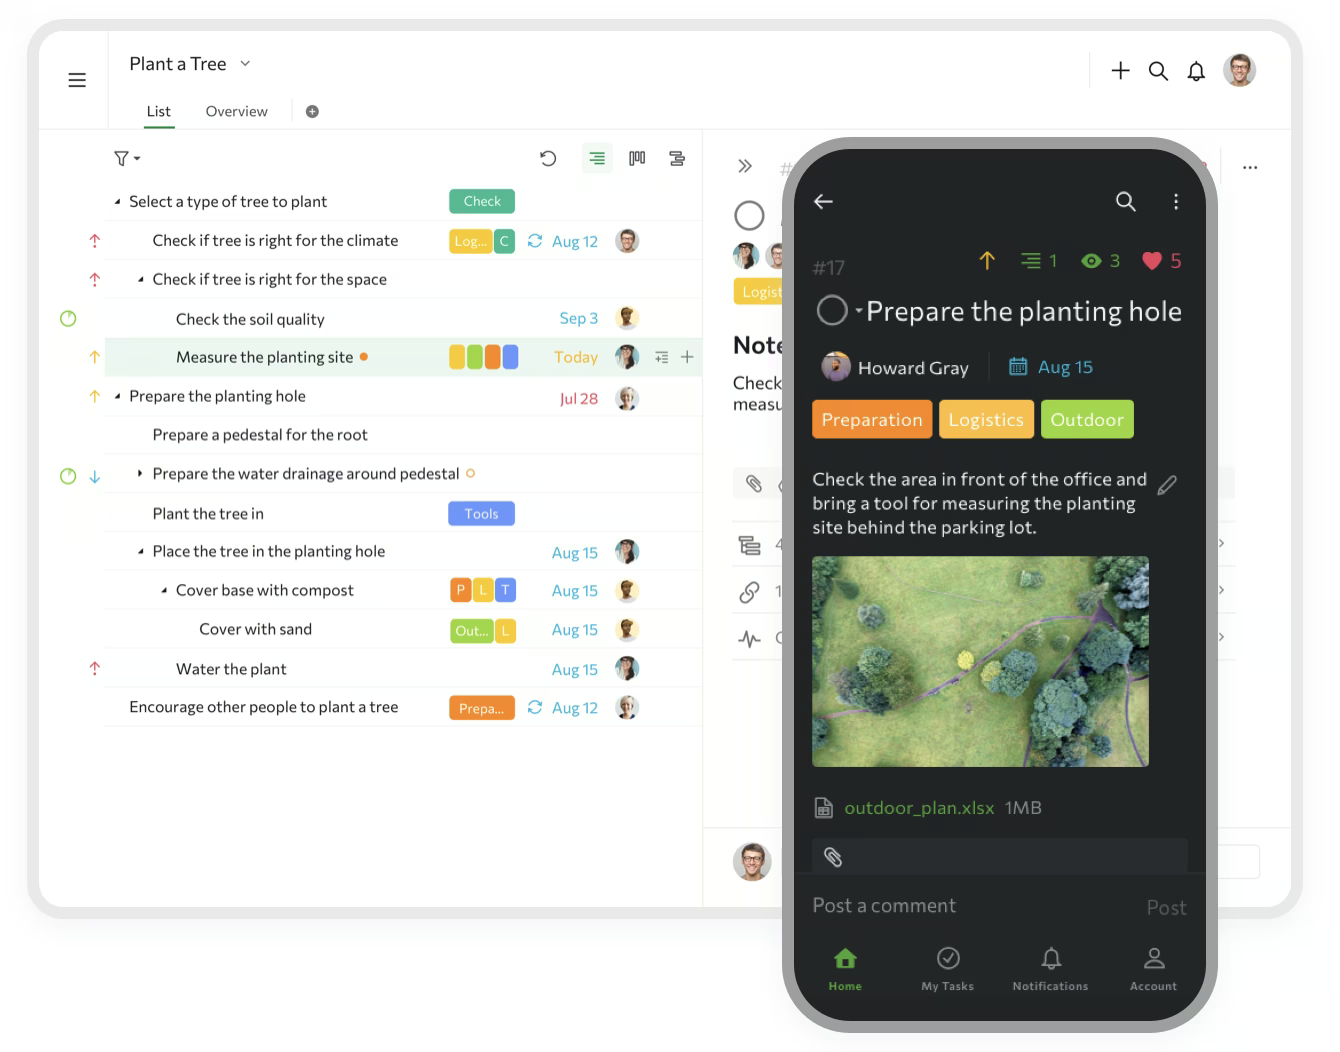
| 32 | Quire | Team collaboration | $10.95/user/month |
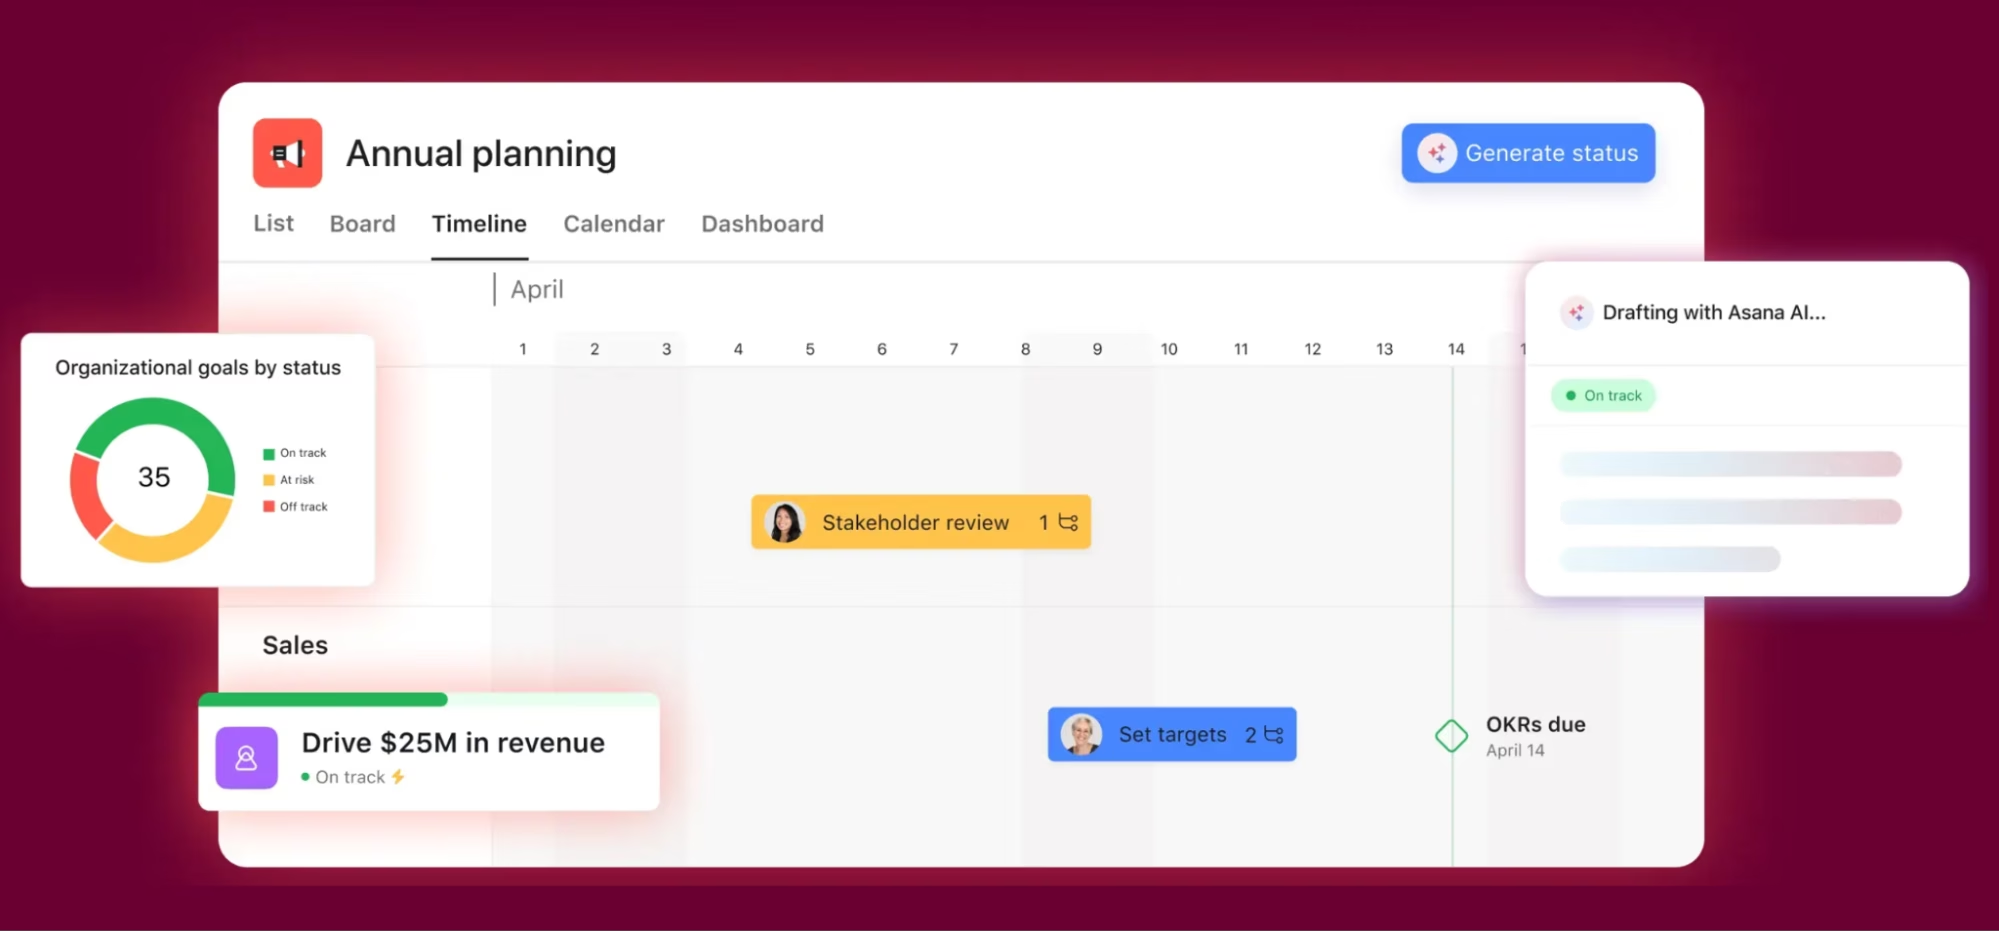
| 33 | Asana | Organizing tasks | $10.99/user/month |
| 34 | IBM SPSS Statistics | Advanced statistical analysis | Custom pricing |
1. Search Atlas: Best Whatagraph Alternative
Search Atlas SEO platform is the best Whatagraph alternative in 2025. Search Atlas ranks as the number 1 alternative to Whatagraph for agencies, marketers, and enterprises that need real-time SEO dashboards, automated reporting, technical optimization, and client-ready exports without credit restrictions or fragmented tools.
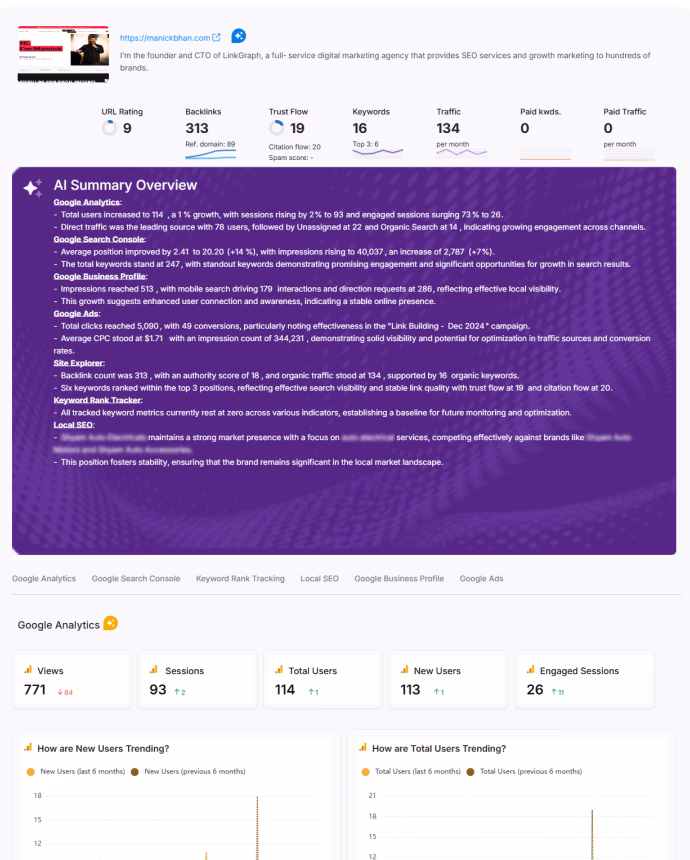
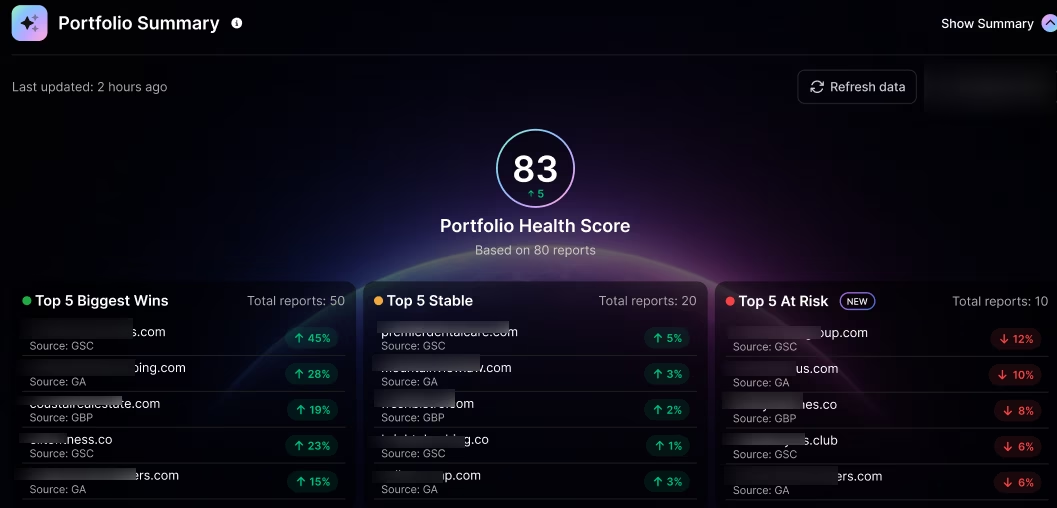
Search Atlas Report Builder integrates live data from Google Analytics 4 (GA4), Google Search Console (GSC), Google Business Profile (GBP), and Keyword Rank Tracking to provide a transparent health score that agencies use to prioritize actions. Search Atlas Report Builder now includes the reimagined Portfolio Summary, which categorizes accounts into wins, stable, and at-risk segments.
Search Atlas delivers executive keyword growth reports, rank volatility monitoring, device-specific performance analysis, and ad ROI (return on investment) breakdowns in the same dashboard. Agencies instantly export portfolio data, use client-friendly layouts, and share branded reports without the credit limits that restrict Whatagraph users.
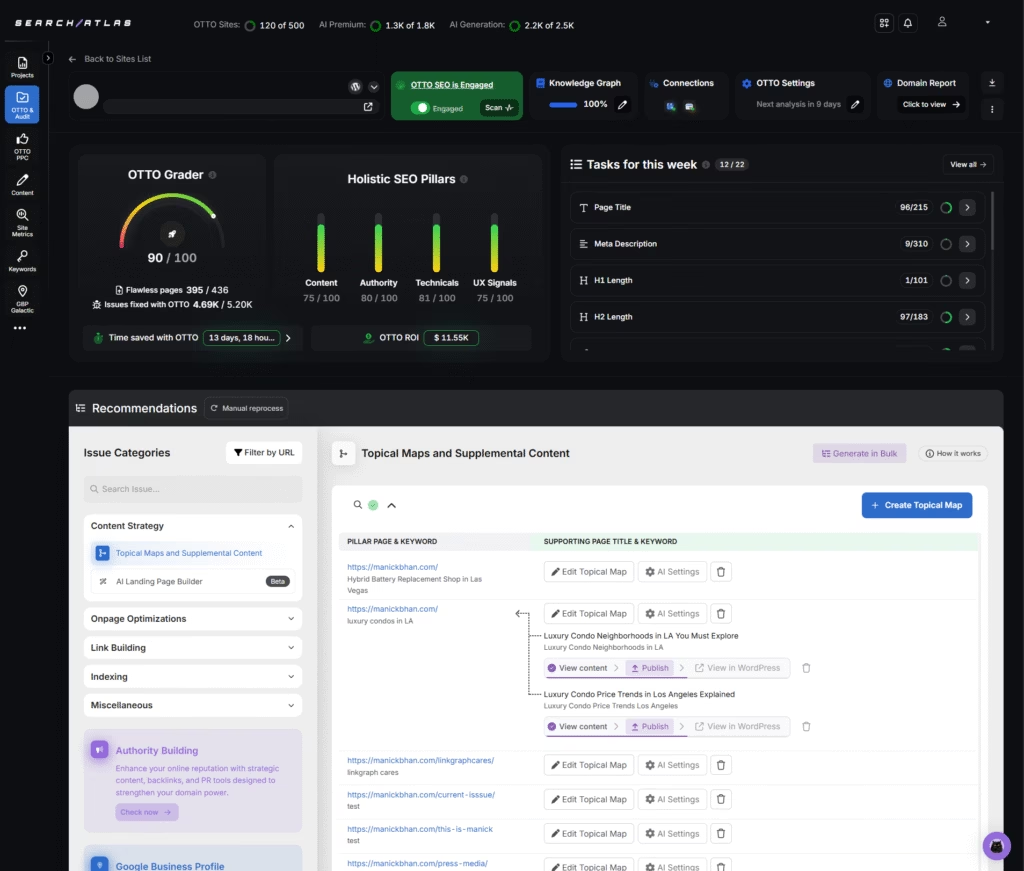
Search Atlas includes OTTO SEO agent automation, which executes schema fixes, Core Web Vitals improvements, and internal linking optimizations that Whatagraph cannot perform. Local SEO dashboards, AI search visibility monitoring, and backlink tracking expand reporting beyond marketing metrics into full SEO performance management.
Search Atlas pricing starts at $99/month, scales to $199 for Growth, and reaches $499 for Pro, with every plan including core features and unlimited dashboards. Users save at least $100 per month compared to Whatagraph subscriptions, plus separate rank tracking and technical tools.
The pros highlighted in the Search Atlas review include unified reporting, automation across technical and on-page SEO, and unlimited exports. The con is a slight learning curve for agencies with complex portfolios, but users consistently value the accuracy and clarity of the Search Atlas reporting stack.
2. Looker Studio: Best Whatagraph Alternative for Google Ecosystem Integration
Looker Studio is the best Whatagraph alternative for Google ecosystem integration. Looker Studio, formerly Google Data Studio, ranks as the top choice for data analysts, enterprises, and teams that need customizable data visualization without paying for credits or licenses.
Looker Studio is a Google-owned business intelligence platform that connects to more than 800 data sources and enables users to build dashboards with drag-and-drop design, report embedding, and advanced customization.
Looker Studio reporting platform excels inside the Google ecosystem by integrating with Google Analytics, Google Ads, Google Sheets, and BigQuery, which gives teams full control of visualization and manipulation.
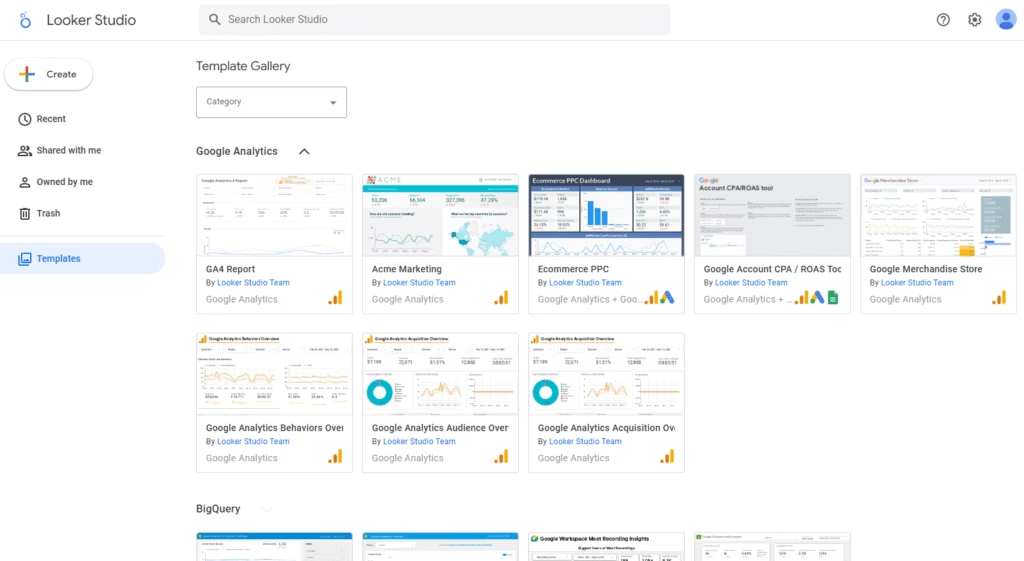
Looker Studio reporting includes a template library with over 200 pre-built dashboards, calculated fields for complex data modeling, and AI-powered anomaly detection. Users assemble custom reporting stacks by connecting Looker Studio with third-party connectors such as Supermetrics or Funnel, which expands coverage beyond Google-native data.
Compared to Whatagraph, which delivers ready-to-use dashboards with direct marketing integrations, Looker Studio offers more flexibility but requires higher technical skill and time investment.
Looker Studio is free to use. Enterprises that require administration, collaboration, and technical support upgrade to Looker Studio Pro, which follows custom pricing based on data query volumes and enterprise scale. The Looker Studio review indicates that the Pro tier is expensive relative to other business intelligence solutions, which makes scaling a major consideration for large organizations.
The advantages of Looker Studio include free access, deep integrations across Google products, and advanced customization. The disadvantages of Looker Studio are a steep learning curve, limited support for beginners, and reliance on third-party connectors for many marketing sources that Whatagraph covers natively.
3. Coupler.io: Best Whatagraph Alternative for No-code Data Transfers
Coupler.io is the best Whatagraph alternative for no-code data transfers. Coupler.io ranks as the leading option for teams that need to automate Extract, Transform, Load (ETL) processes and move data into Google Sheets, Excel, or data warehouses without coding.
Coupler.io is a data automation platform that connects marketing, sales, and business apps with destinations like Google BigQuery and Airtable. Its key trait is its no-code ETL builder, which simplifies data extraction, transformation, and syncing.
In Coupler.io, users centralize marketing data flows for analysis, while Whatagraph users rely on in-app dashboards instead of data pipelines.
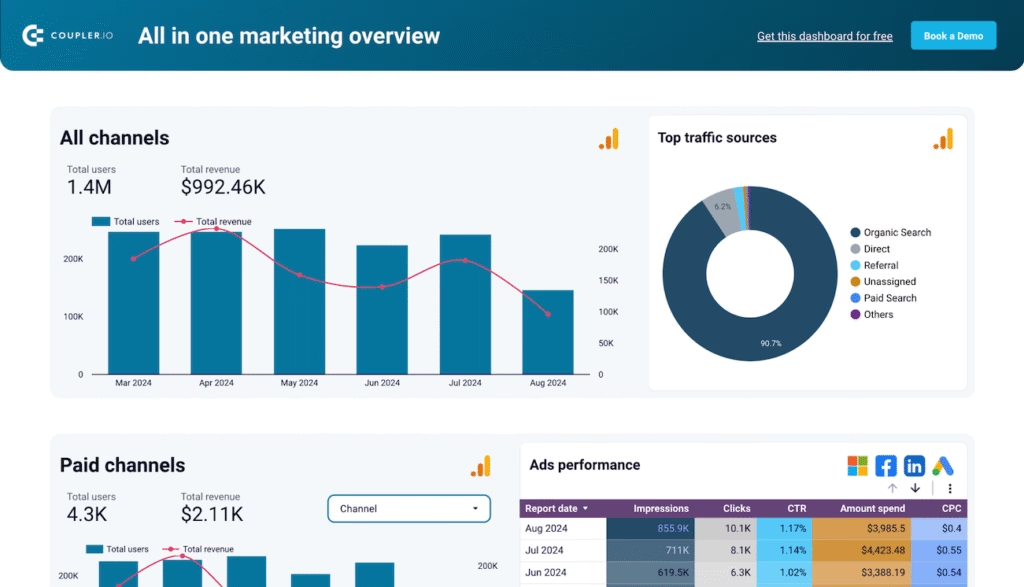
Coupler.io features automated data refresh scheduling, JSON API for custom integrations, and advanced transformation options to blend and restructure raw data.
Marketing teams use Coupler.io to consolidate ad spend from multiple platforms, sync CRM (Customer Relationship Management) data into Google Sheets, and standardize campaign performance metrics. Unlike Whatagraph, which creates client-facing reports, Coupler.io focuses on the backend data infrastructure that fuels BI (Business Intelligence) tools and spreadsheets.
Coupler.io pricing starts with a Free plan limited to one connection and manual refresh. Paid tiers begin with Personal at $32/month (5 connections, daily refresh), Professional at $132 (25 connections, 5 users, AI insights), Team at $259 (100 connections, hourly refresh, account manager), and Business at $599 (400 connections, 15-minute refresh, unlimited users). Enterprise plans are custom, with onboarding and advanced service bundles available.
The Coupler.io Personal plan is $254 cheaper than the $286 Start plan in Whatagraph, while the highest fixed Coupler.io tier at $599 per month is still $125 less than the $724 Whatagraph Boost plan with credit limits.
The pros listed in the Coupler.io review are reliable no-code ETL, wide integration coverage, and granular scheduling of data pipelines. The cons of Coupler.io include limited native visualization features, reliance on external BI tools for reporting, and a steeper setup compared to the out-of-the-box dashboards in Whatagraph.
4. ReportGarden: Best Whatagraph Alternative for Agency Client Management
ReportGarden is the best Whatagraph alternative for agency client management. ReportGarden is a marketing reporting platform that provides multi-channel dashboards, white-label portals, and templated reporting, which matters because agencies need repeatable workflows, fast setup, and client-ready outputs.
ReportGarden offers over 100 integrations, 1,000 templates, native PPC (Pay-Per-Click) reporting, and data blending across multiple channels. Its key trait is the template-driven dashboard system, which allows agencies to create reports quickly without coding. Custom widgets present impressions, clicks, and conversions in layouts designed for client communication.
Compared to Whatagraph, which provides AI summaries through Whatagraph IQ and advanced data organization with blending and custom metrics, ReportGarden prioritizes speed, simplicity, and ease of onboarding.
Whatagraph enables white-labeling only on higher tiers, while ReportGarden includes a full white-labeled portal that hides vendor identity and delivers direct client access.
ReportGarden pricing starts at $75/month, which is $211 cheaper than the Whatagraph Start plan ($286). Users avoid credit restrictions, since ReportGarden plans cover unlimited dashboards under fair usage limits.
The advantages of ReportGarden include affordability, fast onboarding, and a large template library. The disadvantages include limited AI-driven reporting, less advanced data unification, and fewer enterprise features compared to Whatagraph.
Choose ReportGarden as a Whatagraph alternative for basic to intermediate agency reporting that requires speed, templates, and branded portals. The ReportGarden review shows that it fits teams that value lower cost, faster rollout, and client login pages, which improve retention without heavy engineering.
5. Salesforce Marketing Cloud Intelligence: Best Whatagraph Alternative for Enterprise Marketing Data
Salesforce Marketing Cloud Intelligence (MCI) is the best Whatagraph alternative for enterprise marketing data. Salesforce Marketing Cloud Intelligence is an enterprise marketing analytics platform that covers cross-channel data, AI-driven insights, and scalable reporting, which matters because global organizations require governance, integration depth, and advanced automation.
Salesforce Marketing Cloud Intelligence, formerly Datorama, is designed for large enterprises managing millions of data rows across regions, brands, and campaigns.
Salesforce Marketing Cloud Intelligence includes an API connector library with 170+ sources, a universal connector for custom data, and an automated marketing data model. Its key trait is Einstein Marketing Insights, which identifies optimization opportunities, ranks performance drivers, and delivers actionable recommendations on metrics such as CPM, conversions, or creative effectiveness.
Users build branded dashboards with InstaBrand, export to Tableau, and extend functionality with Salesforce AppExchange apps and Slack integrations.
Compared to Whatagraph, which emphasizes ease of use and fast client-ready dashboards for SMBs, Salesforce Marketing Cloud Intelligence prioritizes enterprise-grade scale, harmonization of data warehouses, and predictive analytics.
Whatagraph focuses on speed and usability, while Salesforce provides complex pipelines, deeper modeling, and integrations across the Salesforce CRM and Commerce Cloud.
Salesforce Marketing Cloud Intelligence pricing begins at $3,000/month for Starter with 10 users and 3 million data rows, increases to $10,000/month for Growth with 20 users and 20 million data rows, and scales to custom Plus plans with 80 users and 100 million data rows.
This makes Salesforce over $2,000 more expensive than the Whatagraph pricing (from $286 to $724), but with far greater capacity and enterprise features.
6. NinjaCat: Best Whatagraph Alternative for Consolidated Agency Reporting
NinjaCat is the best Whatagraph alternative for consolidated agency-centric reporting. NinjaCat is suited for agencies that need multi-client management, call tracking integration, and standardized performance reporting.
NinjaCat is a digital marketing reporting platform that consolidates data from advertising, analytics, and call tracking sources into dashboards and client-ready reports. Its defining trait is its agency-focused infrastructure, which facilitates client account scalability and workflow oversight.
NinjaCat features 150+ marketing data connectors, automated data refresh with anomaly alerts, white-label client portals, budget pacing, call tracking integration, and workflow tools such as client notes and benchmarking.
Agencies emphasize operational workflows and custom data management in NinjaCat, while Whatagraph users emphasize speed, stability, and polished visual reports.
User feedback highlights the steeper learning curve and recurring connector reliability issues in Ninjacat compared to the faster loading and more stable managed integrations in Whatagraph.
Agencies with complex reporting needs benefit from the advanced features in Ninjacat, but those prioritizing efficient, reliable reporting select Whatagraph.
NinjaCat pricing is quote-based. Third-party sites report ranges like $999 to $2,599 for NinjaCat for larger agencies. Even at its lowest tiers, NinjaCat is at least $200 more expensive than Whatagraph, while higher tiers cost 3x more.
The pros listed in the NinjaCat review are a large integration library, white-label client portals, call tracking, and cross-client standardization. The cons of NinjaCat include data accuracy issues, slower performance on large datasets, higher pricing, and a steeper learning curve compared to Whatagraph.
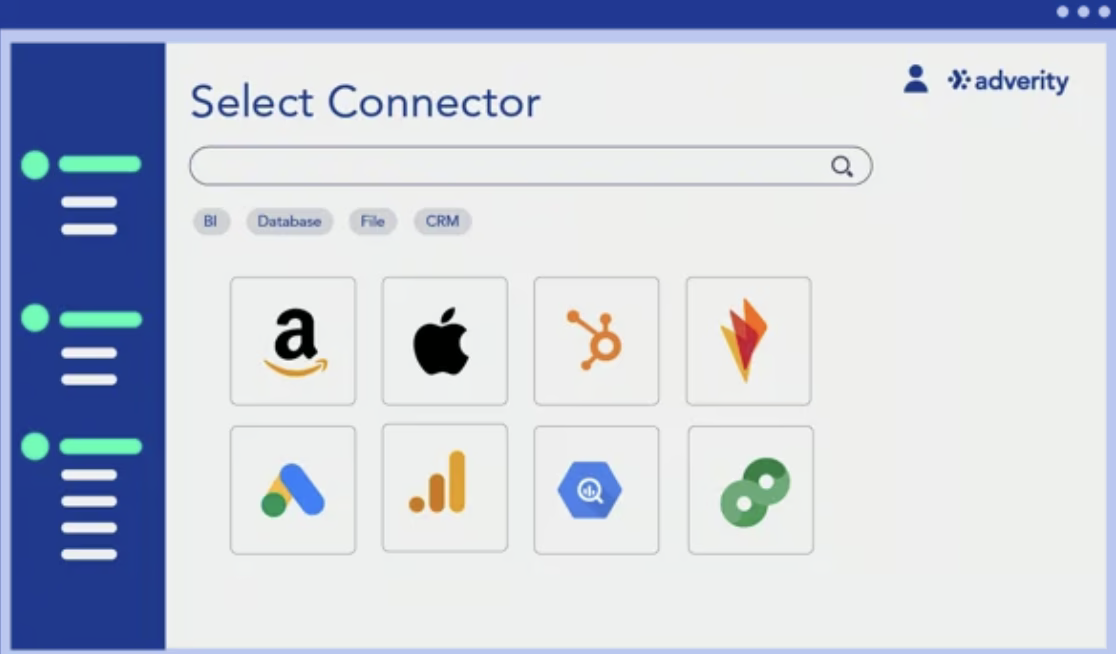
7. Adverity: Best Whatagraph Alternative for Robust Enterprise ETL
Adverity is the best Whatagraph alternative for robust enterprise ETL (Extract, Transform, Load) with advanced data transformation and warehouse integration. Adverity is a data integration platform that automates the collection, transformation, and storage of marketing data from hundreds of sources into centralized data warehouses (Google BigQuery, Amazon Redshift, Snowflake, Azure Synapse) for advanced analysis.
Adverity provides enterprise organizations with the data engineering capabilities and governance controls that exceed the basic ETL features in Whatagraph.
Adverity features include 600+ pre-built data connectors, automated data extraction and loading, advanced data transformation and cleansing rules, data warehouse integration (BigQuery, Snowflake, Redshift), data quality monitoring, and validation.
It offers API-based custom connector creation, automated workflow orchestration, role-based access controls, and data lineage tracking. The Adverity platform focuses on building scalable data pipelines that feed enterprise BI tools rather than creating end-user dashboards directly.
Whatagraph provides an all-in-one solution where data extraction, transformation, and visualization occur in a single platform, while Adverity focuses exclusively on robust data pipeline creation that feeds separate visualization tools (Tableau, Power BI, Looker).
Compared to Whatagraph, Adverity is the best alternative for enterprises that need industrial-strength ETL capabilities, data warehouse integration, and advanced transformation logic rather than integrated dashboard creation for agency reporting.
Adverity pricing requires custom enterprise quotes based on data volume, connector usage, and infrastructure requirements, with reported annual costs starting at $30,000 to $40,000 and scaling significantly higher for large deployments.
The cost difference compared to Whatagraph reflects fundamentally different product categories, where Adverity sells enterprise data infrastructure and Whatagraph provides agency reporting tools.
Advantages noted in the Adverity review include a massive connector library, data transformation capabilities, reliable data warehouse integration, enterprise-grade data governance, and strong technical support.
Disadvantages of Adverity include very high costs, prohibitive for small to mid-sized businesses, a requirement for technical expertise to configure transformations, no native visualization layer requiring separate BI tools, complex setup and longer deployment timelines, and overkill complexity for teams that need simple reporting.
An agency that needs fast, automated client reporting will find Whatagraph easier to use, while enterprises with analytics teams handling large, complex datasets will gain more from the advanced data processing in Adverity.
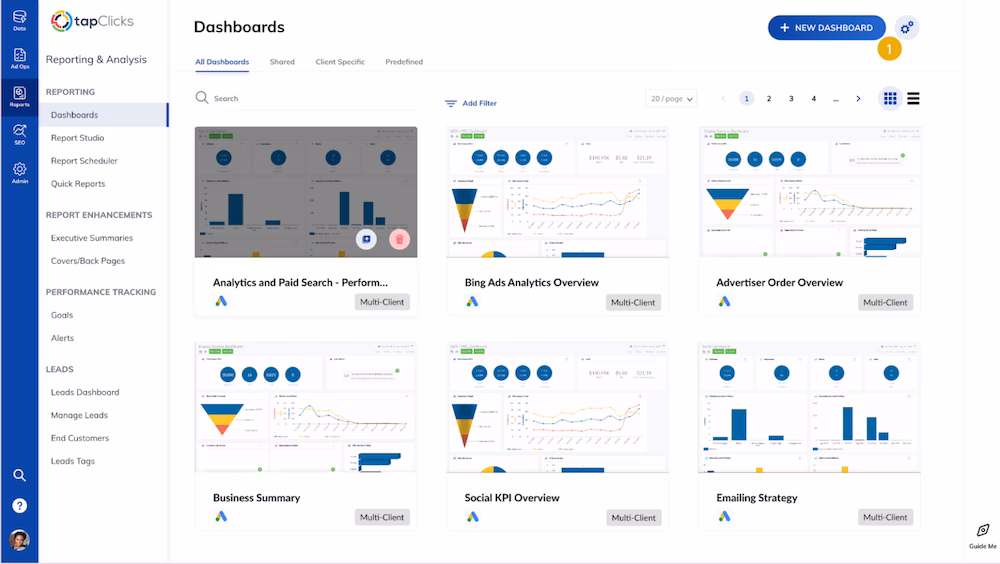
8. TapClicks: Best Whatagraph Alternative for High-volume Agency Data Management
TapClicks is the best Whatagraph alternative for high-volume agency data management. TapClicks is a marketing operations suite that combines data ingestion, analytics, reporting, and workflow management, designed for agencies handling multiple brands and clients at scale.
TapClicks features include over 10,000 data connectors, SmartConnector™ for custom sources, TapReports for automated client reporting, TapAnalytics for real-time dashboards, TapWorkflow for task management, TapOrders for campaign execution, TapInsights for AI-driven recommendations, and full white-label branding options.
Agencies use TapClicks to centralize disparate datasets, scale reporting for hundreds of clients, and streamline operational workflows.
Compared to Whatagraph, TapClicks is positioned for scale and operational depth. Whatagraph emphasizes simplicity, fast client-facing reports, and an intuitive drag-and-drop builder. TapClicks requires more setup and investment but provides greater flexibility, advanced analytics, and workflow automation.
TapClicks pricing structure revolves around 2 choices, which include a data package (TapDataLite, TapData+, TapData Max) and a data destination (TapReports, TapAnalytics, TapInsights, or third-party exports).
TapClicks pricing starts at $99/month for TapDataLite plus the cost of a destination. For example, TapDataLite ($99) combined with TapAnalytics ($899) brings the entry total to $998/month for 10 clients and unlimited users. Larger packages raise the base cost with more connectors and faster refresh rates.
Whatagraph pricing starts at $285/month, which makes TapClicks significantly more expensive but better suited for agencies managing large-scale data.
The pros in the TapClicks review include expansive data coverage, advanced workflow modules, strong white-label branding, and AI-driven insights. The cons of TapClicks are higher starting costs, a steeper learning curve, and a less intuitive setup compared to streamlined tools like Whatagraph.
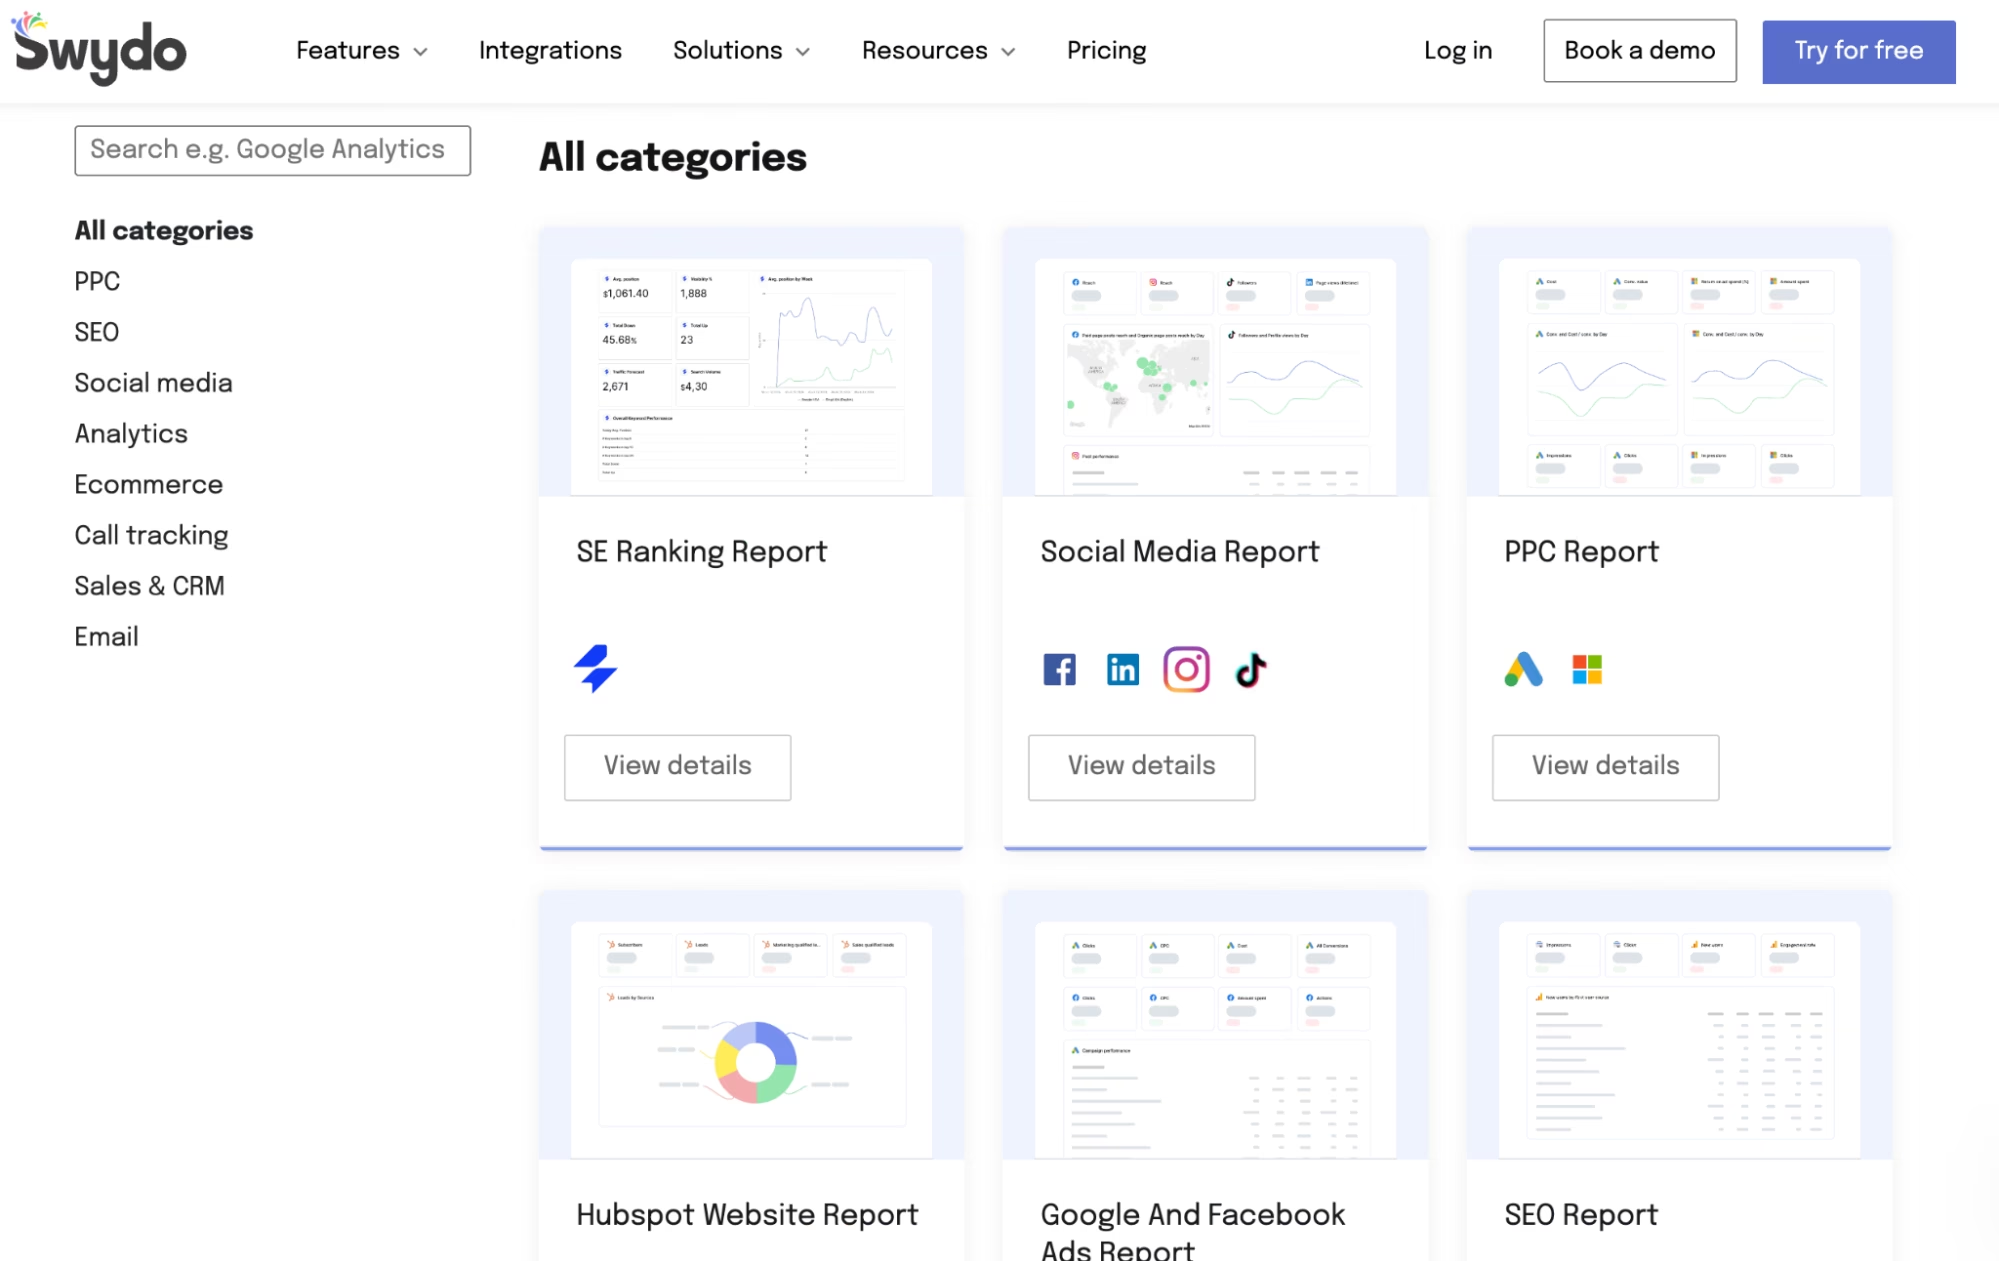
9. Swydo: Best Whatagraph Alternative for Automated PDF Media Reports
Swydo is the best Whatagraph alternative for automated PDF media reports. Swydo is built for agencies and media buyers that need fast, template-based client reports delivered on a recurring schedule without heavy setup.
Swydo is a marketing reporting platform that automates the creation and delivery of reports through drag-and-drop widgets, pre-built templates, and scheduled PDF generation.
Swydo features more than 40 data integrations, including Google Ads, Facebook Ads, Instagram, LinkedIn, Google Analytics, and Google Search Console. It offers pre-built templates for PPC, SEO, and social reporting, a drag-and-drop report builder, automated PDF scheduling, white-label branding, and client monitoring dashboards.
Compared to Whatagraph, Swydo focuses on rapid PDF generation while Whatagraph delivers broader customization, more robust data blending, and interactive dashboards. Whatagraph enables agencies to manipulate data sources and create custom metrics, while Swydo is optimized for fast implementation using standardized templates. Agencies producing hundreds of recurring PDF reports will value the efficiency of Swydo, while Whatagraph provides deeper analytics and more visual polish for interactive client presentations.
Swydo pricing starts at $49/month for 10 data sources with unlimited users. Costs scale by volume ($3.50 per source from 11 to 100, $2.50 per source from 101 to 500, and $1.50 per source above 500). A large setup of 1,001 sources is priced at $2,115.50/month. In contrast, Whatagraph starts at $286/month, which makes Swydo significantly cheaper at the entry level but capable of scaling higher at volume.
The pros in the Swydo review include quick setup with templates, reliable automated PDF generation, white-label branding, responsive support, and time savings of several hours per report.
The cons of Swydo are limited customization compared to Whatagraph, fewer integrations, occasional connector reliability issues, and weaker data blending for complex reporting needs.
10. Cyfe: Best Whatagraph Alternative for Simple KPI Dashboards
Cyfe is the best Whatagraph alternative for simple KPI (Key Performance Indicators) dashboards. Cyfe is a budget-friendly reporting tool that centralizes KPIs from advertising, analytics, and CRM sources.
Cyfe users create lightweight dashboards using configurable widgets and limited templates, which makes it accessible but less advanced than full-scale reporting platforms.
Cyfe features 25 native integrations with platforms like Google Ads, Facebook Ads, Mailchimp, and HubSpot, plus Zapier and API connectors. It features custom widgets, basic “Mashup” data blending, unlimited history storage, TV dashboard sharing, email and PDF exports, and white-label options on higher plans.
Small teams use Cyfe to create quick visibility into ad spend, conversions, or traffic trends, but setup is time-consuming since widgets require manual configuration.
Compared to Whatagraph, Cyfe is simpler but less powerful. Whatagraph offers 55+ fully managed integrations, pre-built widgets, customizable formulas, linked templates, and AI-powered insights.
Cyfe focuses on low-cost dashboards and basic reporting, while Whatagraph emphasizes advanced data blending, client-ready branding, and bulk editing for agencies managing dozens of clients.
Agencies that prioritize automation, scalability, and polished outputs will find Whatagraph stronger, while Cyfe appeals to those that prioritize affordability.
Cyfe pricing starts at $29/month (2 dashboards, 1 user), with Standard at $39 (5 dashboards, 2 users), Pro at $65 (10 dashboards, 5 users), Premier at $119 (20 dashboards, unlimited users), and Agency plans from $190/month (100 dashboards, 15 users, 10 clients, $19 per extra client). Whatagraph starts at $286/month, making Cyfe far cheaper at the entry level but more limited for larger reporting needs.
The pros in the Cyfe review include low pricing, simple dashboards, unlimited history, and flexible sharing (email, PDF, links, TV mode). The cons of Cyfe are limited integrations, no advanced formulas, slow product updates, weak customer support, and minimal customization compared to Whatagraph.
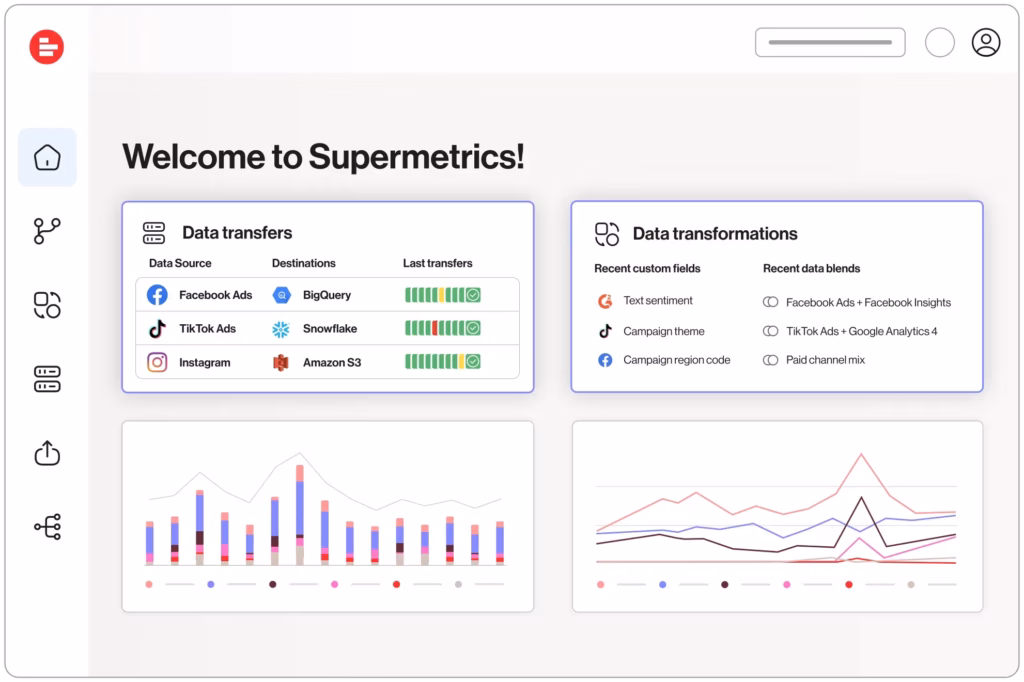
11. Supermetrics: Best Whatagraph Alternative for Data Pipeline Integration
Supermetrics is the best Whatagraph alternative for data pipeline integration with specialized data connector technology and flexible destination options.
Supermetrics is an ETL connector and pipeline tool that pulls marketing data from 130+ sources and pushes it into destinations such as Google Sheets, Looker Studio, Excel, Power BI, and BigQuery. It does not include visualization, automation, or reporting features.
Supermetrics functions as a middle layer, which means users must manage a two-tool workflow, with Supermetrics for data pulling and Looker Studio, Power BI, or another BI tool for visualization. This creates added costs, setup complexity, and dependency on multiple vendors for troubleshooting.
In contrast, Whatagraph integrates data connection, visualization, white-label reporting, and automation in one platform, which reduces tool sprawl and lowers the total cost of ownership. Agencies that want branded, client-ready reports without maintaining connectors or external BI systems find Whatagraph more efficient.
Supermetrics caters more to analysts who want maximum control over data in spreadsheets or warehouses.
Supermetrics pricing starts at $29/month per data source for Google Sheets, Excel, Looker Studio, or Power BI. Warehouse destinations such as BigQuery or Azure require higher-tier or custom pricing. For agencies managing multiple clients, monthly costs range from $600 to $1,200 or depending on the add-ons for users, connectors, and sync frequency.
Whatagraph starts at $286/month with unlimited templates and integrated reporting, which makes its pricing more predictable for agencies than Supermetrics.
The pros in the Supermetrics review include wide integration coverage, flexible ETL pipelines, historical data retrieval, and compatibility with major BI tools.
The cons of Supermetrics are high pricing at scale, limited built-in visualization, reliance on external BI platforms, and a steeper learning curve compared to Whatagraph.
Supermetrics is a better alternative to Whatagraph for enterprises or data-savvy teams with existing BI infrastructure that only need a pipeline to move marketing data into spreadsheets, warehouses, or visualization tools.
12. Funnel.io: Best Whatagraph Alternative for Advanced Data Workflows
Funnel.io is the best Whatagraph alternative for advanced data workflows. Funnel is designed for enterprises and data-savvy teams that need to extract, clean, and normalize marketing data before sending it to BI tools, warehouses, or spreadsheets.
Funnel.io is a marketing data hub that connects to 500+ sources, harmonizes metrics with data mapping and naming conventions, and exports to Looker Studio, Power BI, Tableau, BigQuery, Snowflake, and Google Sheets.
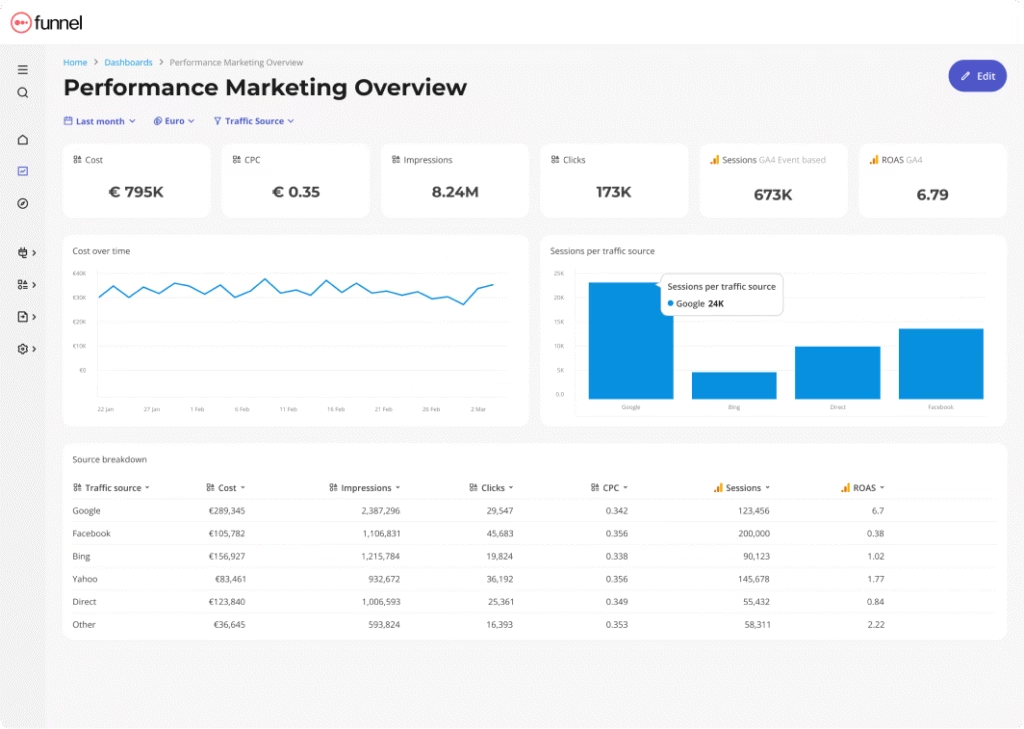
Funnel.io provides custom dimensions, automated currency conversions, advanced governance, and API-based exports. Its strength lies in its ETL capabilities, not in visualization or client-ready reporting.
Compared to Whatagraph, Funnel.io provides more depth for data preparation but lacks polished dashboards and automated client reports. Agencies that use Funnel typically pair it with BI tools for visualization, which adds cost and complexity.
Whatagraph integrates both connectors and reporting in one platform, which allows agencies to skip the “two-tool workflow” and deliver client dashboards directly. Enterprises with in-house BI teams benefit more from the data control in Funnell, while Whatagraph is better for agencies that manage multiple client reports.
Funnel.io pricing is custom and usage-based, calculated through flexpoints that scale with connectors, destinations, and data volume.
The advantages included in the Funnel.io review are a large connector library, powerful data cleaning and transformation, compatibility with BI tools, and file import fallback for unsupported platforms.
The disadvantages of Funnel.io are expensive and unpredictable pricing, a steep learning curve, frequent complaints about missing or duplicated data, limited native dashboards, and rigid cancellation policies.
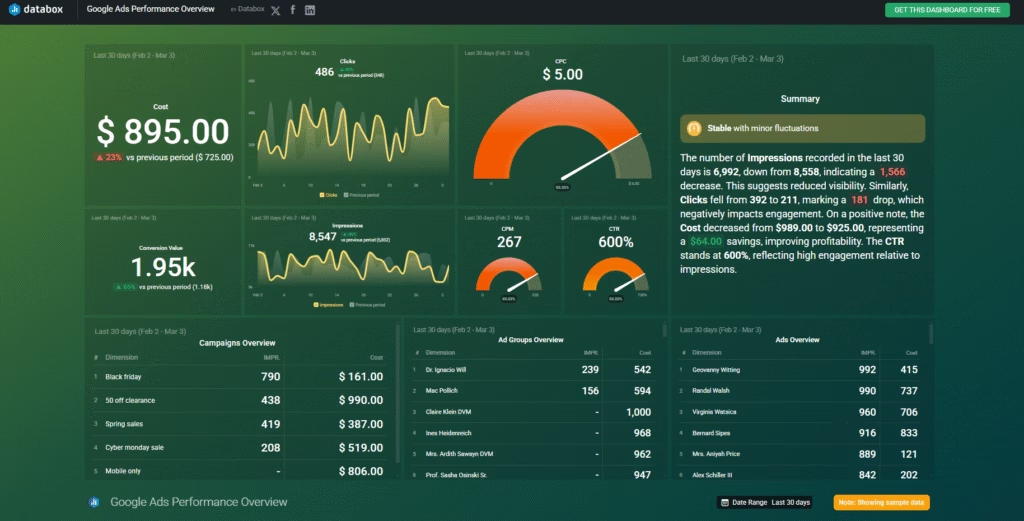
13. Databox: Best Whatagraph Alternative for Mobile-first KPI Snapshots
Databox is the best Whatagraph alternative for mobile-first KPI snapshots. Databox is built for smaller agencies and in-house teams that want quick, visual dashboards on web, mobile, and TV screens without investing in heavy BI tools or complex reporting setups.
Databox integrates with 130+ data sources and adds no-code features like Metric Builder for custom KPIs, Datasets for cleaning and merging raw records, and AI-powered Performance Summaries for quick insights. It offers 200+ pre-built templates, 20+ chart types, and automated alerts, which gives teams a DIY BI platform that balances speed with self-service analytics.
Compared to Whatagraph, Databox emphasizes mobile interactivity and fast internal views, while Whatagraph provides broader customization, stable integrations, and advanced data blending.
Agencies that need reusable client reports, flexible branding, and reliable connectors prefer Whatagraph, while Databox suits teams that want lightweight, mobile-friendly monitoring.
Databox pricing starts with a Free Forever plan for 3 data sources, followed by Starter at $47/month, Professional at $159/month, Growth at $359/month, and Premium at $799/month. Costs scale by connectors, not users, so agencies with many accounts are going to face higher bills than with Whatagraph, which includes unlimited connectors in its pricing.
The pros highlighted by the Databox review include fast setup, a polished mobile app, real-time dashboards, and a free plan for small teams.
The cons of Databox are fragile connectors, limited customization, expensive scaling, and inconsistent customer support compared to Whatagraph’s dedicated success managers.
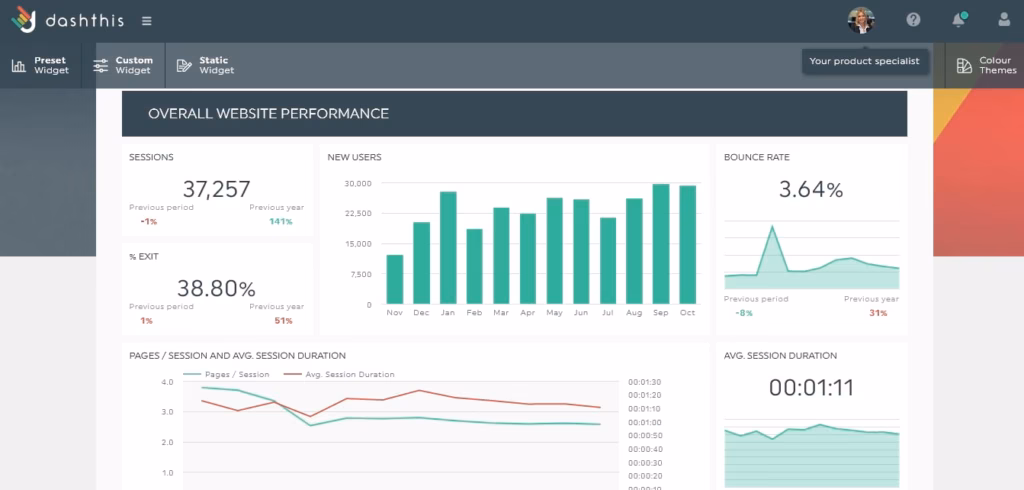
14. DashThis: Best Whatagraph Alternative for Simple Automated Agency Reports
DashThis is the best Whatagraph alternative for simple automated agency reports. DashThis is built for freelancers and small agencies that want quick, template-based dashboards without complex integrations or data modeling.
DashThis offers 29+ marketing integrations, CSV (Comma-Separated Values) uploads, and unlimited data sources on all plans. It comes with pre-set templates for SEO, PPC, social, and ecommerce, a drag-and-drop dashboard builder, white-label branding, and email or PDF sharing.
Agencies get basic customization like custom domains and themes, but advanced blending and custom metrics are limited.
Compared to Whatagraph, DashThis focuses on ease and speed, while Whatagraph scales better with 55+ integrations, linked report templates, and deeper customization. DashThis works well when you need to push out simple reports fast, but Whatagraph is better for agencies managing multiple clients that require accurate data blending and branded client-ready dashboards.
DashThis pricing starts at $49/month for 3 dashboards, $159/month for 10 dashboards, $309/month for 25 dashboards, and $479/month for 50 dashboards. All tiers include unlimited users and integrations. At the entry level, DashThis is $237/month cheaper than the Whatagraph $286 entry plan, but costs climb quickly if each client needs multiple dashboards.
The benefits mentioned in the DashThis review include a fast setup, unlimited users and integrations on every plan, reliable white-label features, and clean dashboard templates.
The downsides of DashThis are limited integrations, fragile connectors, weak customization, and rising costs when agencies need multiple dashboards per client.
15. Klipfolio: Best Whatagraph Alternative for Customizable Data Visualizations
Klipfolio is the best Whatagraph alternative for customizable data visualizations. Klipfolio is designed for technical teams and data-savvy agencies that want flexible dashboards with deep customization and are comfortable with hands-on setup.
Klipfolio connects with 140+ data sources, including Google Analytics, Facebook Ads, Salesforce, HubSpot, and SQL databases. It offers customizable “Klips” (widgets), advanced chart editing, REST/SQL connectors, and white-label options.
Klipfolio features include role-based access controls, single sign-on (SSO) on higher tiers, automated data refresh scheduling, client dashboard templates, and custom domains and themes through add-ons.
Compared to Whatagraph, Klipfolio provides more customization but requires more technical expertise. Whatagraph focuses on speed, ready-made templates, and managed integrations, while Klipfolio suits teams that want to build tailored dashboards with advanced queries.
Whatagraph simplifies multi-client reporting workflows, but Klipfolio delivers broader flexibility for internal KPI tracking and data-centric teams.
Klipfolio pricing starts at $140/month for 3 dashboards with unlimited users and 4-hour refreshes. Higher tiers scale to $220/month for 10 dashboards, $350/month for 20 dashboards, and $690/month for 40 dashboards with faster refresh rates and SSO. Agency plans start at $110/month for 5 clients and scale to $1,025/month for 80 clients, with extra costs for add-ons like white-labeling, custom domains, and near real-time refresh. At scale, Klipfolio is significantly more expensive than the Whatagraph $286/month entry plan.
The pros in the Klipfolio review include extensive integrations, highly customizable data visualizations, flexible sharing options, and strong security features.
The cons of Klipfolio are steep learning curves, unreliable connectors, slow load times with large datasets, limited pre-built templates, and expensive add-ons that raise costs quickly for agencies.
16. Improvado: Best Whatagraph Alternative for AI-powered Marketing Analytics
Improvado is the best Whatagraph alternative for AI-powered marketing analytics. Improvado is built for enterprises and agencies with data teams that need to centralize, clean, and transform marketing data across hundreds of channels before pushing it into BI tools or warehouses.
Improvado integrates with 500+ marketing and sales data sources, enables no-code and custom data transformations, and enforces campaign governance with 250+ automated rules.
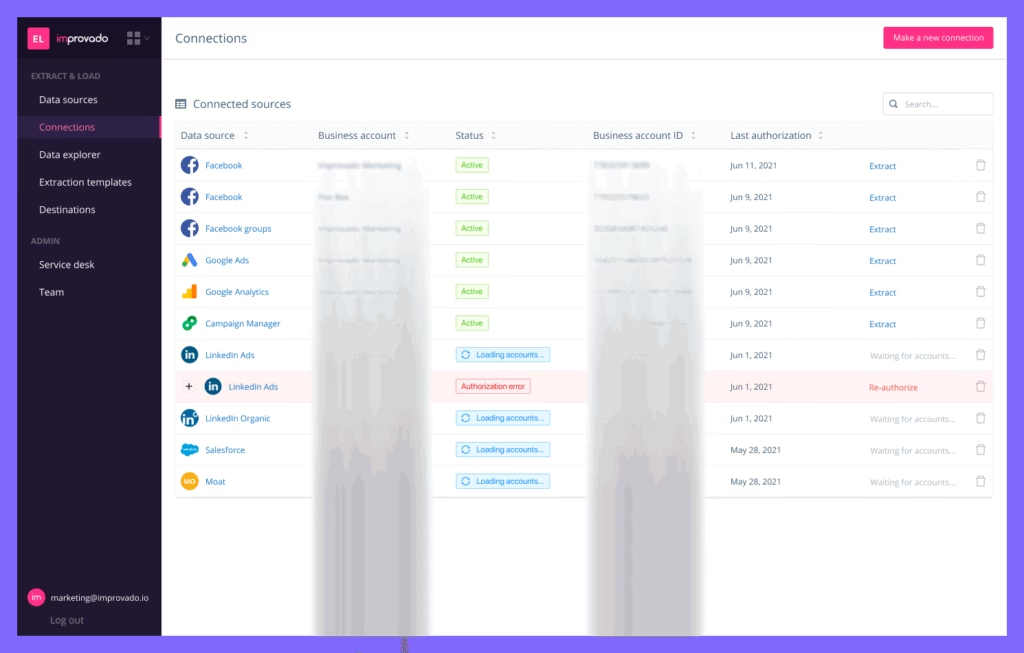
The Improvado platform includes AI Agents that automate routine analytics tasks, enterprise-grade security (SOC 2, HIPAA, GDPR, CCPA), and professional services for custom pipeline design. Improvado acts as a full ETL pipeline.
Compared to Whatagraph, Improvado offers deeper data processing and governance but lacks polished, client-ready dashboards. Whatagraph provides all-in-one workflows, while Improvado requires pairing with visualization tools such as Tableau or Looker Studio.
Improvado is a better-suited Whatagraph alternative for enterprises that manage complex pipelines and compliance-heavy industries.
Improvado pricing is not publicly listed and is quote-based, structured across Growth (up to 200M rows), Advanced (up to 600M rows), and Enterprise (up to 1B+ rows). Reviews suggest it sits in the mid-to-high tier, with credit-based add-ons for custom connectors, governance modules, and AI Agents.
The advantages outlined in the Improvado review include extensive integrations, powerful ETL pipelines, enterprise security, and responsive high-tier support.
The disadvantages of Improvado are steep learning curves, a 2-month setup period, a lack of native client reporting, reliance on external BI tools, and credit-based add-ons that raise total costs.
17. Fivetran: Best Whatagraph Alternative for Automated Data Replication
Fivetran is the best Whatagraph alternative for automated data replication and enterprise-grade data pipelines. Fivetran is built for companies with existing data warehouses and BI infrastructure that need automated, reliable replication of marketing, sales, and operational data at scale.
Fivetran connects to 700+ data sources and moves data into destinations like Snowflake, BigQuery, Databricks, and Redshift. It handles schema drift automatically, provides enterprise-grade security (SOC 1 & SOC 2, ISO 27001, PCI DSS Level 1, HIPAA, GDPR, CCPA), and processes over 10 trillion rows per month.
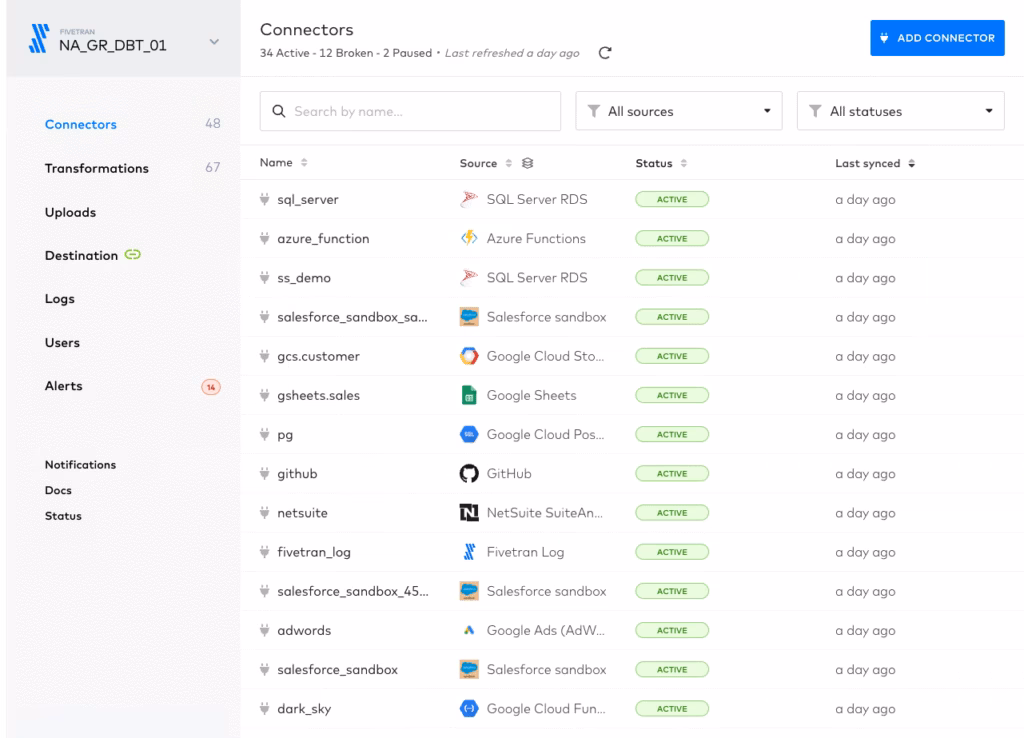
Key features of Fivetran include prebuilt connectors across SaaS (Software as a Service), ERP (Enterprise Resource Planning), and database systems, automated schema management, transformation orchestration with dbt or Coalesce, high-frequency syncs (down to 1 minute on Enterprise), and throughput speeds of 500+ GB/hour.
Compared to Whatagraph, Fivetran focuses on extracting and loading data into warehouses, not client-ready reporting. Whatagraph provides out-of-the-box dashboards, templates, and white-labeled reports, while Fivetran relies on pairing with BI tools such as Looker, Power BI, or Tableau.
Agencies and enterprises that already maintain a modern data stack will benefit from the depth of connectors and automated pipelines in Fivetran, whereas teams that need fast, branded reporting without additional tools will find Whatagraph more practical.
Fivetran pricing is usage-based, calculated by Monthly Active Rows (MAR). Each unique row added or updated in a destination counts toward MAR, and costs vary by connector. Pricing tiers moved from account-level to connection-level in 2025, which means users with many equal-sized connections pay more.
Entry-level annual contracts start at $12,000, and real-world reports show monthly costs ranging from $241 for a single connector to more than $15,000/year for multi-client setups.
The pros in the Fivetran review include a massive connector library, automated schema drift handling, strong security and compliance, reliable syncs for mature connectors, and excellent technical documentation.
The cons of Fivetran are high and unpredictable pricing, no built-in dashboards or reporting, dependence on external BI tools, a steep learning curve for non-technical users, and inconsistent support experiences at lower tiers.
18. Geckoboard: Best Whatagraph Alternative for TV Dashboard Displays
Geckoboard is the best Whatagraph alternative for TV dashboard displays. Geckoboard is a lightweight dashboard tool that helps small teams and businesses visualize live KPIs and broadcast them on screens for internal use. It works best for organizations that want to display real-time performance metrics rather than build complex client reports.
Geckoboard features 90+ data integrations, such as Google Analytics, Salesforce, HubSpot, Zendesk, and Shopify. It offers ready-made widgets for quick visualization, KPI goals, status indicators, and built-in support for sharing dashboards on TVs.
Users are able to share Dashboards via links, Slack, or email, and limited customization is available through logos and themes. However, Geckoboard does not provide data blending, custom formulas, offline data entry, or full white-labeling, which makes it less suitable for agencies.
Compared to Whatagraph, Geckoboard provides a faster way to set up live dashboards but lacks advanced reporting depth. Whatagraph allows agencies to blend cross-channel data, create custom metrics, and deliver fully branded reports, while Geckoboard is designed for lightweight, internal KPI tracking.
Geckoboard pricing starts at $75/month for the Essential plan with one dashboard, one editor, and ten viewers. The Core plan costs $219/month with 20 dashboards, more editors and viewers, and additional sharing options. The Pro plan costs $399/month with 50 dashboards, advanced metrics, and interactive views. Enterprise pricing is custom, with SSO, API access, and dedicated support.
Each extra dashboard, editor, or viewer costs $25 per month, which increases total costs quickly. By contrast, Whatagraph starts at $286/month, which is around $200 more expensive than the Geckoboard basic plan, but it includes unlimited reporting capacity and broader customization, making it more cost-effective for agencies.
The benefits listed in the Geckoboard review are easy setup, clean widgets, stable integrations, and built-in TV dashboard support.
The downsides of Geckoboard are limited customization, no data blending, minimal white-labeling, and high costs when scaling users or dashboards.
19. HubSpot Marketing Hub: Best Whatagraph Alternative for Integrated Marketing Automation
HubSpot Marketing Hub is the best Whatagraph alternative for integrated marketing automation with comprehensive campaign management and native reporting. HubSpot Marketing Hub is an all-in-one marketing platform that combines email marketing, social media management, landing pages, marketing automation, and analytics into a unified system with built-in reporting dashboards.
HubSpot Marketing Hub integrates directly with the HubSpot CRM, which allows marketers to consolidate customer data, automate cross-channel campaigns, and connect every touchpoint to business outcomes.
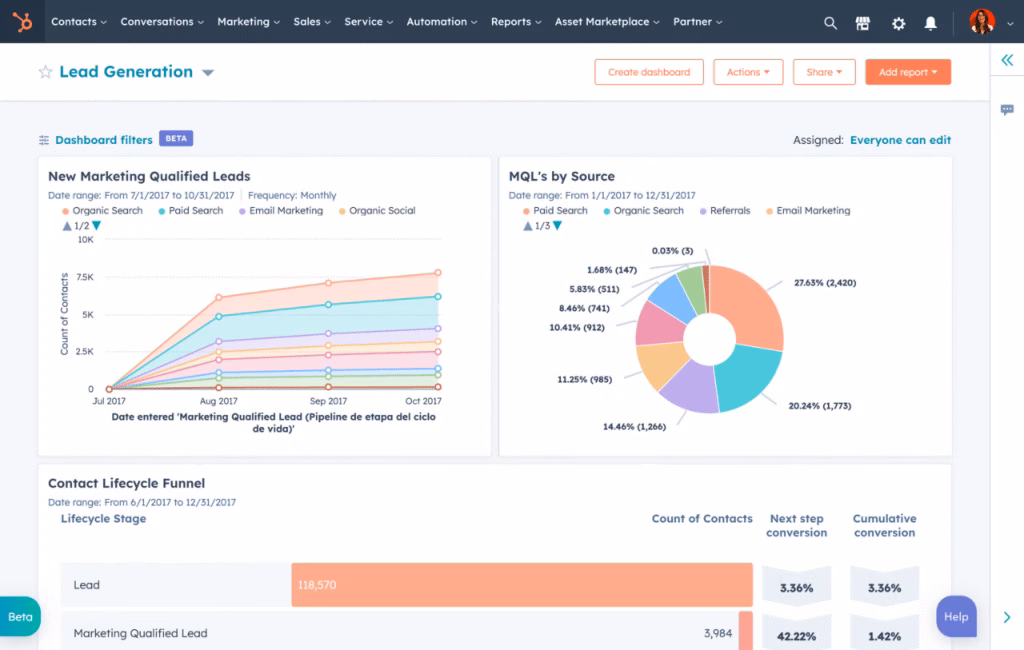
HubSpot Marketing Hub features advanced journey analytics, multi-touch attribution, omnichannel automation, AI-powered reporting, and audience segmentation through lead scoring and personalization. These functions position HubSpot as more than a reporting tool, since it facilitates end-to-end marketing execution and budget optimization.
Whatagraph focuses on cross-channel performance dashboards and reporting templates, while HubSpot provides full-funnel automation tied to CRM data, which makes it more suitable for teams that need to prove ROI and scale campaigns.
HubSpot offers a free plan with basic email, form, and reporting tools. The Starter plan begins at €9/month per seat. The Professional plan starts at €792/month and includes advanced marketing features. The Enterprise plan starts at €3,300/month, with additional seats, attribution tools, and journey analytics. Each upgraded tier also requires a one-time onboarding fee (ranging roughly €2,930 to €6,830).
HubSpot is significantly more expensive than Whatagraph for business and enterprise users.
The main advantages highlighted in the HubSpot Marketing Hub review are its integrated CRM connection, advanced attribution reporting, and ability to orchestrate campaigns across multiple channels from one system.
The disadvantages of the HubSpot Marketing Hub include higher costs, mandatory onboarding fees, and greater complexity that requires experienced marketing teams to manage effectively.
20. Semrush: Best Whatagraph Alternative for Comprehensive Competitive Analysis
Semrush is the best Whatagraph alternative for comprehensive competitive analysis with SEO research and digital marketing intelligence. Semrush is an all-in-one digital marketing platform that combines SEO tools, competitive research, content marketing, social media management, and advertising analytics. Semrush provides digital marketing intelligence and competitive insights that compete with Whatagraph in scenarios where teams need research capabilities alongside reporting.
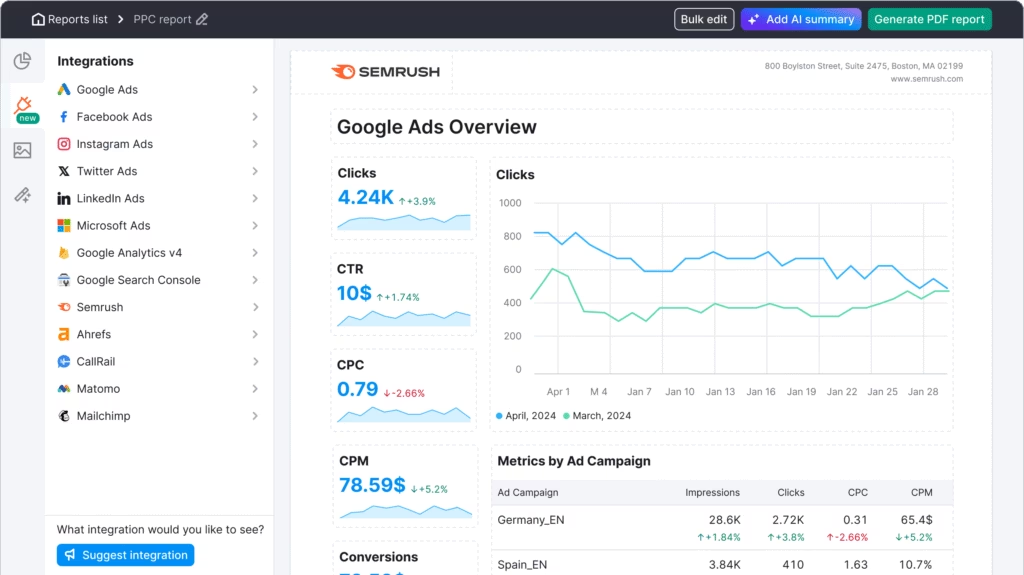
Semrush includes core features like Domain Overview, Keyword Magic Tool, Position Tracking, Site Audit, and Backlink Analytics. Semrush offers a reporting suite (My Reports) designed to centralize marketing data, automate client updates, and integrate over 35 sources into a single branded report.
Semrush defines its reporting product as a customizable environment with templates for Google Analytics 4, Google Search Console, SEO, PPC, and social media. Features include white-label design, automated scheduling, and AI-powered summaries that highlight key performance trends and recommended actions.
Compared to Whatagraph, Semrush reporting covers SEO, paid ads, and social channels within the same environment as the broader suite. However, this feature is most valuable to teams that are already paying for Semrush.
Reporting is not the primary focus of Semrush, and access to advanced templates or automation requires higher-tier plans.
Semrush pricing starts at $139.95/month, which is $146 cheaper than the $286/month entry plan in Whatagraph. However, advanced reporting in Semrush is locked behind the Guru plan at $249.95/month, and API-level access requires the Business plan at $499.95/month.
While Semrush appears cheaper at the base tier, agencies that need advanced reporting features end up paying more than they would with Whatagraph.
According to our Semrush review, the pros include robust competitor analysis, wide keyword coverage, and integrated SEO features. Cons include higher overall cost at scale, limited access to advanced reporting on lower tiers, and traffic estimate inaccuracies.
21. Google Analytics: Best Whatagraph Alternative for In-depth Website Insights
Google Analytics is the best Whatagraph alternative for in-depth website insights with comprehensive traffic analysis and user behavior tracking. Google Analytics 4 (GA4) is a web analytics platform that tracks website traffic, user behavior, conversion paths, and audience demographics through JavaScript tracking code embedded on web pages.
Google Analytics provides detailed website performance data that competes with Whatagraph in scenarios where teams focus primarily on website analytics, not cross-channel marketing reporting.
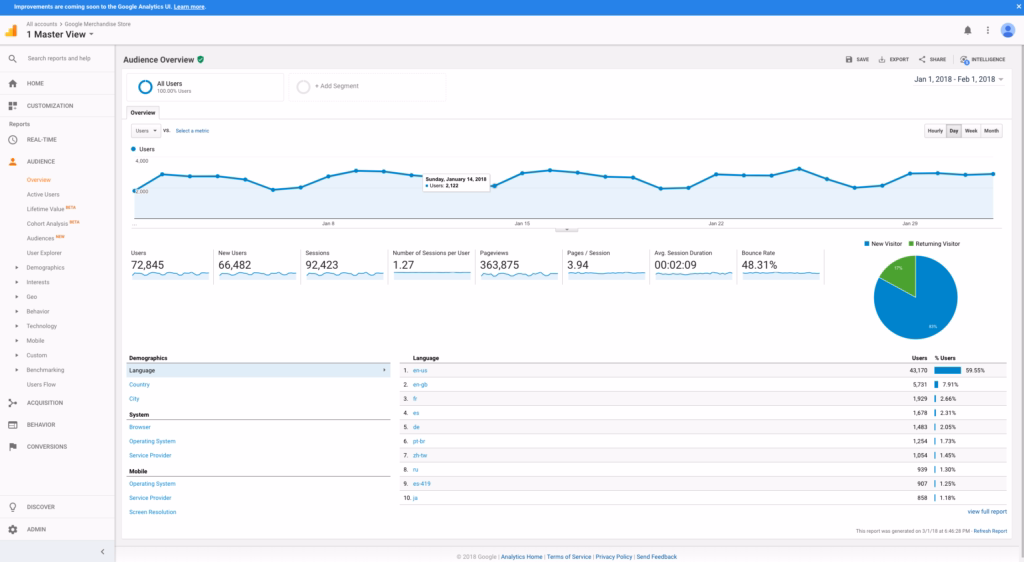
Key features of Google Analytics include real-time traffic monitoring, audience segmentation by demographics or interests, multi-channel funnel tracking, e-commerce reporting, and integrations with Google Ads, Google Tag Manager, and Search Console. Teams use Google Analytics to track campaigns, monitor revenue attribution, and refine marketing strategies with event-based data.
Compared to Whatagraph, Google Analytics provides direct first-party data with deeper granularity, while Whatagraph acts as a reporting layer that aggregates multiple third-party sources into client-friendly dashboards.
Google Analytics excels in website insights, attribution paths, and event-level data, while Whatagraph specializes in multi-channel reporting and visualization for agencies. This means Whatagraph is stronger for consolidated cross-platform reports, whereas Google Analytics is stronger for in-depth analysis of a single property.
Google Analytics pricing includes a free tier with nearly all standard features, while advanced usage requires Google Analytics 360, which is custom-priced but typically costs over $12,500 per month. In contrast, Whatagraph starts at $286/month, which makes Google Analytics far cheaper for small and mid-sized teams but significantly more expensive at the enterprise analytics level.
Pros highlighted in the Google Analytics review are its free availability, advanced segmentation, and robust attribution models. Cons of Google Analytics include a steep learning curve, sampled data in high-traffic reports, and limited out-of-the-box integrations compared to Whatagraph.
22. Microsoft Power BI: Best Whatagraph Alternative for Cost-effective Interactive Analysis
Microsoft Power BI is the best Whatagraph alternative for cost-effective interactive analysis with enterprise business intelligence capabilities and Microsoft ecosystem integration. Microsoft Power BI is a business intelligence (BI) and data visualization platform that connects to multiple data sources and transforms raw information into interactive dashboards and reports.
Features of Microsoft Power BI include data modeling, interactive dashboards, and governed sharing. Microsoft Power BI provides semantic models, DAX (Data Analysis Expressions) calculations, and drill-through interactions, which enable descriptive analysis, diagnostic exploration, and executive storytelling in one workspace.
Microsoft Power BI enables embedding in apps, scheduled refresh, and row-level security for distribution with control.
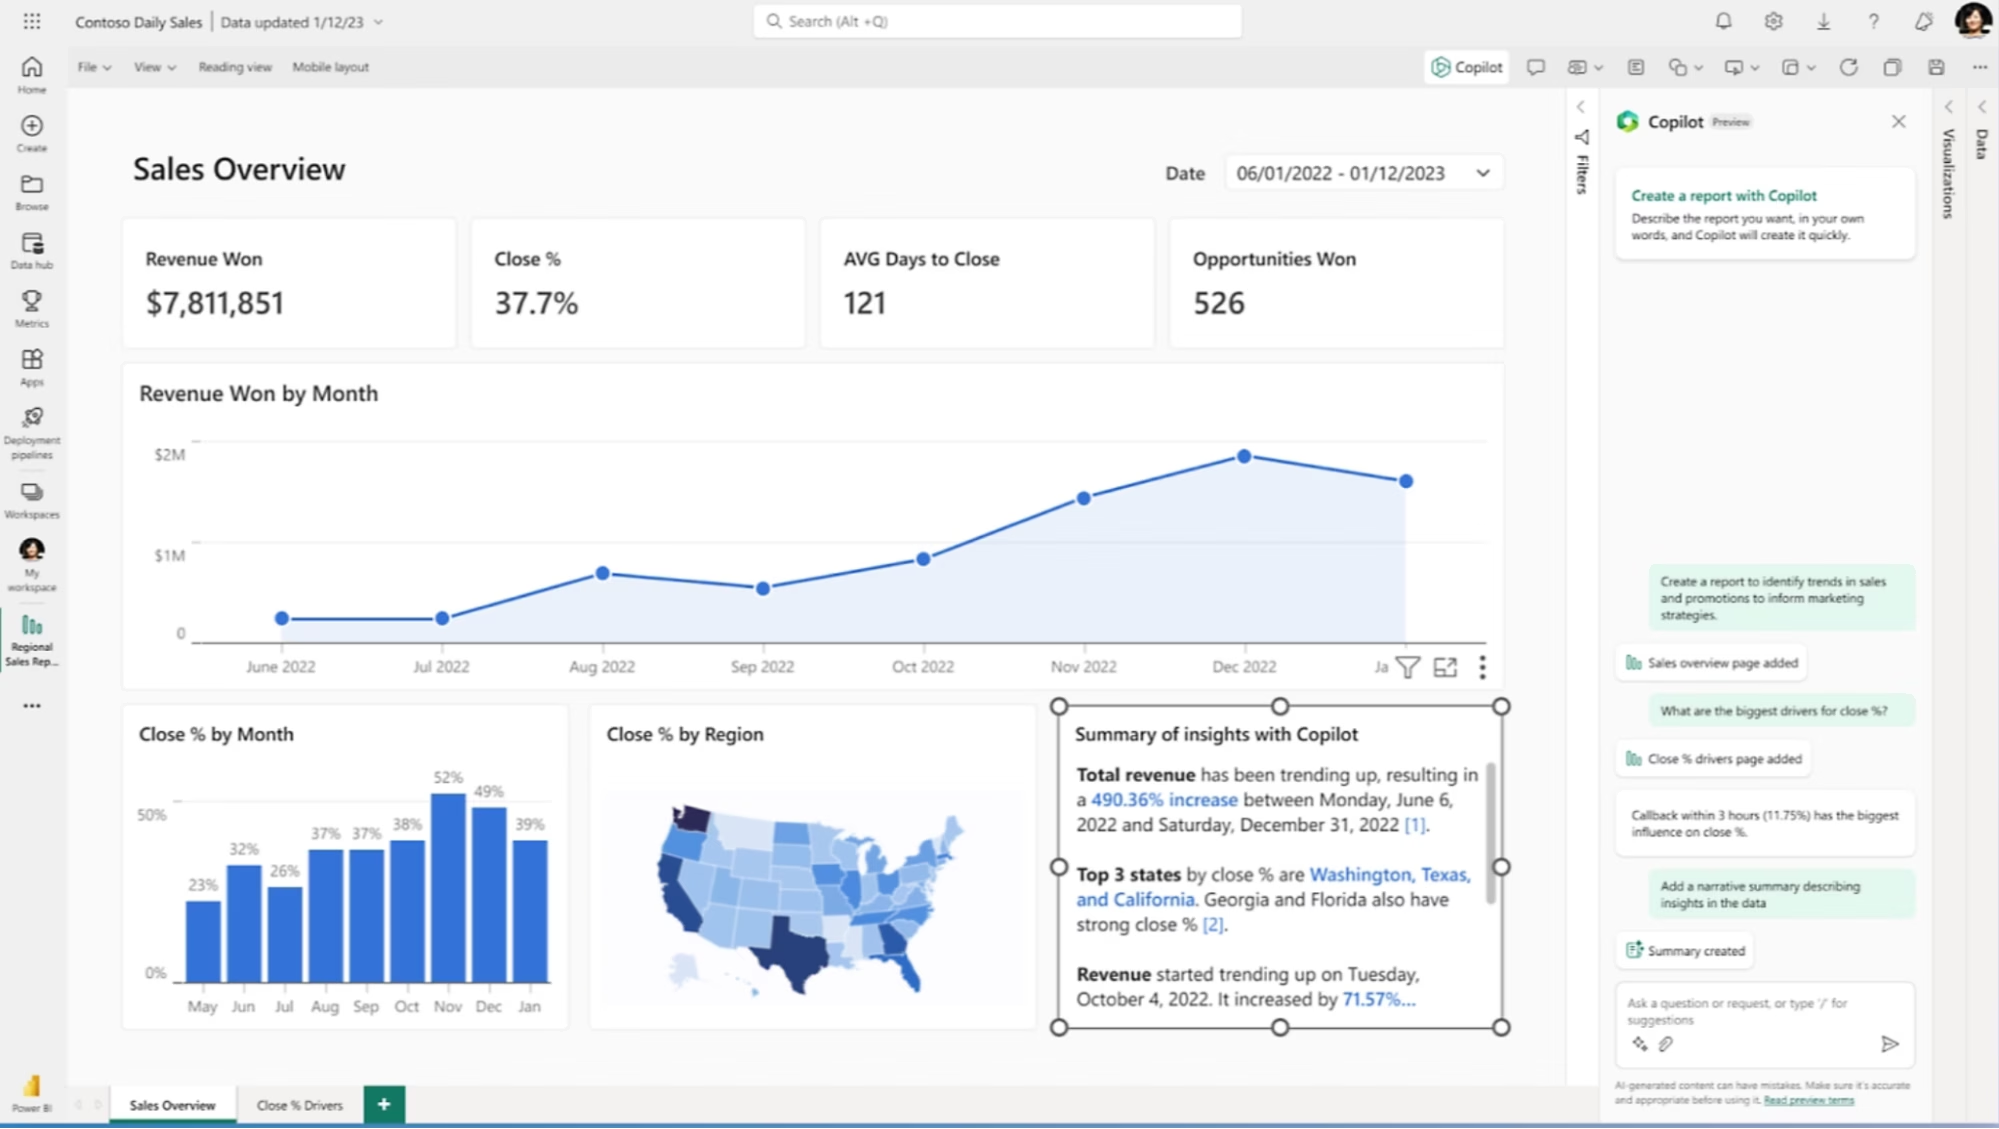
Microsoft Power BI is an alternative to Whatagraph for teams that prioritize interactive analysis, flexible data modeling, and enterprise controls. Microsoft Power BI replaces static PDF reporting with live dashboards, which improve monitoring, collaboration, and decision velocity.
Microsoft Power BI does not replace rank tracking, competitor research, backlinks monitoring, audit workflows, or keyword research, which fall outside the scope of business intelligence.
Pricing for Microsoft Power BI is free for authoring with a desktop app, $14 per user per month for Power BI Pro, and $24 per user per month for Premium Per User. Microsoft Power BI Free enables local report creation, Power BI Pro enables publishing and sharing, and Premium Per User unlocks larger datasets and advanced features, which lowers entry cost for small teams while preserving scale for larger deployments.
The advantages mentioned in the Microsoft Power BI review include cost-effective plans, strong integration with the Microsoft ecosystem, and advanced interactive features.
Disadvantages of Microsoft Power BI include a steeper learning curve, the need for technical setup for complex queries, and less focus on pre-built marketing templates compared to Whatagraph.
23. Tableau: Best Whatagraph Alternative for Advanced Data Visualization
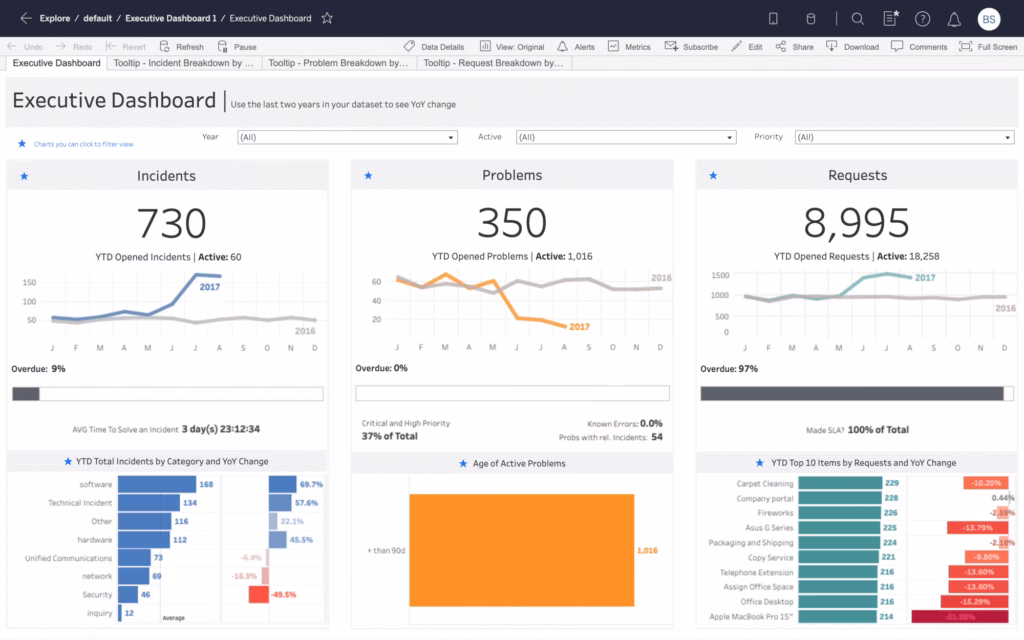
Tableau is the best Whatagraph alternative for advanced data visualization with sophisticated analytical capabilities and interactive exploration. Tableau is a data visualization and business intelligence platform that enables users to create complex, interactive dashboards through visual query interfaces and drag-and-drop workflows.
Tableau provides enterprise-grade visualization capabilities that compete with Whatagraph in organizations that prioritize analytical depth and visualization sophistication over marketing workflow simplicity.
Tableau offers five core products (Tableau Desktop, Tableau Public, Tableau Server, Tableau Online, and Tableau Reader), which provide development and sharing functions for charts, dashboards, and reports.
Tableau provides live connections to databases such as Oracle, AWS (Amazon Web Services), and Google Cloud SQL, then lets users design dashboards without coding.
Tableau Server and Tableau Online distribute these dashboards via browser or mobile, while Tableau Reader allows free local viewing with restricted editing.
Tableau, as an alternative to Whatagraph, delivers highly customizable analytics that extend to blended data and exploratory “what‑if” scenarios. Whatagraph focuses on automating marketing channel reports with fixed widgets. Tableau, therefore, suits analysts and enterprises that require deep control of visualization, while Whatagraph suits agencies that prioritize speed and simplicity in client reporting.
Tableau does not natively cover rank tracking, competitor research, backlinks, or keyword research, which remain SEO tool functions.
Pricing for Tableau starts with Tableau Public at $0 for public cloud publishing, Tableau Creator at $75 per user per month for full authoring, Tableau Explorer at $42 per user per month for governed self‑service, and Tableau Viewer at $15 per user per month for read‑only access.
This makes Tableau Public free for public dashboards and Tableau Viewer cheaper than the Whatagraph entry level, which starts at about $286/month, placing Tableau Viewer at $263 less for 1 user. The Creator tier in Tableau, however, exceeds the Whatagraph monthly cost when scaled widely, which reflects the enterprise scope of its feature set.
According to our Tableau review, the pros include advanced visual analytics, flexible data blending, and an intuitive drag‑and‑drop interface that accommodates non‑technical users.
Cons of Tableau are a steeper learning curve than Whatagraph, higher costs at scale for full authoring rights, and less immediate marketing‑specific automation. Tableau requires setup of connectors and security, while Whatagraph supplies pre‑configured marketing widgets.
24. Reportei: Best Whatagraph Alternative for Visual Client Reports (Brazil)
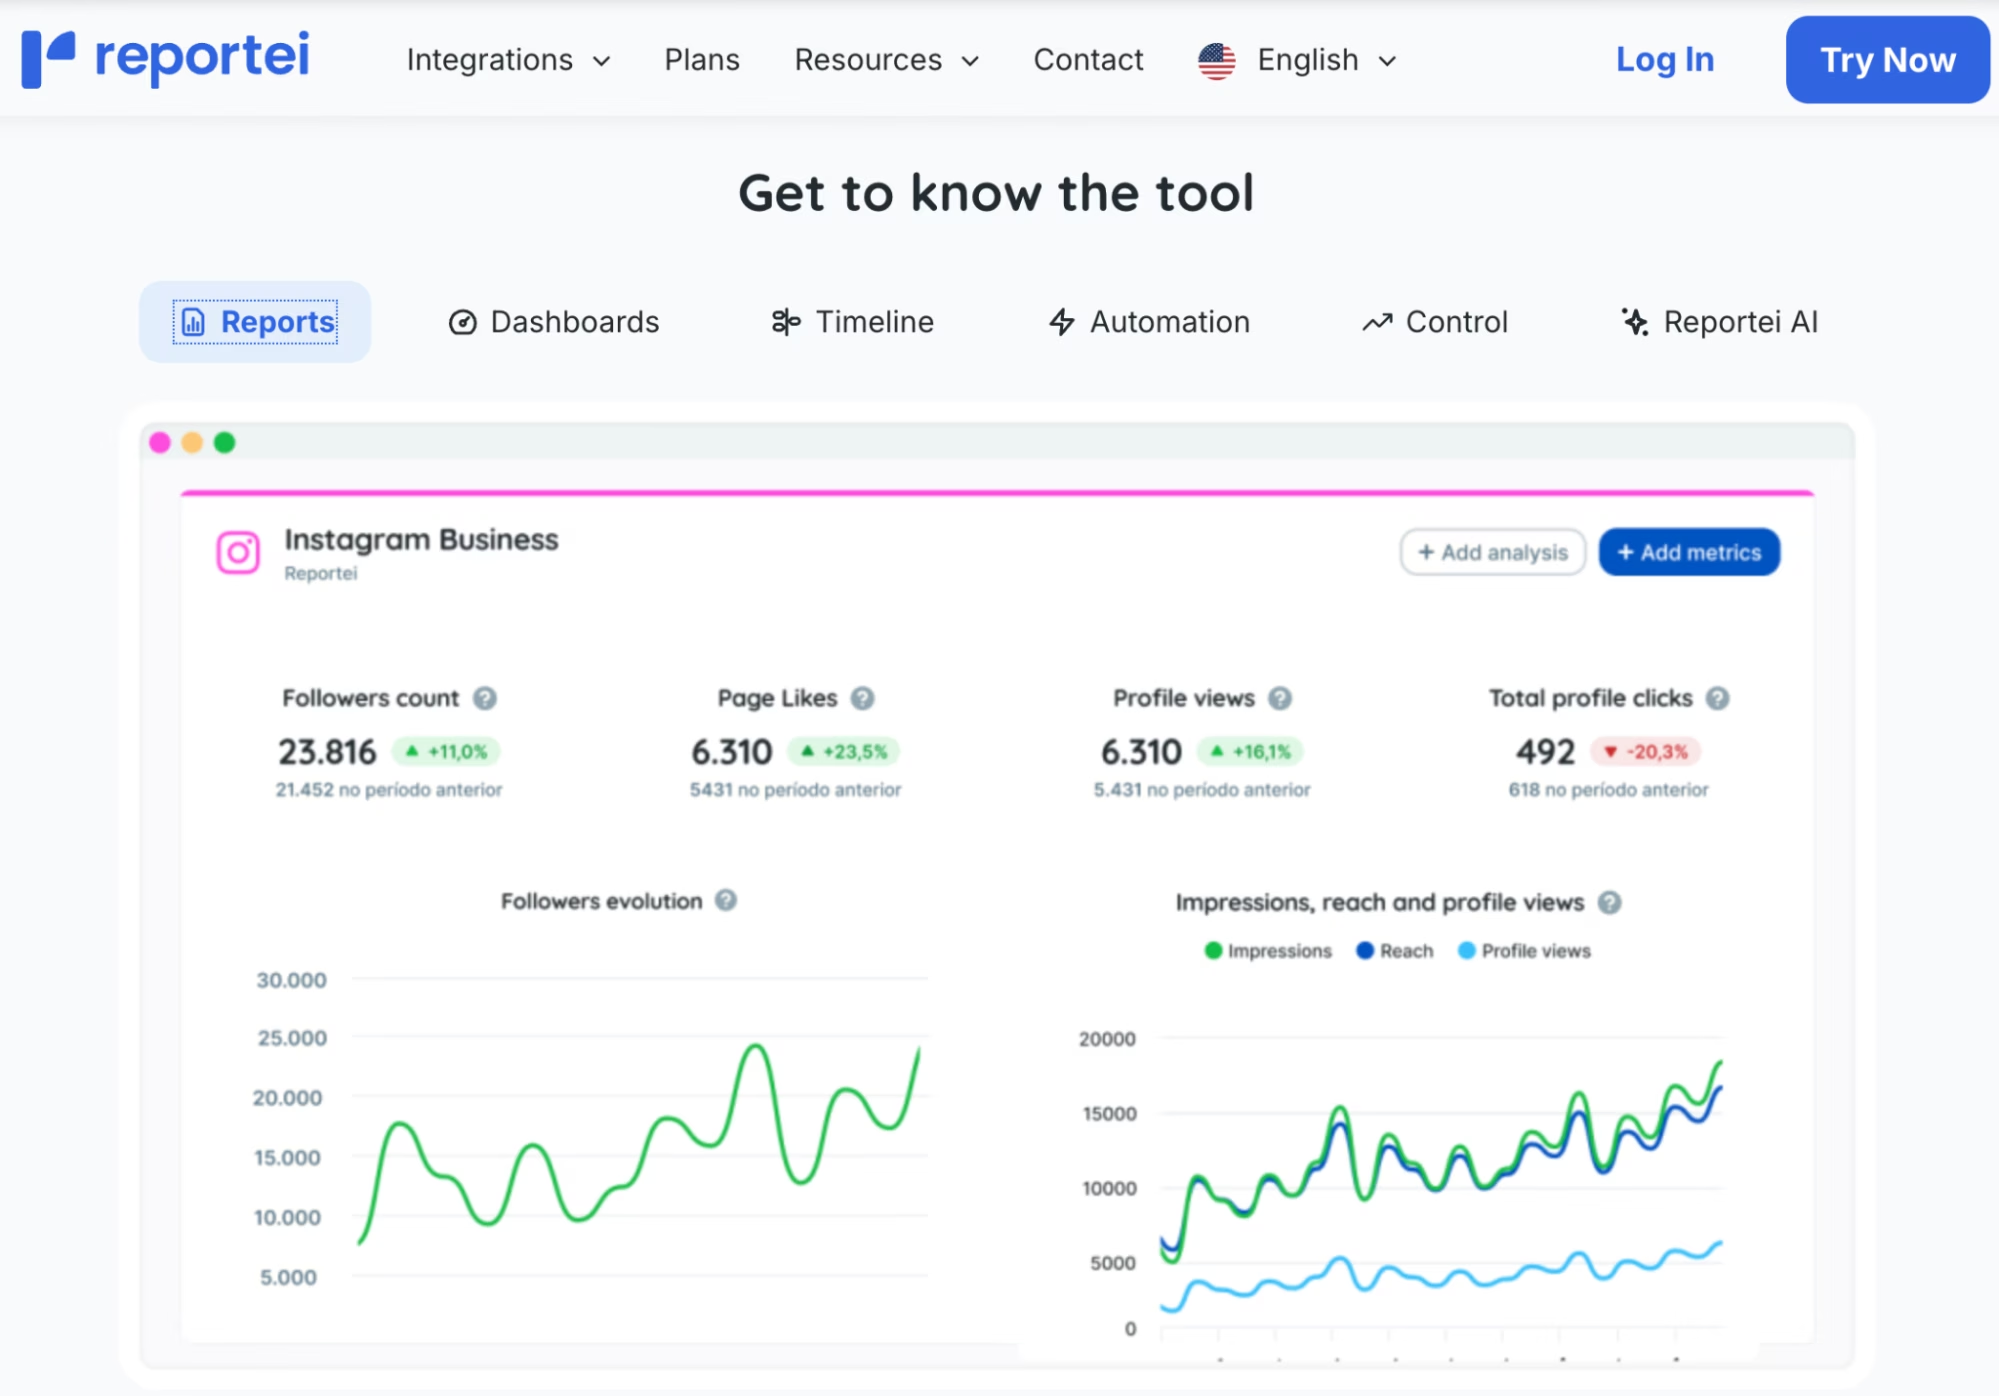
Reportei is the best Whatagraph alternative for visual client reports in Brazil with localized marketing analytics and Portuguese language support. Reportei is a reporting and dashboard platform that automates the communication between marketing professionals and their clients.
Reportei connects over 30 marketing and sales channels to generate branded visual reports, which improves transparency and client satisfaction in service-based workflows.
Reportei features include AI-generated insights, customizable dashboards, historical project timelines, and automated email delivery. Reportei integrates with Meta Ads, Instagram, Facebook, Google Ads, Google Analytics 4 (GA4), LinkedIn, TikTok, YouTube, Google My Business, Search Console, Mailchimp, HubSpot, Hotmart, RD Station, and Pipedrive.
Reportei AI provides assistance tailored to traffic management and Instagram optimization, while the Timeline function tracks campaign events with date-stamped story blocks. Automation includes report scheduling by frequency and channel, while Reportei Control monitors budgets and triggers performance alerts.
Reportei is an alternative to Whatagraph for agencies, e-commerce brands, and freelancers who prioritize fast, client-ready reports over advanced analysis or SEO tools. Compared to Whatagraph, Reportei is the better alternative for social and paid media dashboards, project documentation, and client presentations.
Whatagraph includes more template options for cross-channel reporting than Reportei, but lacks Timeline and localized support for LATAM (Latin America) agencies.
Pricing for Reportei starts at $29/month for 5 reports and dashboards, with additional plans at $45 and $89/month based on the number of brands and users. Whatagraph pricing begins around $286/month, which makes Reportei around 10 times cheaper for small teams or solo consultants.
The benefits listed in the Reportei review include fast setup, client-friendly visuals, and unique features such as the project Timeline and localized interface for Portuguese-speaking users. Reportei enables fast insight delivery with minimal manual input, which boosts analyst productivity.
The downsides of Reportei include limited deep SEO analysis, keyword metrics, and competitive benchmarking. Reportei does not offer advanced search data or technical site audits, which restricts its use beyond social and performance reporting.
Reportei is the best Whatagraph alternative for visual client reports in LATAM, since it offers faster delivery, unique timeline tracking, and lower monthly costs.
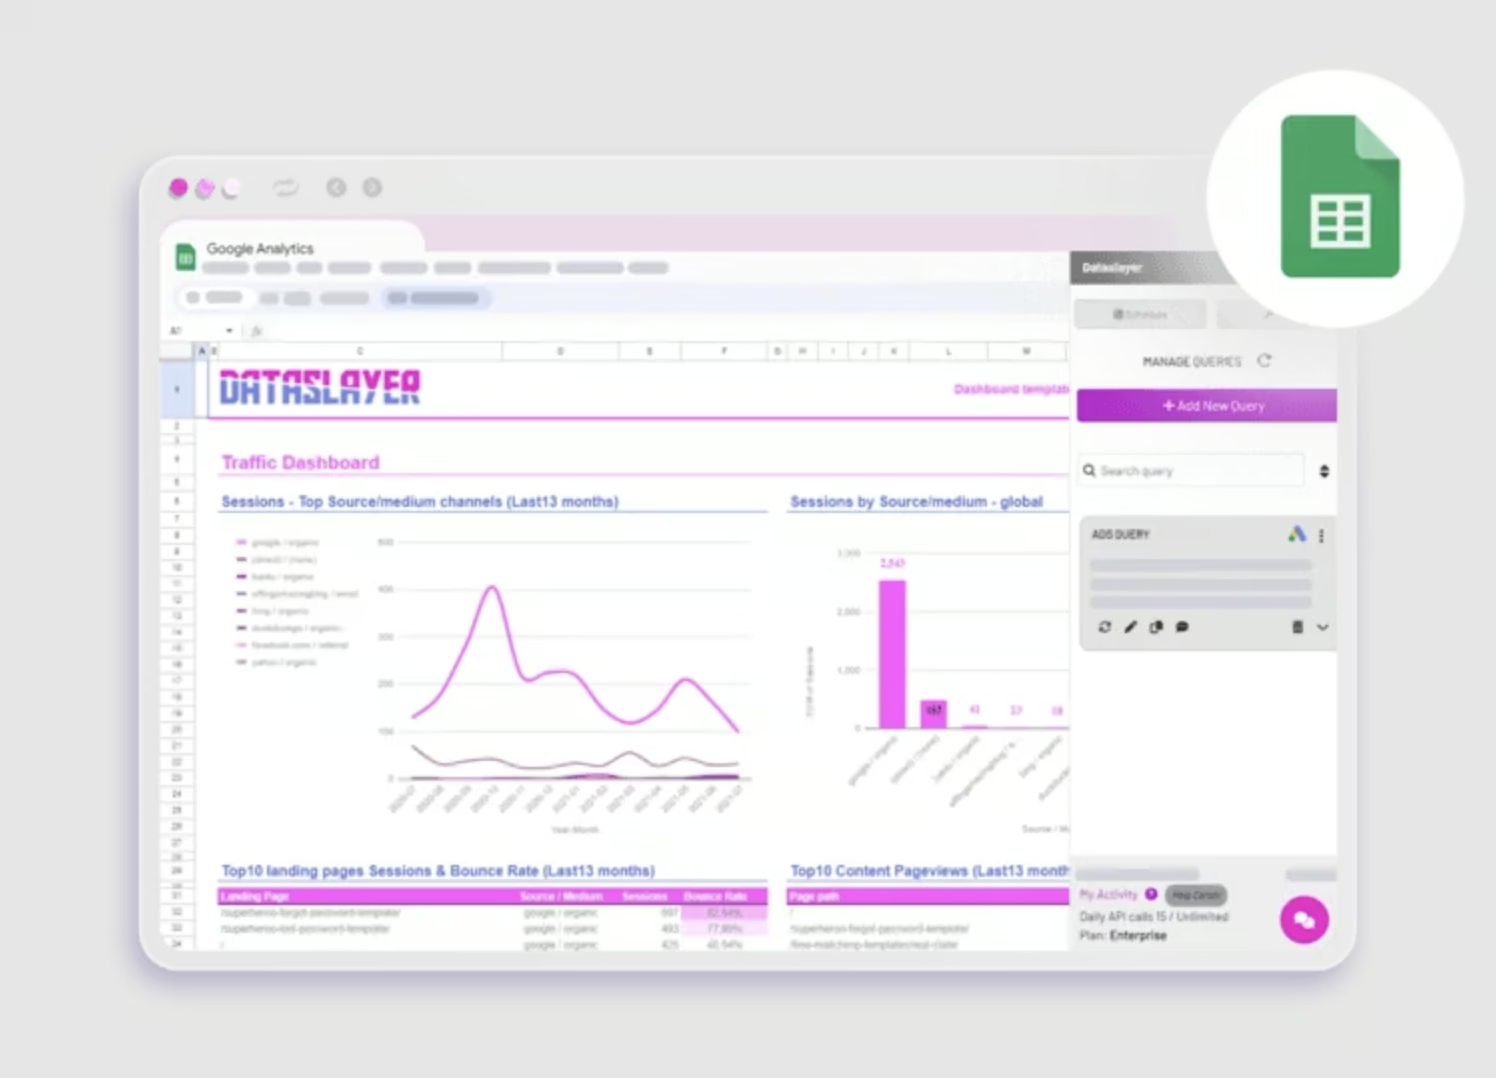
25. Dataslayer: Best Whatagraph Alternative for Automated Sheet Reporting
Dataslayer is the best Whatagraph alternative for automated sheet reporting with modular pricing and direct integration with spreadsheet tools. Dataslayer refers to a marketing reporting platform that pulls campaign data into Google Sheets, BigQuery, and Looker Studio without manual work or coding.
The key attribute of Dataslayer is its raw data control across flexible reporting modules. This matters for marketers who prioritize spreadsheet automation over visual storytelling.
Dataslayer offers over 40 connectors across paid media, SEO, CRM, and analytics platforms. Dataslayer integrates with Google Ads, GA4, Google Search Console, Meta Ads, LinkedIn Ads, TikTok Ads, YouTube Analytics, Pinterest Ads, HubSpot, Salesforce, and others. Each data source imports metrics directly into customizable sheets.
Dataslayer features include auto-refresh scheduling, unlimited historical data pulls, custom query builders, and options for warehouse destinations. Users configure reports by selecting fields, filters, and timeframes. Dashboards built in Looker Studio use Dataslayer queries as input. SQL users access BigQuery sync for deeper modeling.
Dataslayer is an alternative to Whatagraph for marketers who need raw, editable campaign data inside spreadsheets and BI tools. Whatagraph provides branded reports with locked visual layouts, while Dataslayer gives complete data ownership inside sheets. This enables more flexible analysis for advanced reporting workflows.
Dataslayer uses modular pricing based on product type (Google Sheets, Looker Studio, BigQuery), data sources, and users. Sheets-only plans start at $59/month for 10 sources and 1 user. Looker Studio-only plans start at $29/month. Combined packages cost $79/month and up. Pricing scales based on how many connectors or users are added.
According to the Dataslayer review, the benefits include unlimited spreadsheet queries, real-time automation, and native BigQuery support. Marketing teams use Dataslayer to centralize analytics across platforms, sync data with existing BI workflows, and eliminate copy-paste reporting.
Dataslayer limitations include a lack of white-labeled client dashboards, limited template libraries, and no branded design customization. Unlike Whatagraph, Dataslayer does not focus on visual aesthetics or ready-made reports for agencies.
Dataslayer is the best Whatagraph alternative for teams that build custom reports in Sheets, require SQL compatibility, and need flexible data control with modular pricing.
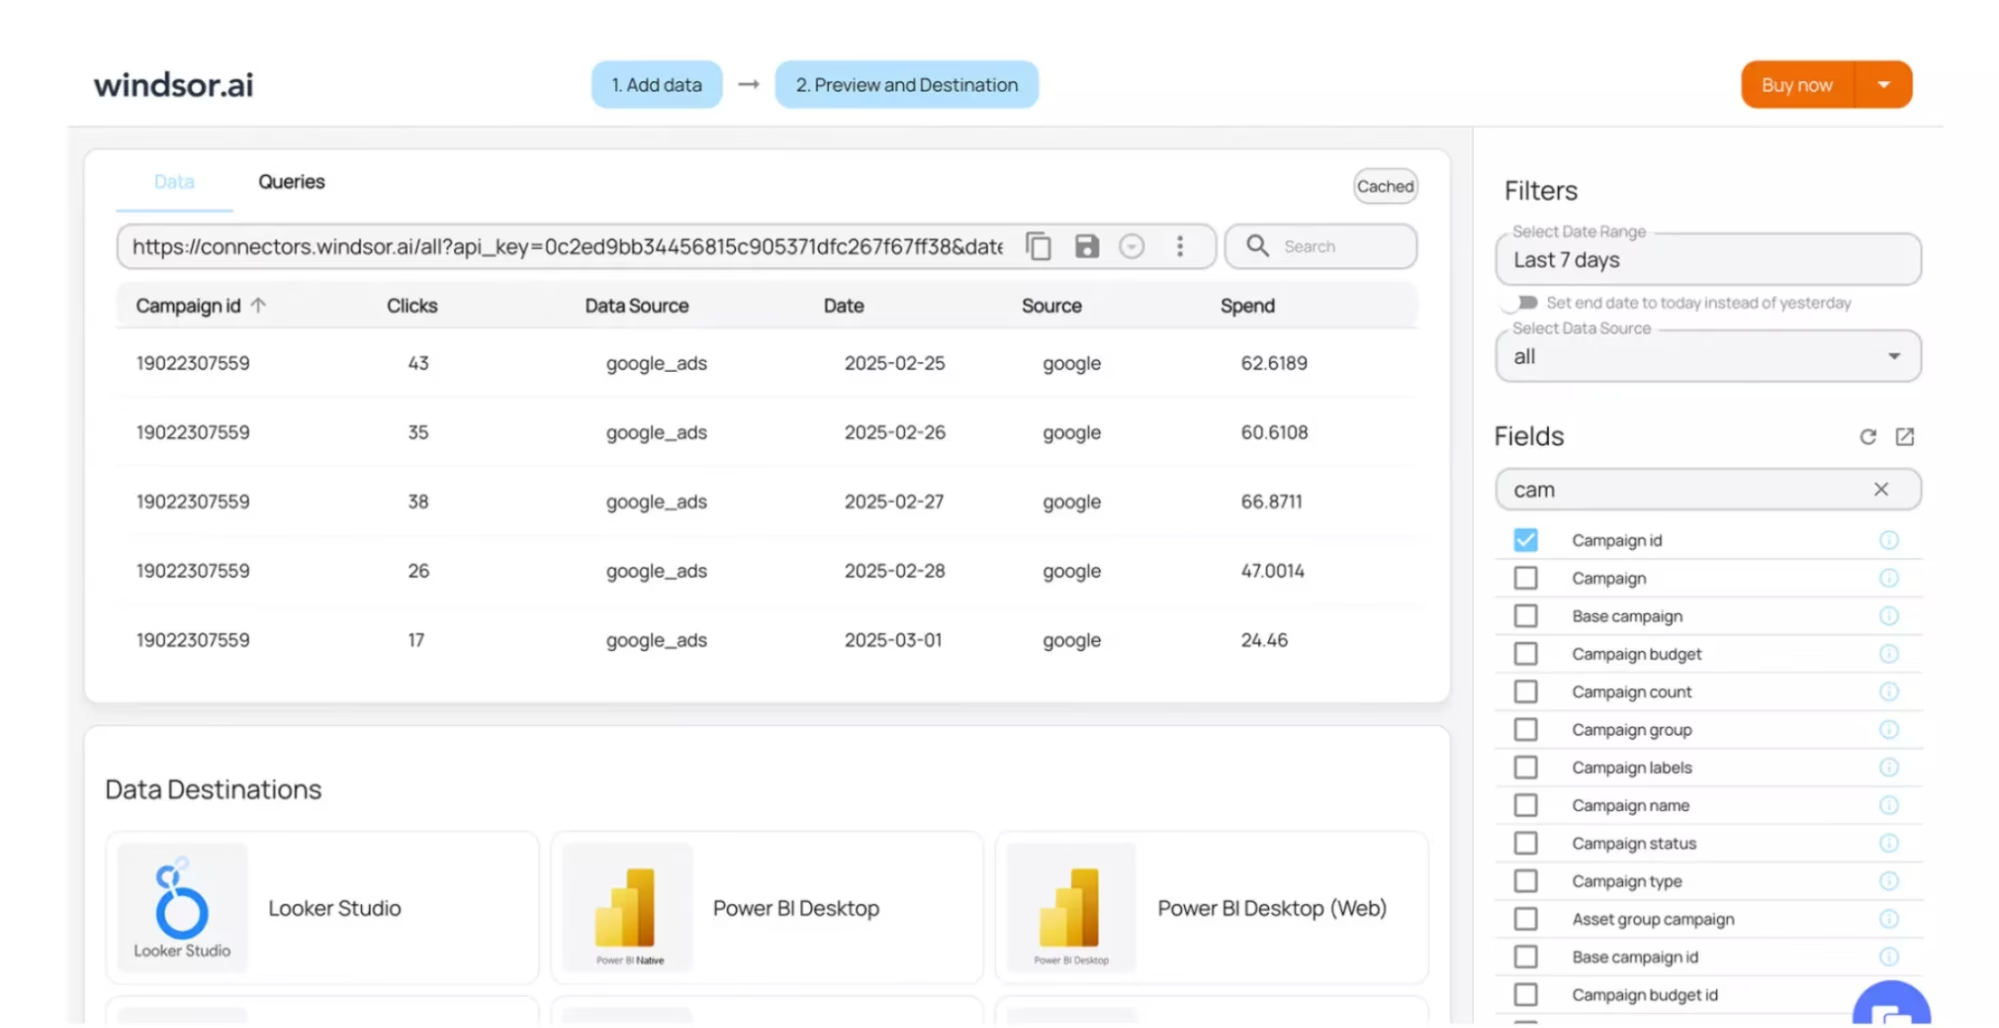
26. Windsor.ai: Best Whatagraph Alternative for Affordable Marketing ETL
Windsor.ai is the best Whatagraph alternative for affordable marketing ETL with budget-friendly data pipeline creation and flexible destinations. Windsor.ai is a marketing data integration platform that connects advertising, analytics, and ecommerce platforms to destinations (Google Sheets, BigQuery, databases, BI tools) through automated ETL pipelines at lower price points than enterprise alternatives.
Windsor.ai provides cost-effective data consolidation that competes with Whatagraph in the small to mid-sized business market.
Windsor.ai simplifies how teams collect, transform, and push data into business intelligence tools. Marketers gain clarity over ROI across every campaign, while data teams reduce manual prep and maintenance.
With flexible connector options and free templates, Windsor facilitates fast onboarding and easy integration into existing workflows.
Windsor.ai offers unlimited destinations, external authentication, and full user access across all plans. The Free plan provides 1 source and 1 destination with daily syncs. The Basic plan costs $23/month and offers 3 sources and 5 destination tasks. The Standard plan costs $118/month and includes hourly syncs, 7 sources, and 75 accounts. The Plus plan costs $299/month, while the Professional plan adds 14 sources, 15-minute syncs, and 50M monthly rows for $598/month.
Windsor.ai is $265 cheaper than Whatagraph at the entry point.
The pros mentioned in the Windsor.ai review include responsive customer support, ease of use in setting up integrations, and seamless multi‑platform connector breadth. Reviewers frequently praise how quickly the tool integrates ad platforms with BI tools and how support helps users with setup.
The cons of Windsor.ai are a steep learning curve for non‑technical users, missing features in certain plans, and interface limitations under heavy load or large data use. Users cite slowness on mobile or in large datasets and UX challenges for beginners as drawbacks
27. Grow.com: Best Whatagraph Alternative for Business Intelligence
Grow.com is the best Whatagraph alternative for business intelligence (BI) dashboards focused on executive reporting, unified data access, and no-code exploration across teams. Grow.com refers to a full-stack BI platform that enables companies to connect, transform, and visualize their business data without SQL or engineering support.
The key attribute of Grow.com is its no-code data pipeline, which bridges technical analytics and team-wide accessibility. Marketing, sales, and finance departments are able to independently generate live dashboards and uncover performance insights without relying on analysts or developers.
Grow.com offers 150+ integrations, including Salesforce, QuickBooks, Google Analytics, HubSpot, and PostgreSQL. Grow.com enables business users to prep, blend, and explore data within the platform, then build visual dashboards and automated alerts.
Grow.com competes with Whatagraph on internal business analytics, not SEO or campaign-level insights. Compared to Whatagraph, Grow.com is a better alternative for KPI dashboards, executive summaries, and real-time database connections.
Grow.com does not publish public pricing, but reviews confirm modular quotes based on usage and scale. Whatagraph pricing starts at $286/month, while Grow caters to many mid-market teams at lower contract costs when dashboards do not require large marketing datasets.
Grow.com is not a cheaper Whatagraph alternative by default, but cost-competitive plans exist for teams focused on revenue, sales, or product analytics.
The advantages highlighted in the Grow.com review are intuitive dashboard creation, unified data visibility, and scalability across teams without technical barriers.
The disadvantages of Grow.com are limited campaign-level templates, slower onboarding without data specialists, and a steeper learning curve when connecting complex CRM systems.
28. Better Reports: Best Whatagraph Alternative for Shopify
Better Reports is the best Whatagraph alternative for Shopify brands that need transactional reporting, inventory monitoring, and subscription tracking inside a flexible visual builder. Better Reports refers to a plug-and-play analytics platform that connects with Shopify and other ecommerce tools to provide real-time data analysis.
The key attribute of Better Reports is its Shopify-native connector, which unlocks sales, product, customer, and inventory data without code. Ecommerce managers generate custom reports directly from Shopify, export to CSV or PDF, and automate delivery without using a full BI suite.
Better Reports provides 20+ connectors, like Stripe, Xero, QuickBooks, Help Scout, and SendGrid, but it stands out for its Shopify-first architecture. Teams create visual dashboards, drill into product-level data, or schedule recurring reports to team inboxes or Google Sheets.
Compared to Whatagraph, which focuses on aggregated marketing data and campaign performance, Better Reports concentrates on revenue intelligence, product-level analysis, and operational reporting across ecommerce workflows. Shopify sellers benefit most when they need flexible, real-time dashboards directly tied to store activity.
Pricing for Better Reports varies by connector and transaction volume. Shopify-specific plans start at $19.90/month for Basic stores and reach up to $299.90 for Shopify Plus plans. Stripe-based pricing begins at $29.90/month for accounts with fewer than 500 transactions and scales based on usage volume.
Other connectors, such as QuickBooks or Help Scout, follow similar modular pricing rules. Compared to the flat rate Whatagraph offers, Better Reports costs up to 10 times less, depending on app usage and store tier.
The pros mentioned in the Better Reports review include deep Shopify capabilities, fast visual reporting, and responsive technical assistance.
The cons of Better Reports are limited capabilities for marketing attribution and higher costs for enterprise accounts with multiple connectors and large data volumes.
Better Reports is the best Whatagraph alternative for ecommerce brands that require store-level visibility, financial segmentation, and connector-specific pricing flexibility.
29. Wrike: Best Whatagraph Alternative for Dynamic Timelines
Wrike is the best Whatagraph alternative for dynamic project timelines that require real-time task updates and visual Gantt charts. Wrike is not a direct Whatagraph replacement, since it lacks native marketing data connectors or automated channel reporting.
Wrike refers to a collaborative work management platform that facilitates cross-functional team coordination.
According to our Wrike review, its key attribute is timeline-driven project mapping, which matters when managing sequential campaign workflows. Wrike allows agencies and marketing departments to monitor asset production, approval cycles, and team capacity using interactive charts and status updates.
Wrike pricing includes a modular subscription model based on team size, feature needs, and automation depth. Wrike offers 5 plans, which include Free ($0/user/month), Team ($10/user/month), Business ($25/user/month), Enterprise (custom), and Pinnacle (custom), each billed annually.
Wrike plans scale by user count and platform capabilities, such as access to custom dashboards, automation engines, and enterprise security. Add-ons like Wrike Integrate, Two-Way Sync, and Datahub increase the total cost based on usage. Wrike does not publish prices for the highest tiers or add-ons, which limits upfront cost visibility.
The pros of Wrike include robust task automation, customizable workflows, and strong integration options. The cons of Wrike are steep learning curves for new users and rising costs when scaling teams or adding premium modules.
Compared to Whatagraph, Wrike is a better alternative for campaign planning and operational execution visibility across departments.
30. Smartsheet: Best Whatagraph Alternative for Work Management
Smartsheet is the best Whatagraph alternative for work management. Smartsheet is a collaborative work management platform that combines project tracking, automation, and enterprise-level data governance.
Although it is not a marketing analytics tool like Whatagraph, Smartsheet enables teams to manage portfolios, automate reporting, and centralize data flows across departments and tools.
Smartsheet offers project visibility and operational alignment through customizable sheets, Gantt views, resource tracking, and real-time dashboards. Premium modules like Control Center, Data Shuttle, and Dynamic View allow teams to standardize reporting frameworks and reduce manual updates across large portfolios.
Smartsheet pricing starts at $12/user/month for Pro, $24 for Business, and custom rates for Enterprise and Advanced Work Management tiers. Add-on pricing varies by connector and module, such as Data Shuttle ($100/month) or Dynamic View ($125/month).
Our Smartsheet review shows that the tool excels at task management and automated reporting but lacks native marketing integrations and pre-built analytics templates.
Compared to Whatagraph, Smartsheet prioritizes operational efficiency and portfolio execution over campaign visualization and client-facing insights.
31. Jira: Best Whatagraph Alternative for Tracking Tasks
Jira is the best Whatagraph alternative for structured task tracking, backlog management, and agile sprint planning. Jira is not a direct Whatagraph replacement, since it does not include native marketing data connectors or automated cross-channel reporting.
Jira refers to a work management and issue tracking platform used to plan, assign, and monitor tasks across software and business teams. Its key attribute is project-level control of task hierarchies, which matters for technical SEO, website maintenance, and structured marketing campaigns.
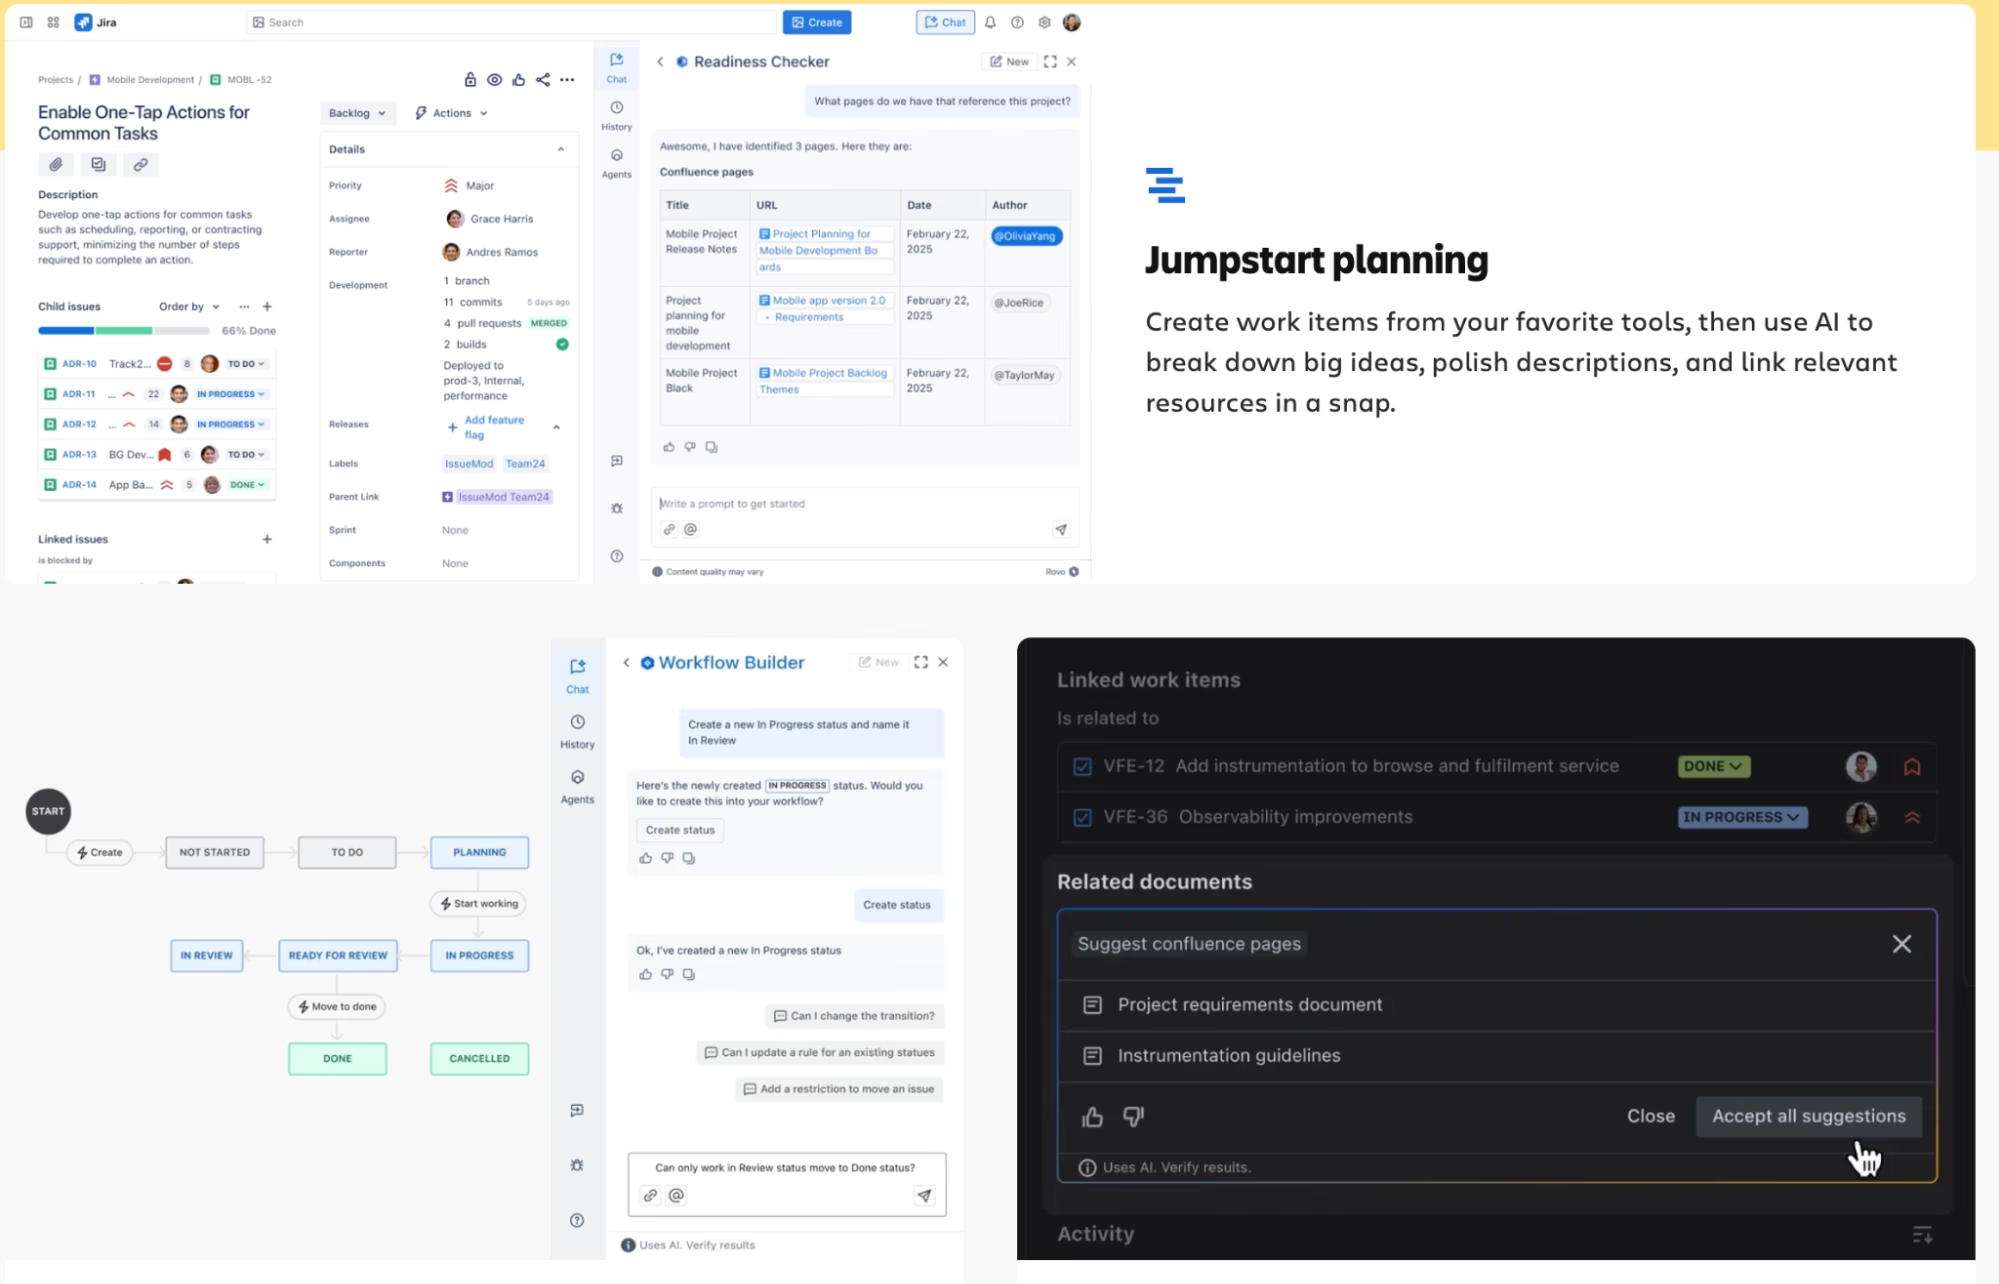
Jira allows teams to manage work through customizable boards, timelines, and dependency maps with detailed user permissions and automation rules.
Jira pricing is based on user volume and deployment complexity. The Free plan allows up to 10 users at $0/month. Standard costs $7.53/user/month, Premium is $13.53/user/month, and Enterprise is custom-priced with advanced security, unlimited automations, and analytics.
The pros mentioned in the Jira review include scalable user access, automation triggers, and integration with tools like Confluence, Slack, and Bitbucket. The cons of Jira are steep learning curves for non-technical users and limited use outside of engineering-style workflows.
Compared to Whatagraph, Jira is a better alternative for operational project management, recurring SEO tasks, and structured campaign execution in cross-functional teams.
32. Quire: Best Whatagraph Alternative for Team Collaboration
Quire is the best Whatagraph alternative for team collaboration on task planning and lightweight project tracking. Quire is not a direct Whatagraph replacement, because it lacks built-in marketing connectors, automated metrics pipelines, or reporting dashboards.
Quire refers to a minimalist productivity tool that enables nested to-dos, kanban boards, timelines, and shared folders across teams. Its key attribute is intuitive hierarchical tasks for organizing marketing campaigns, content workflows, or small cross-functional projects. Quire lets teams break down complex plans into actionable steps, assign ownership, and track progress without heavy process overhead.
Quire pricing is user-based with 4 tiers, including Free ($0/user), Professional ($10.95/user), Premium ($18.95/user), and Enterprise ($24.95/user), billed monthly or annually. Features scale across plans based on view types, collaboration depth, data limits, and integrations, with premium tiers unlocking approvals, master org management, custom email routing, and enterprise-level security.
The pros mentioned in the Quire review include clean nested task structure, ease of use, real-time collaboration without clutter, and integration readiness. The cons of Quire are limited reporting features, no native analytics or dashboards, and scaling constraints for larger agency workflows.
Compared to Whatagraph, Quire is the better alternative for organizing execution, content planning, and task collaboration, while Whatagraph remains stronger for client-facing dashboards, performance visualization, and automated marketing reports.
33. Asana: Best Whatagraph Alternative for Organizing Tasks
Asana is the best Whatagraph alternative for organizing internal projects and coordinating task workflows across marketing, product, and operations teams. Asana is not a direct Whatagraph replacement because it lacks native marketing integrations, pre-built reporting templates, and multi-source performance visualizations.
Asana refers to a cloud-based work management platform that enables task assignments, team timelines, portfolio dashboards, and AI-enhanced workflows.
The key attribute of Asana is scalable task orchestration, which matters when cross-functional teams must coordinate deadlines, roles, and dependencies across projects.
Users rely on Asana to break down large initiatives into trackable actions, automate handoffs, and streamline approvals without losing operational visibility.
Asana pricing includes five tiers: Personal (free for up to 10 users), Starter ($10.99/user/month billed annually), Advanced ($24.99/user/month), Enterprise (custom), and Enterprise+ (custom). Plans scale based on team size, AI usage, security policies, compliance features, and integrations with tools like Salesforce, Power BI, and Tableau.
The advantages highlighted in the Asana review include multi-view project navigation, advanced automations, and native AI workflows for streamlining task management.
The cons of Asana are a lack of real-time campaign metrics, no built-in data visualization from marketing sources, and high cost for advanced security and compliance layers.
Compared to Whatagraph, Asana excels at structuring internal marketing operations and campaign execution, while Whatagraph manages reporting workflows and external client deliverables.
34. IBM SPSS Statistics: Best Whatagraph Alternative for Advanced Statistical Analysis
IBM SPSS Statistics is the best Whatagraph alternative for conducting deep statistical research, predictive modeling, and advanced data exploration across academic and enterprise environments. IBM SPSS is not a direct Whatagraph replacement, since it does not provide automated marketing data integrations or client-facing report visualizations.
IBM SPSS Statistics refers to a statistical software platform built for hypothesis testing, regression analysis, machine learning, and structured data modeling.
According to our IBM SPSS Statistics review, its key attribute is its flexible statistical engine, which matters when marketing teams or data analysts need to test assumptions, forecast trends, and extract insights from structured datasets.
Users rely on SPSS to analyze large-scale survey data, build predictive models, and apply advanced statistical methods without requiring code.
IBM SPSS pricing includes both subscription-based and perpetual license options. Pricing for SPSS Statistics ranges from $99/month for individuals to multi-thousand-dollar enterprise licenses based on user count, deployment method (cloud vs on-prem), and feature access. Additional modules for forecasting, decision trees, or text analytics raise the total cost substantially.
The pros of IBM SPSS include powerful statistical functions, robust modeling capabilities, and enterprise-grade security controls. The cons of IBM SPSS are its steep learning curve for non-technical users, high cost for full-feature deployments, and lack of real-time marketing channel connectivity.
Why Do People Seek Alternatives to Whatagraph Tool?
People seek alternatives to Whatagraph because Whatagraph imposes high costs for full‑feature access, limits customization flexibility, and struggles with data reliability and connector stability. Users report that Whatagraph features lag in integration depth, real‑time refresh rates, and long-term trend retention.
Some Whatagraph reviews cite broken widgets during concurrent edits, errors in API syncs, and constraints on branding control as recurring frustrations. Many agencies migrate away when the pricing in Whatagrah escalates with added clients or data sources, and when they outgrow its architectural limits on scalability.
What to Look for in a Whatagraph Alternative?
A Whatagraph alternative needs to replace or extend the Whatagraph reporting platform by automating cross‑channel reporting, dashboard visualization, and data delivery. An ideal alternative to Whatagraph provides deep integrations with APIs and niche platforms, flexible report customization, and pricing structures that scale with usage.
You need integration breadth (built‑in connectors and API/CSV fallback), layout flexibility (draggable widgets, conditional logic, branded styling), and operational scalability (role controls, modular pricing, audit logs).
Check the quality of documentation, migration support, and data reliability before switching from Whatagraph to another platform.
What is the Difference Between Swydo vs Whatagraph?
The difference between Swydo vs Whatagraph is template simplicity versus customization depth.
Swydo offers pre-built report templates with drag-and-drop widgets optimized for fast implementation and automated PDF delivery. Whatagraph provides more extensive customization options, advanced data blending features, and interactive dashboards beyond static PDF reports.
The main distinction in Swydo vs Whatagraph is that Swydo accelerates report creation through template-driven workflows, while Whatagraph enables deeper customization and data manipulation for complex reporting requirements.
What is the Difference Between Whatagraph vs Databox?
The difference between Whatagraph vs Databox is comprehensive agency reporting versus mobile-first KPI monitoring.
Whatagraph specializes in detailed client reporting with extensive data source integration, white-label branding, and sophisticated data blending for agency workflows. Databox focuses on real-time KPI tracking through mobile apps, Slack notifications, and goal monitoring for internal team performance.
The main difference between Whatagraph vs Databox is that Whatagraph delivers client-ready reports with a polished design, while Databox provides instant performance visibility for business owners monitoring key metrics throughout the day.
What is the Difference Between Supermetrics vs Whatagraph?
The difference between Supermetrics vs Whatagraph is specialized data extraction versus integrated visualization.
Supermetrics operates as middleware that extracts marketing data and delivers it to destination tools (Looker Studio, Excel, Power BI, data warehouses) without providing native dashboards. Whatagraph combines data extraction with dashboard creation in an all-in-one platform where users connect sources, transform data, and build visualizations in one interface.
What distinguishes Supermetrics vs Whatagraph is that Supermetrics requires pairing with separate visualization tools, while Whatagraph delivers complete reporting solutions without additional software dependencies.
What is the Difference Between AgencyAnalytics vs Whatagraph?
The difference between AgencyAnalytics vs Whatagraph is an all-in-one agency tool versus specialized data visualization.
AgencyAnalytics provides comprehensive agency management features, including client reporting plus rank tracking, uptime monitoring, call tracking, and SEO audit tools in one subscription. Whatagraph focuses specifically on cross-channel data visualization and reporting without broader agency management capabilities.
The main distinction in AgencyAnalytics vs Whatagraph is that AgencyAnalytics consolidates multiple agency tools (reporting, tracking, monitoring) into one platform, while Whatagraph specializes exclusively in creating polished marketing dashboards and reports.
Why is Search Atlas the Best Whatagraph Alternative?
Search Atlas is the best Whatagraph alternative because it replaces fragmented reporting stacks with a unified platform that automates reporting, SEO optimization, and technical execution for 2025.
Search Atlas includes AI-powered report generation, daily rank tracking, white-label dashboards, technical audits, backlink analysis, and local SEO heatmaps under one plan with no per-connector fees. Whatagraph focuses on marketing analytics and visualization, but it lacks native SEO tools and offers limited insight into site performance or ranking factors.
Agencies choose Search Atlas because it merges GSC, GA4, and GBP data with SERP position tracking, AI summaries, and branded PDFs in a centralized dashboard. Whatagraph requires users to rely on third-party SEO tools, whereas Search Atlas includes schema validation, link tracking, and on-page issue detection as part of the workflow.
User reviews confirm that Search Atlas reduces tool switching, cuts manual labor, and improves visibility across every SEO touchpoint. The only adjustment is onboarding teams to its wider feature set, but its automation, integrations, and report builder offer significantly more long-term value than the analytics-only model in Whatagraph.
Start a free 7-day trial with Search Atlas to see how it transforms fragmented reporting into scalable, AI-automated SEO operations that Whatagraph cannot handle.

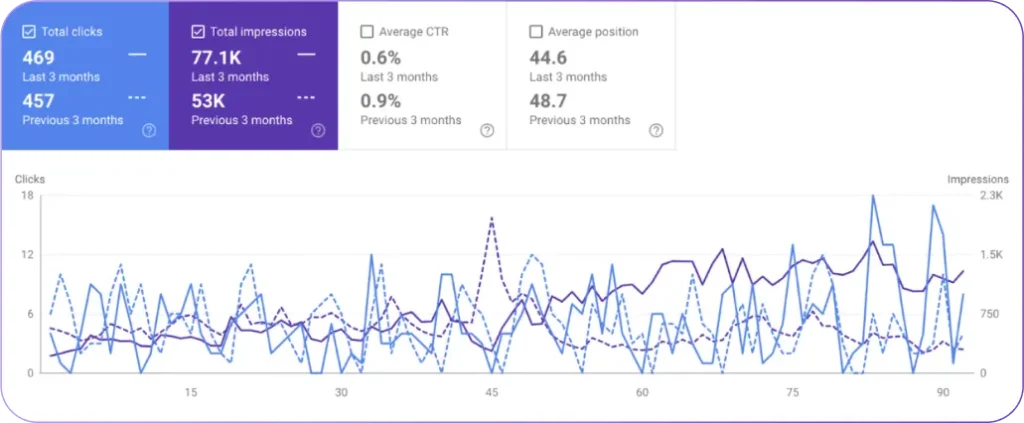
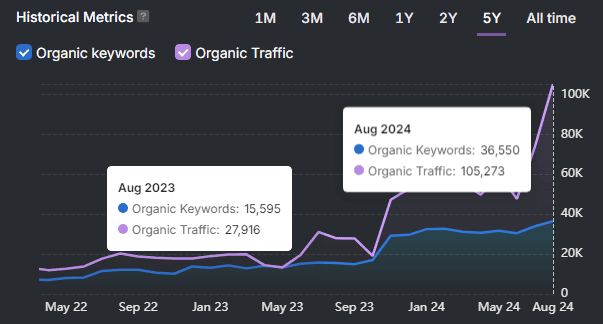
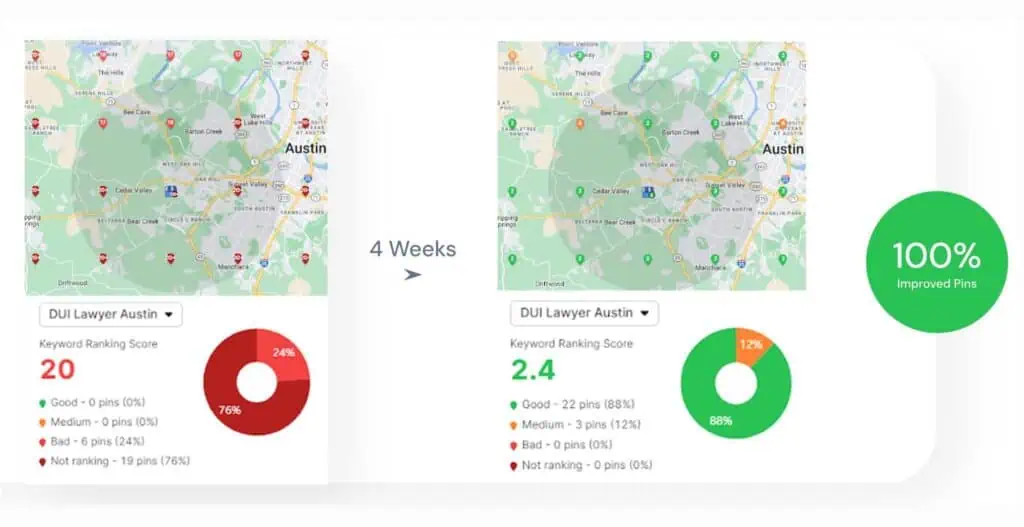
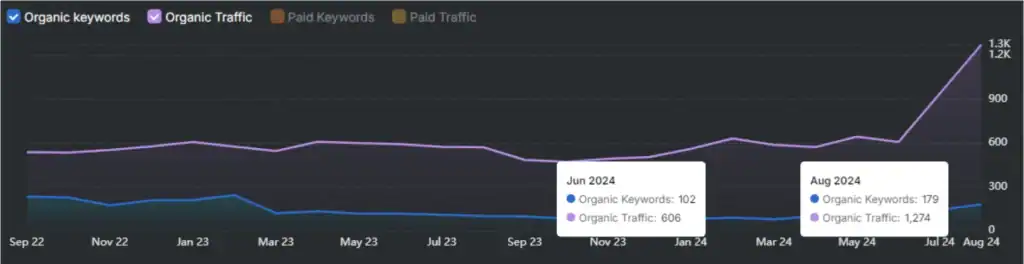