

Checking Google Ads Auction Insights can be frustrating when competitors outrank you, and you’re unsure how to respond. Seeing their ads dominate while yours struggle for visibility makes it feel like you’re always playing catch-up.
But with the right approach, this data can become a powerful tool. 🧰
This article explains how to read Auction Insights, uncover opportunities, adjust bidding strategies, and use PPC Research Tools to help.
What is the Google Ads Auction Insights report?
Auction Insights is a built-in report within Google Ads that reveals how your ads compare to others competing for the same keywords. It applies to both search and shopping campaigns and can be accessed at the account, campaign, or ad group level.
While Google doesn’t disclose the exact keywords others are targeting, a well-organized account structure can help you infer where competitors are focusing their budget.
This insight makes it easier to assess which areas of your campaigns are performing well and where adjustments could lead to better results.

Where to Find Auction Insights in Google Ads
Finding the Auction Insights report is simple, but where you access it depends on whether you want to analyze performance at the campaign, ad group, or keyword level.
Here’s what each shows you:
- Campaign Level: Best for a broad view of overall competition across all keywords in a campaign.
- Ad Group Level: Helps you evaluate competition for more targeted ad groups with similar themes.
- Keyword Level: The most precise way to see how competitors perform on individual keywords.
You can also export the report if you want to analyze it further in Excel or Google Sheets.
Once you’ve decided which level to analyze, here’s how to do access it step-by-step:
- Sign in to your Google Ads account.
- Click on “Campaigns,” “Ad Groups,” or “Keywords” in the left-hand menu.
- Select the specific campaign, ad group, or keyword you want to analyze.
- Click the “Auction Insights” button that appears above the table.
- Review the report to see how often your ads appear, where they rank, and how they stack up against competitors.
What You Get From the Auction Insights Report
Running Google Ads without checking Auction Insights is like driving blindfolded, you have no idea who else is on the road or how they’re moving.
This report gives you a behind-the-scenes look at the competitive landscape, showing exactly how your ads stack up against others bidding on the same keywords.
See Who You’re Competing Against
Auction Insights reveals which advertisers are showing up alongside you, but instead of vague industry trends, you get real data on actual competitors. You’ll see their domain name, so you know whether you’re up against familiar rivals or unexpected brands targeting the same audience.
If you want a clearer view of your competition, there are other tools you can use for more detailed PPC competitor research. 🕵️
Find Out Where You’re Winning (or Losing)
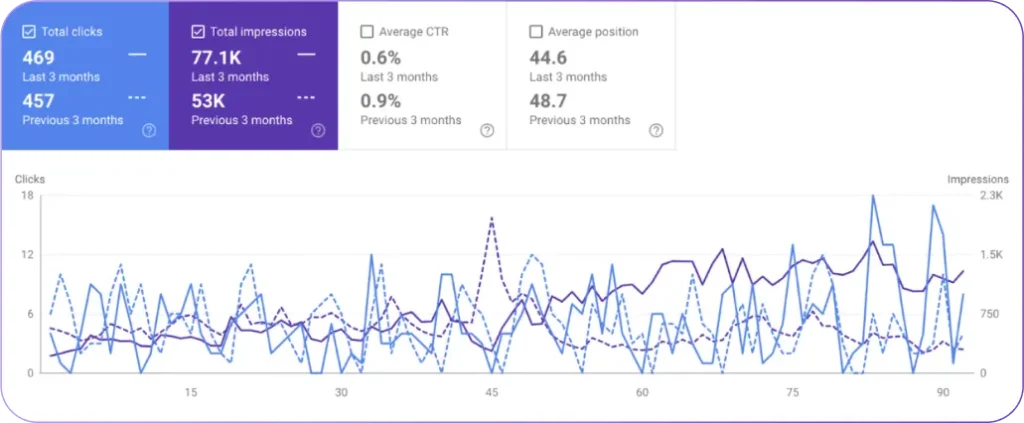
Instead of guessing how well your ads are performing, this report tells you how you compare to your direct competitors, how often you outrank them, and how much impressions your ad is seeing compared to how much it could have received.
If your impression share is low, competitors might be outbidding you, or your budget could be limiting visibility. If you’re outranking a key competitor consistently, you might have an edge you can further exploit.
Adjust Your Bidding and Budget Smarter
Auction Insights can highlight where your budget is making an impact, and where it’s not. If a competitor suddenly starts outranking you, they may have increased their bid or improved their ad quality.
You can respond by adjusting your strategy, raising bids for high-value keywords, refining ad copy, or improving landing pages to boost relevance.
Spot Market Trends and Shifts
Competition isn’t static. A new advertiser might enter the space, or a competitor could ramp up spending during a seasonal push. Regularly reviewing Auction Insights helps you stay aware of these shifts so you can adapt instead of reacting too late.
Also, AI for Google Ads is changing the way other advertisers approach their business. This means you need to be aware of all the PPC tools entering the market.
Make Data-Driven Decisions
Instead of guessing why performance changes, this report provides hard evidence. If you see a sudden drop in conversions, checking Auction Insights can tell you if competitors have increased their presence, helping you decide whether to adjust bids, improve ad relevance, or test different targeting strategies.
6 Key Metrics and How to Interpret Them
These six key metrics reveal how often your ads appear, how they rank, and where you can improve. Here’s what each one means.
1. Impression Share
Impression Share tells you how often your ads appear compared to how often they could have, based on your targeting and budget. Imagine putting your name on a guest list—just because you’re invited doesn’t mean you always get in.
Auction Insights also shows how often competitors’ ads appear. If one competitor has a 72% impression share, their ads showed up in 72% of relevant searches. If yours is much lower, they might be bidding higher, optimizing better, or allocating more budget.
A low impression share means fewer chances to reach potential customers. If performance is slipping, consider raising bids, improving ad relevance, or refining your campaign structure to compete more effectively.
2. Overlap Rate
Overlap Rate shows how often your ad appears alongside a competitor’s in the same auction. It’s like running a race and seeing the same runner next to you most of the time—you’re in direct competition for the same audience.
For example, if your Overlap Rate with a competitor is 40%, that means out of 100 searches where your ad showed up, theirs did too in 40 of them. A high Overlap Rate means you’re frequently bidding on the same keywords, which can drive up costs and impact visibility.
If one competitor keeps showing up next to you, study their approach. Check their ad copy, keywords, and bid strategy to find ways to stand out.
Another useful tip is to try and avoid direct competition with big brands. You can do this by excluding their branded keywords to focus on more strategic opportunities.
3. Position Above Rate (Search campaign only)
Position Above Rate shows how often a competitor’s ad shows up higher than yours when you’re both in the search results. It’s a percentage of the times your ad and theirs appear together, with theirs ranking above you.
This metric is specific to search campaigns and helps you understand how frequently competitors take the top spot over you. The higher this rate, the more often they’re getting prime visibility.
For example, if a competitor has a 30% Position Above Rate, that means their ad appears above yours in 3 out of every 10 searches. Since most users tend to click on higher-positioned ads more often, this metric can directly influence your conversions.
Finally, keep an eye on how changes in this rate affect your conversion rates over time. If your ad keeps falling below a competitor’s, it could be time to improve your Ad Rank.
4. Top of Page Rate (Search campaign only)
The Top of Page Rate shows you the percentage of times your ad appeared at the very top of the search results, right above the organic listings.
For example, if your Top of Page Rate is 40%, it means your ad was at the top 40 times out of every 100 impressions.
When you want to increase your chances of showing up at the top, you can optimize your keywords for higher relevance, include ad extensions, or improve your ad copy. This can be especially helpful during peak times, like the holidays, when competition is fierce.
5. Absolute Top of Page Rate (Search campaign only)
The Absolute Top of Page Rate takes things a step further. It tells you the percentage of times your ad appeared in the very first position above all other ads and organic results. This is the prime real estate of the search results, and if your ad lands here, it’s as good as it gets.
For example, if your Absolute Top of Page Rate is 15%, it means your ad appeared in the very first position 15 times out of every 100 impressions.
This metric is a clear indicator of how often you’re securing that top spot over your competitors. Ads in this position typically get the most attention and the highest click-through rates, so improving this rate can directly boost your campaign’s performance.
To increase your chances of appearing in the absolute top spot, go through a complete Google Ads optimization checklist and improve as many things as you can.
6. Outranking Share
Outranking Share tells you how often your ad appears above a competitor’s ad in the search results, or how often your ad shows when theirs doesn’t. It’s a useful metric to see how well you’re competing for visibility against specific advertisers.
For example, if your Outranking Share with a competitor is 50%, it means your ad appeared higher than theirs, or theirs didn’t show at all, 50 times out of every 100 auctions you both participated in.
This metric gives you a clear picture of your competitive standing, showing how often you’re able to outbid or outrank competitors in those valuable search results.
If your Outranking Share is low compared to a key competitor, it might be time to increase your bid or focus on improving your ad quality. By improving your ads’ relevance and performance, you can increase your chances of outranking competitors and securing better positions.
Tips for Improving Auction Insights Metrics
Improving your Auction Insights metrics isn’t just about spending more—it’s about making smarter decisions with your bids, ad relevance, and targeting. Small adjustments can help you compete more effectively without overspending.
Optimizing Bids and Budget Allocation
Raising bids makes sense when you see competitors consistently outranking you on high-value keywords that bring conversions. But increasing bids across the board isn’t the answer. Focus on keywords that drive results, not just those with high competition.
Also, keep an eye on Impression Share. 👀
If you’re missing out on visibility due to budget limitations, consider reallocating spend from low-performing campaigns. Avoid wasting money on broad, generic keywords that drain your budget without bringing in quality traffic.
Enhancing Ad Relevance and Quality Score
Your Quality Score is one of the first things you have to boost if you want your campaigns to thrive.
It includes improving ad copy with clear, compelling messaging that speaks to user intent and can increase engagement. Landing pages should also match ad content and load quickly to keep users from bouncing.
Finally, using ad extensions, like sitelinks and callouts, gives your ads more real estate on the search results page, making them more appealing and improving Click-Through Rates (CTR).
Targeting Smarter
Fine-tuning targeting helps you reach the right audience without overspending. Negative keywords prevent your ads from showing for irrelevant searches, cutting wasted spend. Adjusting match types, like using phrase or exact match instead of broad, gives you more control over which searches trigger your ads.
This ensures your budget goes toward searches that are more likely to convert, rather than clicks that lead nowhere.
What are Some Common Mistakes to Avoid?
Auction Insights provides valuable data, but misinterpreting it or focusing on the wrong areas can lead to poor decisions. Avoid these common mistakes to get the most out of the report.
Relying Too Much on a Single Metric
It’s easy to fixate on one number, like Impression Share or Position Above Rate, but no single metric tells the full story. A high Impression Share doesn’t always mean success if your CTR and conversions are low. Likewise, a lower ranking doesn’t necessarily hurt performance if your ads still attract the right audience.
Looking at multiple factors together—like CTR, conversion rates, and cost per acquisition—gives a clearer picture of what’s working and what needs adjustment.
Ignoring Seasonal or Industry Trends
Auction dynamics shift based on demand, holidays, and industry cycles. A sudden drop in Impression Share might not mean your competitors increased their budgets—it could be a seasonal surge affecting costs across the board.
Reviewing historical data and comparing performance over similar periods helps you identify trends instead of reacting to temporary fluctuations. If competition spikes during peak seasons, planning ahead with budget adjustments and strategic bidding can prevent unnecessary setbacks.
Overreacting to Competitor Activity
Seeing a competitor outrank you can be frustrating, but making hasty changes isn’t always the best move. If their bids are aggressive, they might be overspending rather than running a sustainable strategy. Instead of chasing rankings, focus on maintaining profitability.
Monitor trends over time and adjust your approach only when data shows a consistent impact on conversions and return on ad spend.
How to Improve Your Success in Auctions with AI?
If you’re struggling to make sense of Google Ads Auction Insights, and improve your campaign, you can now rely on AI to do it for you.
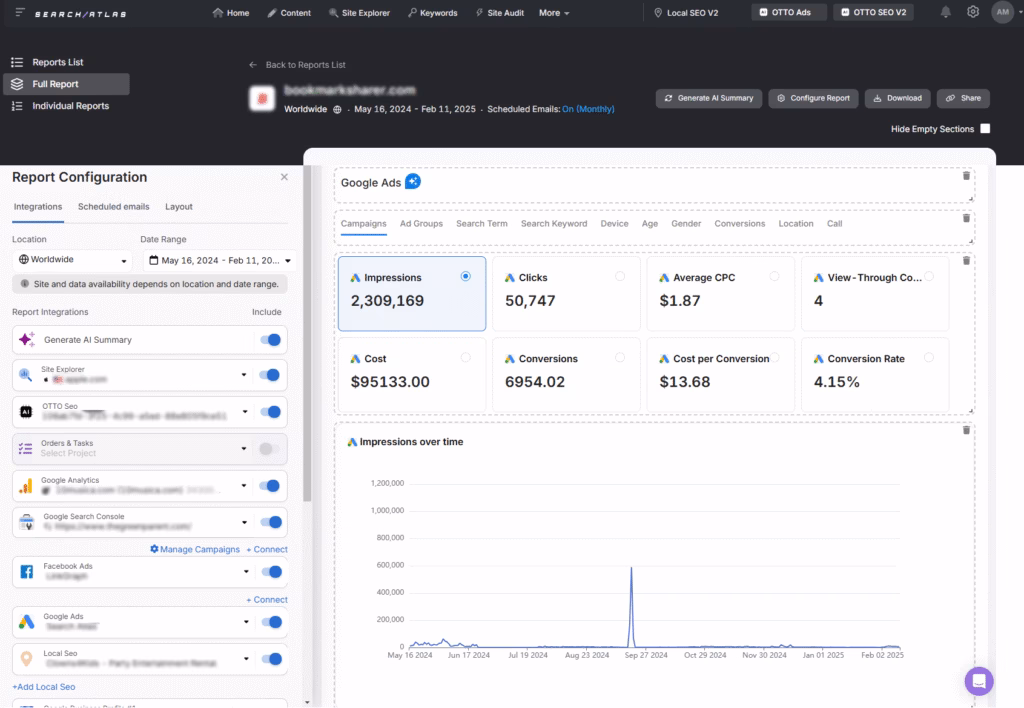
Our AI Assistant OTTO Google Ads tracks KPIs like conversion rates, cost per conversion, and clicks while also pulling in SEO, Facebook Ads, and Google Business Profile data for a full marketing overview.
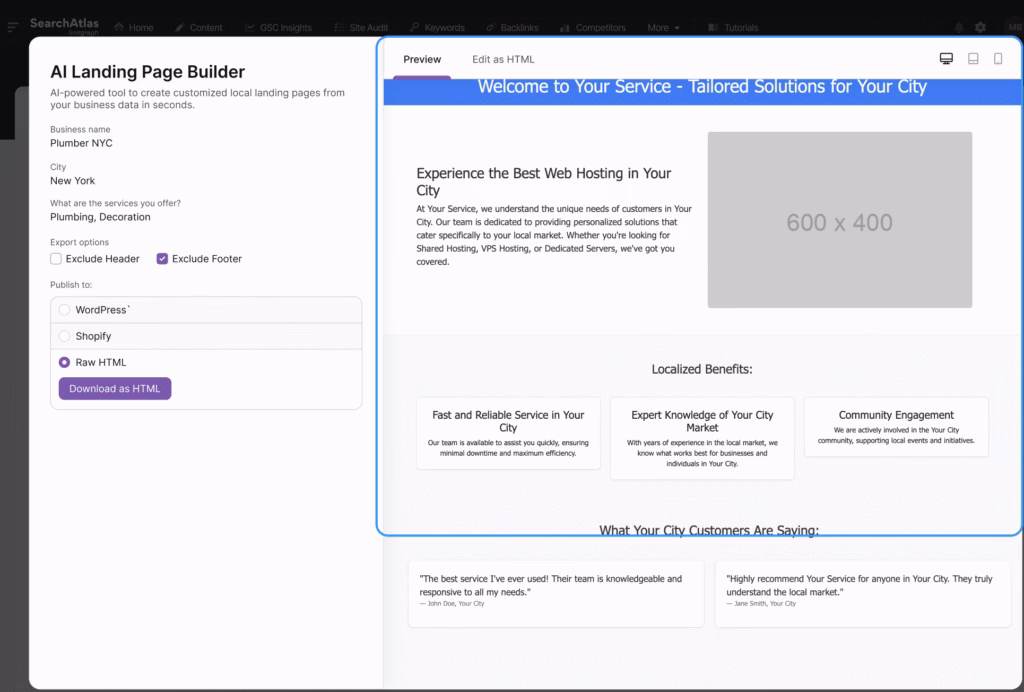
It also automates your entire campaign creation process, from start to finish:
- AI-Powered Campaign Creation: Builds structured, ready-to-launch campaigns in minutes.
- Smart Keyword Selection: Targets high-performing keywords for better reach.
- Optimized Ad Copy: Generates compelling, conversion-focused messaging.
- Google Ads Extensions: Enhances ads with sitelinks, callouts, and structured snippets.
- Real-Time Tracking and Optimization: Continuously analyzes performance and refines campaigns for better ROI.
It also includes an AI Google Ads reporting tool, as you can automate reports and receive scheduled insights about your entire marketing process.

Win More Auctions Without the Hassle
Understanding where you stand in the auction can help you fine-tune bids, improve ad quality, and target the right audience more effectively. But let’s be real—manually tracking these metrics and adjusting strategies can be overwhelming.
That’s where automation changes the game. Instead of constantly tweaking bids and analyzing reports, let AI handle the heavy lifting.
OTTO Google Ads does just that, helping you optimize campaigns, spot trends, and outmaneuver the competition without the guesswork.
Want top-performing campaigns in a few clicks? Try OTTO Google Ads free! Cancel anytime, no strings attached!


