

Looker Studio alternatives are tools that replace Looker Studio for reporting, visualization, and multi-source analytics. The tool is popular for basic dashboards, but many Looker Studio reviews cite slow performance, and limits when handling larger datasets.
Looker Studio is free, yet advanced data blending and scalable reporting often require paid add-ons or enterprise tools. These gaps make alternatives to Looker Studio appealing to teams that need reliability, speed, and deeper analytics.
Professionals switch from Looker Studio when they need real-time syncing, stronger data modeling, embedded analytics, or governed access. The best Looker Studio alternatives in 2025 are Search Atlas, Tableau, and Microsoft Power BI.
The 31 best Looker Studio alternatives for every budget and use case are listed below.
What are the Best Looker Studio Alternatives?
The top 31 Looker Studio alternatives for 2025 deliver stronger analytics, richer connectors, faster dashboards, and deeper modeling. Some operate as full BI suites, while others excel at embedded analytics, marketing dashboards, or real-time performance reporting.
The 31 best Looker Studio alternatives are listed below.
| Best Looker Studio Alternative For | Key Features | Pricing | |
|---|---|---|---|
| Search Atlas | Best Looker Studio Alternative | LLM Visibility, Domain Power, Site Explorer, OTTO SEO | From $99 to $399 / month |
| Tableau | Enterprise Data Visualization | Visual analytics, dashboards, data blending | From $75 / user / month |
| Power BI | Business Intelligence and Reporting | Data modeling, DAX, automated refresh | From $10 / user / month |
| Qlik Sense | Associative Data Exploration | Associative engine, search-based analysis | From $30 / user / month |
| Domo | Cloud-Based Business Dashboards | Data pipelines, automation, team dashboards | From ~$300 / month |
| Metabase | Open-Source BI and SQL-Friendly Analytics | SQL editor, charts, interactive dashboards | Free to $500+ / month |
| Sisense | Embedded and Scalable Analytics | In-app dashboards, semantic layer, APIs | Custom pricing |
| Zoho Analytics | Self-Service BI and Automation | Data sync, AI insights, forecasting | From $30 / month |
| Apache Superset | Open-Source Data Visualization at Scale | SQL Lab, charts, connectors | Free |
| Klipfolio | Real-Time Performance Dashboards | API connectors, metrics boards | From $29 / month |
| Databox | Mobile-First KPI Tracking | KPIs, scorecards, automated reports | From $59 / month |
| Whatagraph | Marketing Agency Reporting | Cross-channel reports, templates | From $199 / month |
| ThoughtSpot | Search-Based Analytics | Natural language analytics, AI answers | From $95 / month |
| SAP Data Intelligence | Enterprise Data Integration | Governance, pipelines, AI workflows | Custom pricing |
| Dashthis | Automated Marketing Dashboards | Report automation, templates, easy sharing | From $39 / month |
| Datameer | Cloud Data Transformation and Analytics | Data prep, modeling, Snowflake-native | From $40 / month |
| AgencyAnalytics | Client SEO and PPC Dashboards | SEO/ads reporting, client portals | From $12 / client |
| Grafana | Real-Time Metrics and Monitoring | Time-series dashboards, alerts | Free to $299 / month |
| Qrvey | Embedded Analytics in SaaS Products | Automation, embedded dashboards | From $500 / month |
| Spotfire | Advanced Analytics and Data Science | Visual analytics, geospatial tools | From $25 / month |
| Geckoboard | TV Dashboards and Team Metrics | Live KPI boards, real-time updates | From $39 / month |
| Hurree | Cross-Channel Marketing Analytics | Unified KPIs, segmentation | From $49 / month |
| Adriel | Unified Ad Performance Dashboards | 650+ connectors, AI insights | From $500 / month |
| Ninjacat | Agency Reporting and Data Pipelines | ETL, warehousing, client reporting | Custom pricing |
| Tapclicks | Marketing Operations and Reporting | Data unification, workflows, dashboards | Custom pricing |
| ReportGarden | PPC, SEO, and Client Reporting | Campaign reports, dashboards, invoices | From $89 / month |
| Cube.js | Headless BI and Custom Dashboards | Semantic layer, APIs, acceleration | Free to custom |
| Lightdash | dbt-Native Analytics | Metric layer, dbt integration | From $800 / month |
| GraphQL | API-Driven Analytics Workflows | Metric APIs, real-time alerts | Custom pricing |
| Coefficient | Sheets-Based Business Intelligence | Live data, automation, connectors | From $0 to custom |
| Cyfe | Small Business All-in-One Dashboards | Simple KPI dashboards, widgets | From $29 to $119 / month |
1. Search Atlas: Best Looker Studio Alternative
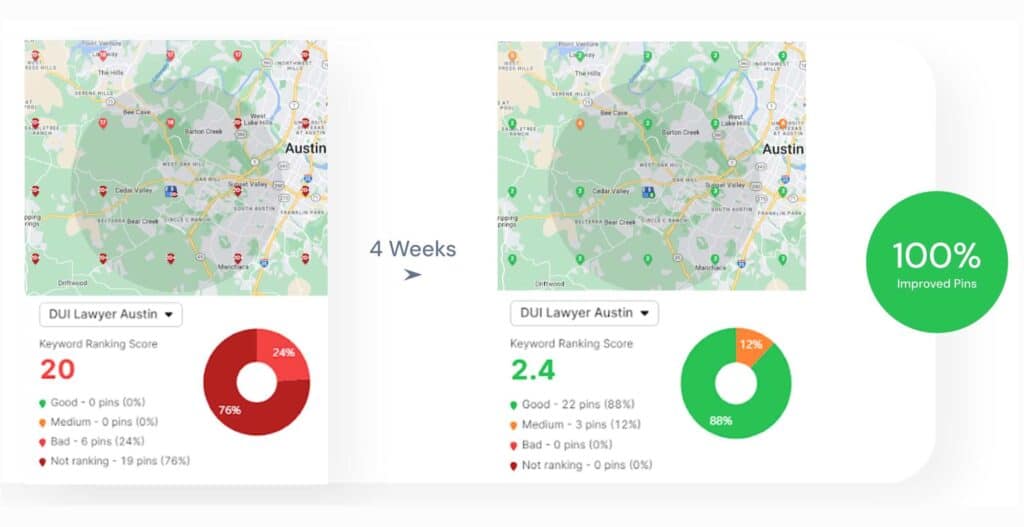
Search Atlas is an all-in-one analytics and marketing intelligence platform that unifies reporting across SEO, paid media, local performance, and multi-channel visibility. As the strongest Looker Studio alternative, Search Atlas replaces manual setup and fragile connectors with automated data syncing, AI summaries, and white-label client dashboards.
Search Atlas integrates Google Analytics (GA4), Google Search Console (GSC), Google Business Profile (GBP), Google Ads, Meta Ads, Rank Tracker, Local SEO Heatmaps, and Backlink Intelligence into one centralized reporting system. Real-time data flows directly into the dashboard without broken connectors or blending issues.
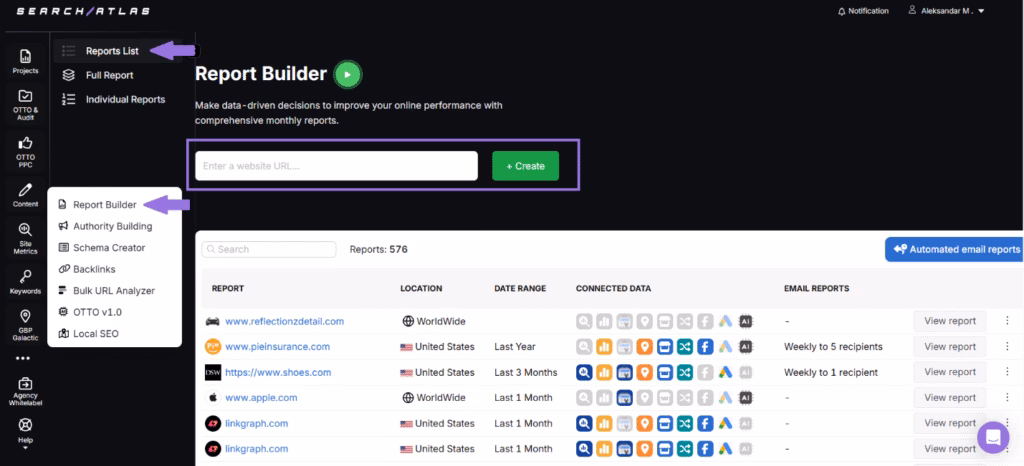
Search Atlas Report Builder creates customizable reports using drag-and-drop widgets, flexible layouts, and AI-generated summaries. Reports cover rankings, traffic, conversions, paid ads, local performance, backlinks, and multi-location visibility using live GA4 and GSC data.
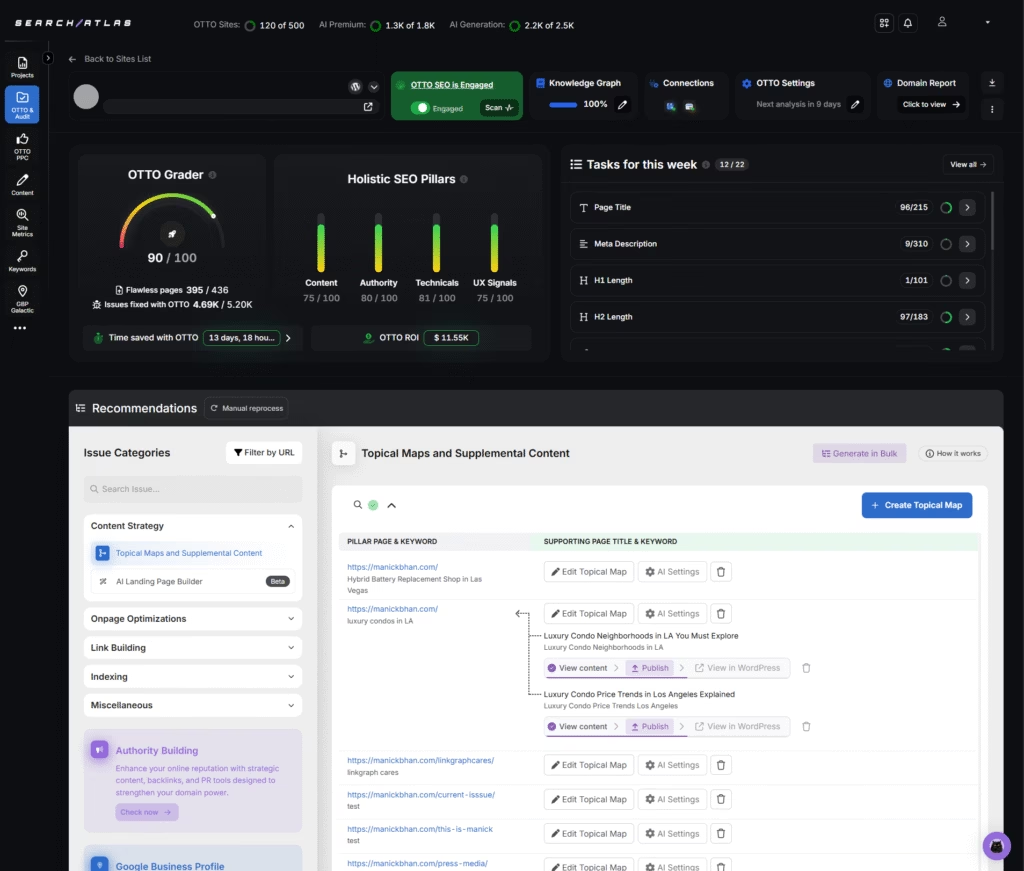
Search Atlas extends beyond reporting with OTTO SEO, the AI assistant that audits websites, identifies opportunities, deploys technical fixes, scores content, and improves site structure automatically. Search Atlas delivers insight and execution by connecting reporting data to real on-page, technical, and authority improvements through OTTO.
Search Atlas pricing ranges from $99 to $399 per month, with a 7-day free trial.
Pros of Search Atlas review include real-time integrations, AI summaries, white-label dashboards, cross-channel reporting, local heatmaps, and multi-account portfolio views. Cons include a steeper learning curve, but guided onboarding reduces this challenge.
2. Tableau: Best Looker Studio Alternative for Enterprise Data Visualization
Tableau is a visual analytics platform built for advanced dashboards, interactive reporting, and enterprise-scale data exploration. Tableau connects to a wide range of data sources and offers rich visual storytelling through charts, maps, and predictive insights.
Tableau surpasses Looker Studio for enterprise visualization because it provides deeper visual flexibility and broader analytical depth. Looker Studio focuses on structured modeling and metric consistency, while Tableau excels in custom visual design and complex exploratory analysis across large data environments.
Core tools in Tableau include drag-and-drop dashboard creation, custom visual design, predictive analytics, natural-language querying, and data preparation through Tableau Prep. Tableau offers cloud and on-premise deployments with collaboration features that enable shared dashboards and governed access controls.
Tableau is a paid tool with pricing ranges from $75 to $115 per user per month. Standard plan starts at $75 per user per month. Enterprise plan costs $115 per user per month and adds governance. Tableau+ provides premium AI features through custom pricing.
Pros of Tableau include strong visual customization, interactive dashboards, and reliable enterprise analytics. Cons of Tableau include a steep learning curve at advanced levels and higher costs for teams that scale.
3. Power BI: Best Looker Studio Alternative for Business Intelligence and Reporting
Power BI is a business intelligence platform from Microsoft built for data analysis, reporting, and interactive dashboards. Power BI connects to a wide range of data sources and transforms complex datasets into clear visual summaries through charts, tables, and maps.

Power BI outclasses Looker Studio in business intelligence depth. It handles large datasets, complex calculations, and detailed reporting across enterprise environments. Power BI delivers stronger modeling, richer analytics, and broader ecosystem integration.
Core tools in Power BI include interactive dashboard creation, data modeling with DAX, data transformation with Power Query, real-time analytics, and built-in security features for governed access. Power BI integrates with Excel, SharePoint, Teams, and Azure services, which offers smooth enterprise workflows.
Power BI is a paid tool with pricing ranges from $14 to $24 per user per month. The Free plan provides individual report creation. Power BI Pro costs $14 per user per month for publishing and sharing. Premium costs $24 per user per month and expands data capacity with advanced refresh options.
Pros of Power BI include rich analytics, broad data connections, and strong alignment with the Microsoft ecosystem. Cons of Power BI include a challenging learning curve for advanced features and occasional performance limitations with extremely large datasets.
4. Qlik Sense: Best Looker Studio Alternative for Associative Data Exploration
Qlik Sense is a data analytics platform that builds interactive dashboards, and enterprise analytics from multiple data sources. Qlik Sense uses an associative model that lets analysts explore relationships across entire datasets without rigid hierarchies or fixed query paths.

Qlik Sense stands ahead of Looker Studio for associative data exploration because it enables free-form analysis across every connection in the dataset. Looker Studio presents linear report views, while Qlik Sense uncovers hidden links, spontaneous patterns, and non-obvious relationships through its associative engine.
Core tools in Qlik Sense include the associative engine for on-the-fly exploration, interactive dashboards, no-code self-service analytics, AI-driven insights, and natural-language search. Qlik Sense integrates with a broad range of data sources, offers embedded analytics, and provides collaboration features for guided analytics at scale.
Qlik Sense pricing ranges from $200 to $2,750 per month. The Starter plan costs $200 per month for cloud analytics. The Standard plan costs $825 per month with expanded capacity. The Premium plan costs $2,750 per month with full cloud functionality.
Pros of Qlik Sense include its associative engine, advanced exploration capabilities, and strong scalability. Cons of Qlik Sense include a steep learning curve, high pricing for upper tiers, and limited visual customization.
5. Domo: Best Looker Studio Alternative for Cloud-Based Business Dashboards
Domo is a cloud-based business intelligence platform built to unify data integration, dashboard creation, and real-time reporting in one environment. Domo connects to a wide range of data sources and transforms complex datasets into interactive dashboards.
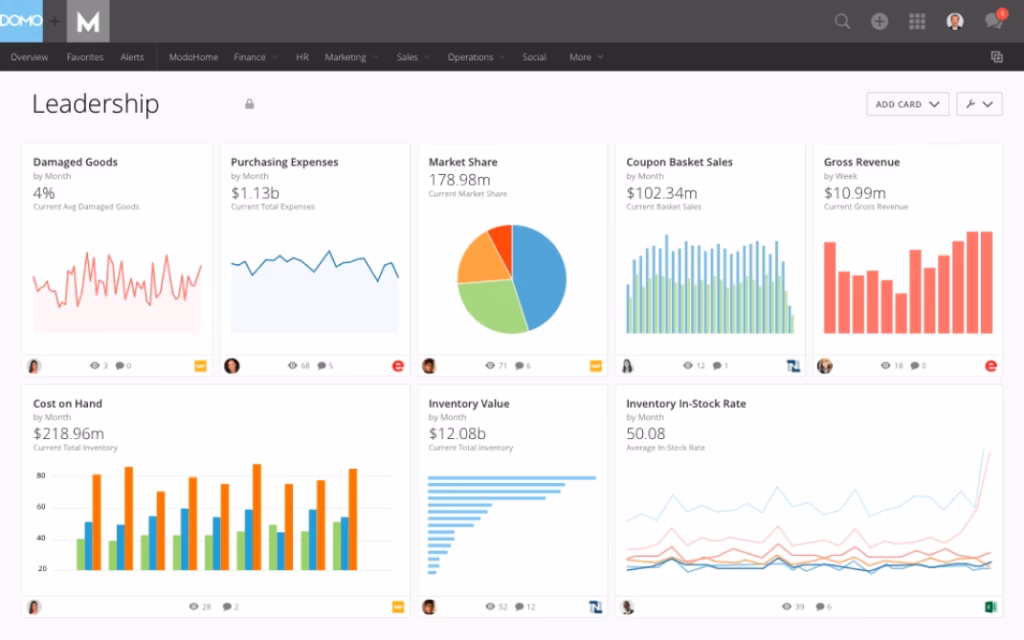
Domo moves ahead of Looker Studio for cloud-based business dashboards because it offers stronger data integration, real-time sharing, and executive-ready reporting. Domo manages the entire cloud data pipeline with prebuilt connectors, governed access, and unified dashboards across teams.
Core tools in Domo include extensive data connectivity, interactive dashboards, automated data refresh, and the Magic ETL builder for drag-and-drop data transformation. Domo provides AI-driven insights, collaboration features, governed metrics, and mobile access for executives who rely on real-time visibility.
Domo pricing ranges from $0 to custom enterprise plans. The Free plan offers 30 days of full access with unlimited users. Paid tiers require contacting sales and introduce dedicated support, private link options, volume discounts, and advanced feature bundles.
Pros of Domo include strong data integration, interactive dashboards, and reliable cloud access for technical and non-technical analysts. Cons include high enterprise pricing, a challenging learning curve at advanced levels, and performance limitations with complex dashboards.
6. Metabase: Best Looker Studio Alternative for Open-Source BI and SQL-Friendly Analytics
Metabase is an open-source business intelligence platform that creates dashboards, visual reports, and embedded analytics from live databases. Metabase offers visual query building for non-technical team members and SQL editing for analysts who want full control.
Metabase outperforms Looker Studio for open-source BI and SQL-friendly analytics. It offers direct database connections, a native SQL editor, and flexible deployment options. Looker Studio focuses on cloud-based reports, while Metabase provides an open-source layer that offers self-hosting, embedded analytics, and customizable workflows.
Core tools in Metabase include an intuitive query builder, SQL-based querying, interactive dashboards, granular permissions, and simple sharing options for teams. Metabase offers embedding analytics inside products, organizes dashboards through collections, and connects to a wide range of databases for live analysis.
Metabase pricing ranges from $0 to custom enterprise plans. The Open Source edition is free for self-hosting. The Starter plan costs $100 per month plus $6 per user. The Pro plan starts at $575 per month plus $12 per user with advanced permissions and white-labeling.
Pros of Metabase include its open-source framework, and SQL support for analysts. Cons of Metabase include slower performance on large datasets, limited customization at advanced levels, and inconsistent metric definitions in complex environments.
7. Sisense: Best Looker Studio Alternative for Embedded and Scalable Analytics
Sisense is an analytics platform built for embedding dashboards, visual apps, and AI-powered insights into products and enterprise workflows. Sisense connects to complex datasets and transforms them into interactive visual experiences that offer deep analysis across large data environments.

Sisense moves ahead of Looker Studio for embedded and scalable analytics because it provides customizable dashboards, flexible embedding options, and a high-performance engine for large datasets. Sisense offers full-scale analytics deployments with advanced customization and stronger performance for enterprise workloads.
Core tools in Sisense include interactive dashboards, AI-driven insights, natural-language exploration, predictive analytics, and strong embedded analytics capabilities. Sisense integrates with multiple data sources, manages data preparation, and offers scalable deployments across cloud or on-premise environments.
Sisense is a paid tool with pricing available through custom quotes. Pricing varies based on data volume, user count, deployment type, and feature requirements. Sisense positions its model as flexible so organizations select the exact capacity they need.
Pros of Sisense include powerful embedding features, strong performance with large datasets, and AI-driven insights. Cons of Sisense include high pricing, a steep learning curve for advanced capabilities, and limited native visualization options.
8. Zoho Analytics: Best Looker Studio Alternative for Self-Service BI and Automation
Zoho Analytics is a self-service business intelligence platform that centralizes data from multiple sources and turns it into interactive dashboards and automated reports. Zoho Analytics uses an AI assistant named Zia for natural-language queries, predictive insights, and instant data explanations.
Zoho Analytics excels beyond Looker Studio for self-service BI and automation because it offers stronger data preparation tools, AI-driven automation, and a drag-and-drop interface that supports non-technical analysts. Zoho Analytics delivers broader automation, deeper data blending, and faster insight generation without SQL.
Core tools in Zoho Analytics include data integration from hundreds of sources, automated data preparation, interactive dashboards, visual report building, and AI-driven insights through Zia. Zoho Analytics offers collaboration, scheduled reporting, forecasting, and mobile access for decision-makers who want insights anywhere.
Zoho Analytics pricing ranges from $0 to $495 per month. The Basic plan costs $25 per month for two users and 500,000 rows. Higher tiers expand user capacity, row limits, and advanced features. The Enterprise plan costs $495 per month for 50 users and 50 million rows.
Pros of Zoho Analytics include strong automation, extensive integration options, and an intuitive interface for fast dashboard creation. Cons of Zoho Analytics include occasional performance slowdowns on large datasets and a higher cost for upper tiers.
9. Apache Superset: Best Looker Studio Alternative for Open-Source Data Visualization at Scale
Apache Superset is an open-source data exploration and visualization platform built for teams that want full control over their analytics environment. Apache Superset connects to a wide range of data sources and produces interactive dashboards through a mix of SQL editing and no-code visualization tools.

Apache Superset moves ahead of Looker Studio for open-source visualization at scale because it provides a cloud-native architecture, and a flexible environment suited for large datasets. Apache Superset delivers self-hosted analytics with deeper customization.
Core tools in Apache Superset include a SQL-first exploration interface, a visual query builder, rich chart libraries, and customizable dashboards. Apache Superset integrates with databases, data warehouses, and cloud systems, providing interactive visualizations across geospatial, time-series, and advanced analytical charts.
Apache Superset is a free tool with no licensing or subscription costs. Any expenses come from hosting, infrastructure, and ongoing maintenance for self-managed deployments.
Pros of Apache Superset include full open-source flexibility, extensive visualization options, and strong performance for large datasets. Cons of Apache Superset include the need for technical expertise, manual setup, and ongoing DevOps maintenance.
10. Klipfolio: Best Looker Studio Alternative for Real-Time Performance Dashboards
Klipfolio is a cloud-based analytics platform that builds real-time dashboards and performance reports for businesses that track KPIs across multiple data sources. Klipfolio connects to spreadsheets, databases, and cloud services, then transforms that data into live visual dashboards for fast monitoring.
Klipfolio outperforms Looker Studio for real-time performance dashboards because it delivers faster refresh rates, stronger customization, and more flexible data manipulation. Looker Studio focuses on lightweight reporting, while Klipfolio specializes in live KPI tracking with granular control over dashboard design and update frequency.
Core tools in Klipfolio include a no-code dashboard builder, real-time visualization options, data integration across dozens of sources, and automated reporting workflows. Klipfolio offers custom formulas, scheduled refreshes, and collaborative sharing features for teams that monitor performance throughout the day.
Klipfolio pricing ranges from $120 to $600 per year. The Base plan costs $120 per year with three dashboards and four-hour refreshes. The Grow plan costs $190 per year with expanded limits and one-hour refreshes. The Team plan costs $310 per year with 15-minute refreshes. The Team Plus plan costs $600 per year with advanced onboarding.
Pros of Klipfolio include broad data source integration, strong customization, and reliable real-time updates. Cons of Klipfolio include slower load times on complex dashboards, a steep learning curve for new builders, and limited support on lower plans.
11. Databox: Best Looker Studio Alternative for Mobile-First KPI Tracking
Databox is a reporting and data centralization platform that brings metrics from multiple sources into unified dashboards and automated reports. Databox offers custom layouts with text, images, and data visualizations that form clear performance summaries for growing businesses and agencies.
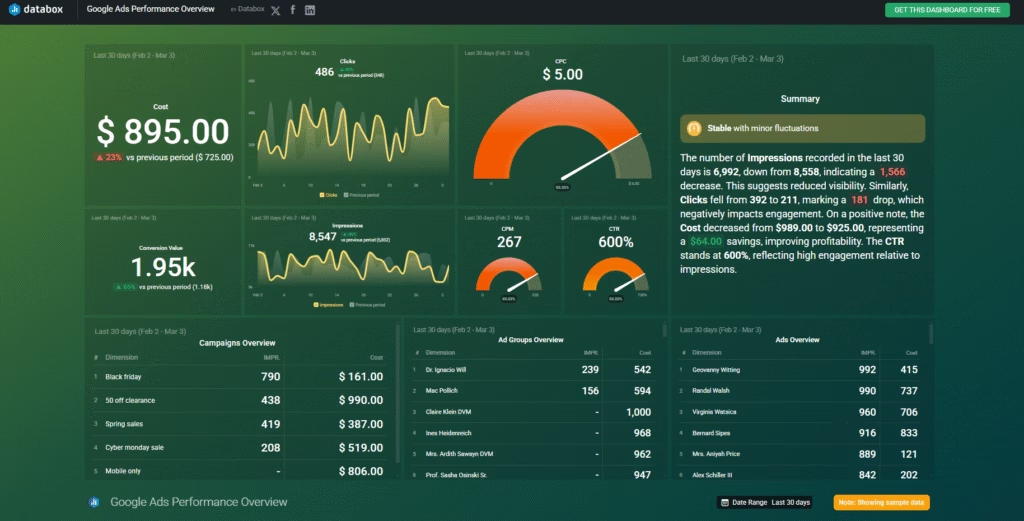
Databox proves more capable than Looker Studio for mobile-first KPI tracking because it offers real-time alerts, and dashboards designed for daily performance monitoring. Databox gives teams a smooth and feature-rich experience on phones and tablets.
Core tools in Databox include customizable dashboards, automated reporting schedules, prebuilt templates, branded visual reports, and AI-generated performance summaries. Databox integrates with over 130 sources across cloud apps, spreadsheets, APIs, and workflow tools like Zapier and Make.
Databox is a paid tool with pricing ranges from $199 to $999 per month. The Professional plan costs $199 per month. The Growth plan costs $499 per month. The Premium plan costs $999 per month. Additional data sources cost $7 per month.
Pros of Databox include strong metric centralization, flexible reporting, AI-driven summaries, and brandable dashboards. Cons of Databox include limited customization in lower tiers, extra fees for white-labeling, and a challenging learning curve for new users.
12. Whatagraph: Best Looker Studio Alternative for Marketing Agency Reporting
Whatagraph is a marketing reporting platform built for agencies and in-house teams that manage multi-channel performance. Whatagraph centralizes data across PPC, SEO, social, and ecommerce, then converts those metrics into unified dashboards and automated client reports.
Whatagraph offers deeper functionality than Looker Studio for agency reporting. It provides stable integrations, built-in white-labeling, and faster report creation tailored for marketing teams. Whatagraph accelerates reporting workflows designed specifically for client delivery.
Core tools in Whatagraph include a drag-and-drop report builder, cross-channel data blending, reusable templates, and automated sharing through email or live links. Higher tiers add IQ Dimensions for automated transformations, and new metric creation. Whatagraph offers over 55 integrations and offers dedicated success management on premium plans.
Whatagraph is a paid tool with pricing ranges from $286 to custom enterprise plans. The Start plan costs $286 per month. The Boost plan costs $724 per month. The Max plan follows custom pricing for advanced requirements.
Pros of Whatagraph include advanced data blending, flexible report layouts, automated metric transformations, and strong white-label controls. Cons of Whatagraph include higher pricing for small teams, slower sync times on certain integrations, and no native SEO or keyword tracking.
13. ThoughtSpot: Best Looker Studio Alternative for Search-Based Analytics
ThoughtSpot is an analytics platform built around natural-language querying that allows users to create charts and explore data by typing questions into a search interface. ThoughtSpot connects to modern cloud data stacks and produces interactive visualizations, automated insights, and embedded analytics for enterprise applications.

ThoughtSpot surpasses Looker Studio for search-based analytics because it offers a conversational interface, and AI-driven insights that simplify exploration. ThoughtSpot introduces natural-language search and automated analysis that speed up ad-hoc decision-making.
Core tools in ThoughtSpot include natural-language querying, automated insights, trend detection, interactive dashboards, and embedded analytics for product teams. The ThoughtSpot AI Agent, Spotter, interprets questions, understands business context, and generates visual answers with human-in-the-loop feedback for accuracy.
ThoughtSpot is a paid tool with pricing ranges from $25 per user per month to custom enterprise plans. The Essentials plan costs $25 per user per month. The Pro plan costs $50 per user per month and introduces expanded AI analytics. Enterprise plans follow custom pricing for large-scale deployments.
Pros of ThoughtSpot include intuitive search-based analysis, fast ad-hoc insights, and strong integrations with modern cloud stacks. Cons of ThoughtSpot include limited visualization customization, a challenging learning curve for advanced features, and performance limitations with certain complex queries.
14. SAP Data Intelligence: Best Looker Studio Alternative for Enterprise Data Integration
SAP Data Intelligence is an enterprise data management platform that connects, orchestrates, and governs data across complex environments. SAP Data Intelligence integrates structured and unstructured data sources, enriches datasets, and builds automated pipelines that offer large-scale analytics and machine learning.

SAP Data Intelligence offers advantages over Looker Studio for enterprise data integration because it manages end-to-end data orchestration, pipeline creation, and advanced governance across large infrastructures. SAP Data Intelligence handles the deeper operational layer that powers enterprise analytics.
Core tools in SAP Data Intelligence include multi-source data integration, automated data pipelines, machine learning deployment, metadata cataloging, and governance across hybrid environments. The platform offers data discovery, profiling, and pipeline monitoring for organizations that manage extensive data ecosystems.
SAP Data Intelligence is a paid tool with pricing available through custom quotes. Costs depend on usage, deployment model, required features, and bundling within the SAP Business Technology Platform.
Pros of SAP Data Intelligence include strong enterprise integration, and reliable scalability for large data workloads. Cons of SAP Data Intelligence include high complexity, potential integration challenges with non-SAP systems, and higher staffing requirements.
15. Dashthis: Best Looker Studio Alternative for Automated Marketing Dashboards
DashThis is a multi-channel reporting platform designed to simplify marketing performance tracking for agencies and in-house teams. DashThis centralizes metrics from ad platforms, analytics tools, and SEO systems into unified dashboards that update automatically.
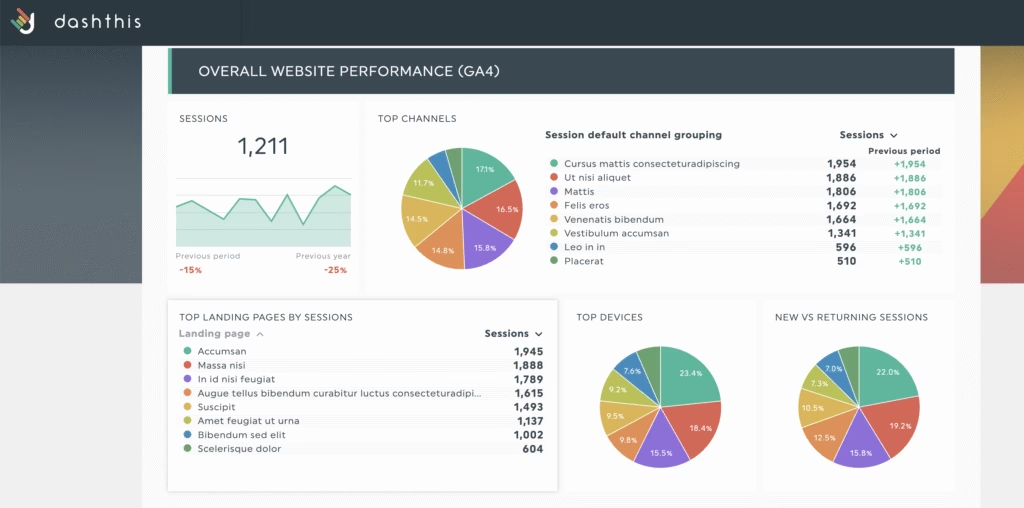
DashThis delivers stronger performance than Looker Studio for automated marketing dashboards. It offers plug-and-play templates, scheduled report delivery, and unified cross-channel tracking with minimal configuration.
Core tools in DashThis include automated data updates, scheduled email reports, customizable dashboards, branded shareable links, color themes, and CSV import for proprietary data. DashThis offers over 30 native integrations and provides white-label options on higher plans for agencies that manage large client portfolios.
DashThis is a paid tool with pricing ranges from $49 to $479 per month. The Individual plan costs $49 per month for 3 dashboards. The Professional plan costs $159 per month for 10 dashboards. The Business plan costs $309 per month for 25 dashboards. The Standard plan costs $479 per month for 50 dashboards.
Pros of DashThis include strong multi-channel integration, automated reporting, branded dashboard options, and centralized tracking. Cons of DashThis include rapid price increases as dashboard counts grow, limited advanced customization, and no built-in SEO or AI analysis.
16. Datameer: Best Looker Studio Alternative for Cloud Data Transformation and Analytics
Datameer is a cloud-based data transformation platform built to prepare, explore, and model analytics-ready data inside Snowflake. Datameer provides a visual, spreadsheet-style interface that offers data integration, cleaning, and publishing workflows without deep technical knowledge.

Datameer offers deeper functionality than Looker Studio for enterprise-scale data transformation because it focuses on complex preparation tasks, governance, and diverse data integration. Looker Studio handles visualization well, while Datameer manages the upstream transformation layer required for advanced analytics.
Core tools in Datameer include no-code, low-code, and SQL-based transformation options, visual data profiling, multi-source integration, governed data workflows, and collaborative editing. Datameer operates directly within Snowflake, which streamlines modeling and reduces data movement across systems.
Datameer is a paid tool with pricing available through custom quotes. The platform provides personalized plans based on usage, deployment needs, and team size.
Pros of Datameer include a user-friendly interface, strong connectivity to cloud data sources, and reliable Snowflake optimization. Cons of Datameer include browser navigation challenges, limited visualization options, and interface elements that require refinement.
17. AgencyAnalytics: Best Looker Studio Alternative for Client SEO and PPC Dashboards
AgencyAnalytics is a white-label reporting platform built for agencies that manage SEO, PPC, and social campaigns. AgencyAnalytics produces automated dashboards, scheduled reports, and branded client portals for streamlined account management.
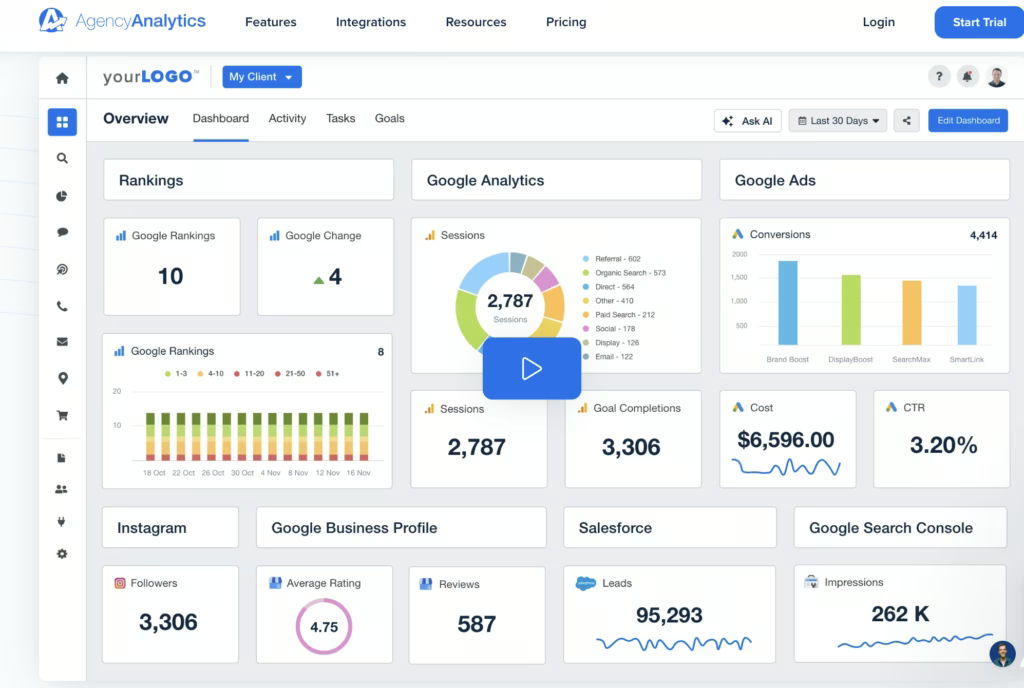
AgencyAnalytics proves more effective than Looker Studio for client SEO and PPC dashboards because it centralizes rank tracking, backlink monitoring, budget pacing, and client communication in one workspace. AgencyAnalytics delivers agency-ready workflows with integrated SEO features and easier setup.
Core tools in AgencyAnalytics include automated reporting, drag-and-drop dashboards, white-label branding, custom metrics, goal tracking, scheduled alerts, benchmark comparisons, rank tracking, backlink data, GBP insights, and a client portal that organizes communication and access control.
AgencyAnalytics is a paid tool with pricing ranges from $79 to custom enterprise plans. The Freelancer plan costs $79 per month for 5 clients. The Agency plan costs $239 per month for 10 clients. The Agency Pro plan costs $479 per month for 15 clients. Enterprise tiers provide custom pricing for larger organizations.
Pros of AgencyAnalytics review include simple client reporting, multi-channel visibility, customizable dashboards, AI-assisted insights, and strong white-label features. Cons include limited depth in SEO auditing, basic keyword research tools, and no AI-driven content creation.
18. Grafana: Best Looker Studio Alternative for Real-Time Metrics and Monitoring
Grafana is an open-source observability platform that turns metrics, logs, and time-series data into dynamic, interactive dashboards. Grafana connects to databases, cloud services, and monitoring systems, then visualizes live operational data for engineering and DevOps teams.


Grafana offers deeper functionality than Looker Studio for real-time metrics and monitoring because it is built specifically for time-series analysis and operational observability. Looker Studio offers business analytics, while Grafana handles live system monitoring, alerting, and infrastructure-level insights.
Core tools in Grafana include advanced visualization panels, mixed data source support, rule-based alerting, dashboard templating, and an extensive plugin ecosystem. Grafana integrates with Prometheus, Graphite, InfluxDB, Elasticsearch, MySQL, PostgreSQL, and many other systems through native and community plugins.
Grafana is a paid tool with pricing ranges from $0 to $25,000 per year. The Free plan provides basic dashboards with limited retention. The Pro plan starts at $19 per month plus usage and adds longer retention. The Enterprise plan begins at $25,000 per year and introduces premium support and deployment flexibility.
Pros of Grafana include strong real-time visualization, deep customization, and broad integration options. Cons of Grafana include a steep learning curve, reliance on external tools for data collection, and performance limits on very large dashboards.
19. Qrvey: Best Looker Studio Alternative for Embedded Analytics in SaaS Products
Qrvey is an embedded analytics platform built for SaaS companies that want to deliver dashboards, reports, and automation tools directly inside their applications. Qrvey provides a no-code environment for creating interactive analytics while handling data collection, transformation, and visualization in one system.

Qrvey positions itself above Looker Studio for embedded analytics because it is designed specifically for SaaS products, multi-tenant deployments, and in-app reporting. Qrvey delivers a full embedded analytics architecture that offers product teams with faster deployment and lower engineering overhead.
Core tools in Qrvey include no-code report builders, interactive dashboards, automated workflows, multi-tenant security, self-service analytics, and AI-driven insights. Qrvey integrates with SaaS data pipelines and offers customization for end-users who need personalized views inside the product environment.
Qrvey is a paid tool with pricing available through custom quotes. Plans follow flat-rate tiers rather than per-user pricing and are tailored to product requirements, deployment preferences, and data needs.
Pros of Qrvey include its no-code interface, built-in automation, and strong alignment with SaaS product requirements. Cons of Qrvey include a challenging learning curve for advanced use, higher costs for growing teams, and documentation that requires improvement.
20. Spotfire: Best Looker Studio Alternative for Advanced Analytics and Data Science
Spotfire is a visual data science platform that blends data visualization, predictive analytics, and data wrangling into one analytical environment. Spotfire connects to diverse data sources and builds interactive, exploratory dashboards that offer complex analysis across enterprise use cases.

Spotfire surpasses Looker Studio for advanced analytics and data science because it introduces built-in predictive modeling, statistical analysis, and machine learning features. Looker Studio offers lightweight BI reporting, while Spotfire delivers deeper analytical workflows designed for data scientists and technical analysts.
Core tools in Spotfire include interactive dashboards, custom visualizations, map charts, scatterplots, heat maps, AI-driven recommendations, predictive modeling, regression analysis, clustering, and built-in machine learning algorithms. Spotfire offers a drag-and-drop interface that accelerates discovery and reveals hidden data patterns through automated insights.
Spotfire is a paid tool with pricing ranges from $25 to $125 per user per month. Consumer access begins at $25 per user per month. Business author plans cost $65 per user per month. Analyst tiers reach $125 per user per month depending on role and deployment.
Pros of Spotfire include strong predictive analytics, interactive visualizations, and reliable performance on large datasets. Cons of Spotfire include higher pricing, a steep learning curve for advanced functionality, and an interface that feels complex for basic reporting.
21. Geckoboard: Best Looker Studio Alternative for TV Dashboards and Team Metrics
Geckoboard is a real-time dashboard platform that displays team KPIs on TV screens, shared links, or internal channels. Geckoboard connects to dozens of data sources and converts metrics into simple, visual dashboards that keep teams aligned throughout the day.
Geckoboard offers stronger capabilities than Looker Studio for TV dashboards and team metrics because it is built specifically for on-screen data visibility and real-time updates. Looker Studio focuses on report-style analytics, while Geckoboard emphasizes fast-loading dashboards designed for constant team monitoring.
Core tools in Geckoboard include real-time KPI dashboards, a drag-and-drop builder, broad integration with more than eighty data sources, and display options suited for office TVs or shared links. The platform offers scheduled reports, Slack notifications, and simple customization to keep teams focused on daily performance indicators.
Geckoboard pricing ranges from $60 to custom enterprise plans. The Essential plan costs $60 per month for one dashboard. The Core plan costs $175 per month with expanded sharing and branding. The Pro plan costs $319 per month with advanced controls. Enterprise plans introduce custom pricing for larger organizations.
Pros of Geckoboard include fast setup, strong real-time visibility, clean data displays for TV screens, and reliable integrations. Cons of Geckoboard include limited deep analytics, higher pricing at scale, and fewer advanced visualization options compared to BI-focused platforms.
22. Hurree: Best Looker Studio Alternative for Cross-Channel Marketing Analytics
Hurree is an AI-powered analytics platform that centralizes data from marketing, sales, and customer platforms into unified dashboards. Hurree eliminates manual reporting work by providing real-time insights, automated updates, and AI-driven recommendations for teams that track performance across multiple channels.
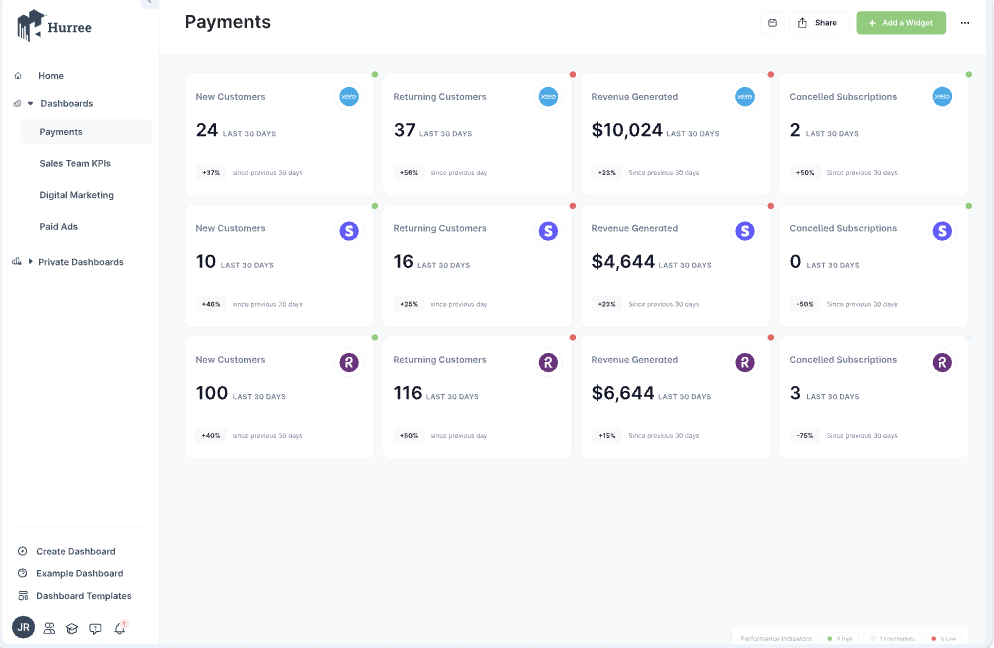
Hurree positions itself above Looker Studio for cross-channel marketing analytics because it unifies campaign data, audience segments, and KPIs across every platform in one workspace. Looker Studio focuses on visual reporting, while Hurree offers marketing-specific insights, automated aggregation, and cross-channel visibility.
Core tools in Hurree include centralized data integration, interactive dashboards, real-time updates, and AI analytics through its assistant, Riva. Riva provides instant summaries, predictive insights, and recommendations. Hurree integrates with major tools in advertising, CRM, analytics, and customer engagement to solve data fragmentation.
Hurree is a paid tool with pricing ranges from $0 to $1,717 per year. The Freemium plan costs $0 with one dashboard and 10 widgets. The Starter plan costs $745.20 per year with 4 connectors and 5 users. The Professional plan costs $1,717 per year with expanded connectors, dashboards, and user capacity.
Pros of Hurree include strong AI-driven insights, and reliable dashboards that simplify decision-making. Cons include limited customization options, a learning curve for advanced capabilities, and fewer niche integrations compared to broader BI platforms.
23. Adriel: Best Looker Studio Alternative for Unified Ad Performance Dashboards
Adriel is a marketing intelligence platform that centralizes advertising, analytics, and performance data into unified dashboards. Adriel connects to hundreds of ad networks and reporting tools, eliminating manual data collection while providing real-time insights, creative analysis, and streamlined campaign operations.
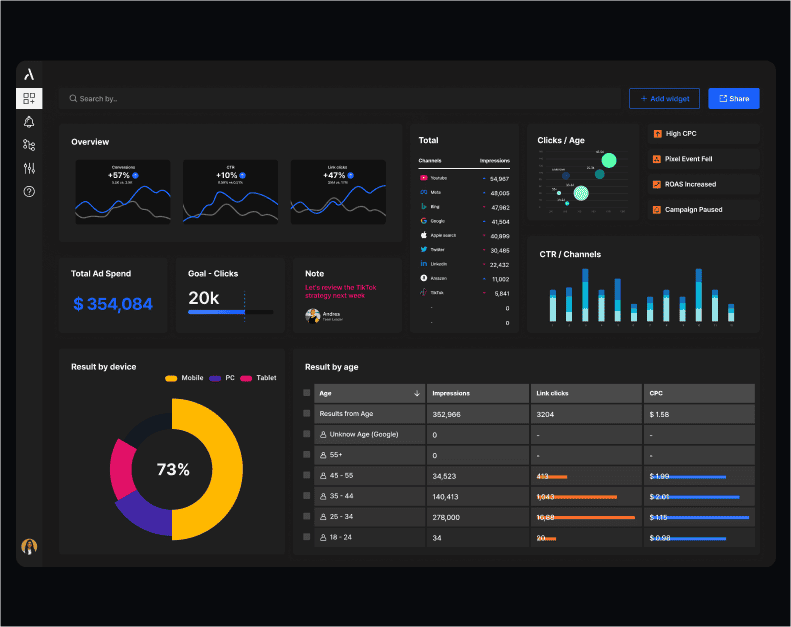
Adriel delivers stronger performance than Looker Studio for unified ad dashboards because it tracks ad spend, creative performance, and cross-platform results without relying on manual connectors. Adriel offers a dedicated AdOps environment built for campaign reporting across every major ad network.
Core tools in Adriel include automated data integration from over six hundred fifty sources, drag-and-drop dashboard creation, customizable report templates, creative-level breakdowns, AI-driven insights, and white-label sharing for clients. Adriel organizes spend, performance, and attribution data inside one workspace to provide faster optimization.
Adriel pricing ranges from $500 to custom enterprise plans. Starter at $500 includes 10 dashboards and an AI agent. Professional at $1,000 adds premium connectors, unlimited dashboards, and onboarding. Enterprise is custom with unlimited users, custom connectors, and priority support.
Pros of Adriel include extensive connector coverage, intuitive dashboards, real-time ad performance visibility, and AI-driven insights that improve spend efficiency. Cons include occasional API sync issues, complex workflows for non-analysts, and inconsistent support experiences.
24. Ninjacat: Best Looker Studio Alternative for Agency Reporting and Data Pipelines
NinjaCat is a performance management platform built for agencies and media teams that unify marketing data, automate reporting, and manage campaign analytics. NinjaCat consolidates advertising, SEO, call tracking, and budget data into branded dashboards that offer large client portfolios.
NinjaCat proves more capable than Looker Studio for agency reporting and data pipelines. It centralizes marketing data warehousing, automates client-ready reports, and manages multi-account dashboards at scale. NinjaCat provides agency-specific workflows designed for high-volume reporting and cross-channel operations.
Core tools in NinjaCat include automated reporting, white-label dashboards, data unification from multiple sources, AI-driven insights, call tracking with detailed metrics, budget monitoring, and campaign performance tracking. NinjaCat schedules reports as PDFs or live dashboards to streamline client delivery.
NinjaCat is a paid tool with pricing available through custom quotes. Costs depend on data volume, connector requirements, and automation needs, and a demo is required to receive tailored pricing.
Pros of NinjaCat include automated client reporting, customizable dashboards, easy multi-channel integration, and call tracking features that offer ROI analysis. Cons include slower loading on large reports, limited advanced analytics integrations, and a learning curve for complex templates.
25. Tapclicks: Best Looker Studio Alternative for Marketing Operations and Reporting
TapClicks is a marketing operations platform that unifies data from dozens of advertising, analytics, and automation tools into a single reporting environment. TapClicks automates data extraction, transformation, and loading, then generates client-ready dashboards and scheduled reports in formats like PDF, Excel, and PowerPoint.
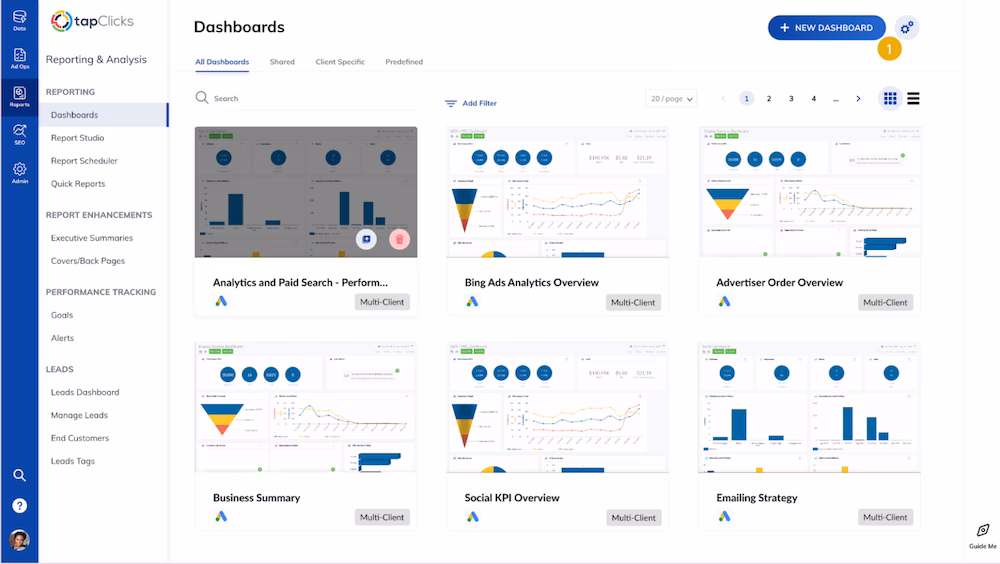
TapClicks offers broader capabilities than Looker Studio for marketing operations and cross-channel reporting because it provides automated ETL, multi-client management, and workflow tools built specifically for agencies. TapClicks combines reporting, operations, and data management into one system designed for large marketing teams.
Core tools in TapClicks include TapAnalytics for unified dashboards, TapReports for automated white-label reports, TapOrders for campaign ordering, TapWorkflow for task management, and TapInsights for AI-driven analysis. The platform centralizes marketing data and produces branded deliverables that reduce manual reporting time across agency accounts.
TapClicks pricing available through custom quotes. Costs depend on data volume, connector requirements, dashboard capacity, and automation workflows. A consultation is required to receive a tailored plan.
Pros of TapClicks include extensive integrations, automated report generation, customizable dashboards, and strong multi-account management for agencies. Cons include a non-intuitive interface, slow initial data population, occasional performance issues with exports, and longer support response times.
26. ReportGarden: Best Looker Studio Alternative for PPC, SEO, and Client Reporting
ReportGarden is a reporting and analytics platform built for agencies that manage PPC, SEO, and cross-channel campaigns. ReportGarden consolidates data from advertising and analytics tools, automates client reporting, and provides dashboards that track budgets, keyword rankings, and performance trends.
ReportGarden proves more effective than Looker Studio for PPC, SEO, and client reporting because it offers built-in automation, white-label features, and agency-specific workflows. ReportGarden delivers streamlined reporting across all major marketing platforms.
Core tools in ReportGarden include scheduled reporting, drag-and-drop dashboards, white-label templates, campaign budget tracking, SEO keyword monitoring, and email delivery of client-ready reports in PDF or Excel. The platform automates data collection and offers agency workflows across multiple accounts.
ReportGarden is a paid tool with pricing starting at $75 per month. All tiers include automated reporting and offer a 14-day free trial without a credit card requirement.
Pros of ReportGarden include easy report creation, strong automation, professional client outputs, and broad integration coverage. Cons include limited layout customization, higher costs for small agencies, occasional slow loading times, and inconsistent support response times.
27. Cube.js: Best Looker Studio Alternative for Headless BI and Custom Dashboards
Cube.js is an open-source headless BI platform that provides a semantic layer for building custom analytics applications. Cube.js sits between data warehouses and front-end interfaces, serving consistent metrics and dimensions through APIs that power dashboards, reports, and embedded analytics.

Cube.js offers deeper capabilities than Looker Studio for headless BI because it delivers a dedicated semantic layer, high-performance querying, and complete control over custom dashboards. Looker Studio focuses on drag-and-drop visualization, while Cube.js offers developers who need scalable, programmable analytics for embedded use cases.
Core tools in Cube.js include semantic data modeling, pre-aggregations for high-performance queries, caching, role-based access control, and flexible APIs for embedding dashboards in any front-end framework. Cube.js enables developers to build custom interfaces that maintain consistent definitions across all metrics.
Cube.js pricing ranges from $0 to custom enterprise plans. Free costs $0 for basic modeling. Starter at $40 per developer per month adds production deployment. Premium at $80 adds embedded analytics, and unlimited queries. Enterprise offers custom pricing for advanced needs.
Pros of Cube.js include its strong semantic layer, high-performance architecture, flexible APIs, and suitability for embedded dashboards. Cons include a steep learning curve, no built-in visualization layer, and a developer-centric setup that requires engineering resources.
28. Lightdash: Best Looker Studio Alternative for dbt-Native Analytics
Lightdash is an open-source BI platform built to work directly with dbt projects and cloud data warehouses. Lightdash transforms existing dbt models into interactive dashboards, governed metrics, and self-service exploration without duplicating data.

Lightdash positions itself above Looker Studio for dbt-native analytics. It integrates directly with dbt’s metric layer, relationships, and YAML configuration. Lightdash embeds BI into the data transformation workflow, giving data teams a unified environment for development and analysis.
Core tools in Lightdash include dbt-native metric definitions, governed semantic modeling, interactive dashboards, SQL exploration, role-based access controls, smart caching, and self-hosting options for full data ownership. Lightdash turns dbt models into a complete analytics workspace with consistent formulas and developer-friendly workflows.
Lightdash is a paid tool with pricing ranges from $800 per month to custom enterprise plans. The Starter plan costs $800 per month with unlimited users and daily updates. The Pro plan costs $2,400 per month with smart caching, SSO, and dedicated support. Enterprise tiers provide custom pricing for advanced security and regional deployment.
Pros of Lightdash include intuitive data exploration, open-source flexibility, and a developer-first design. Cons include fewer advanced BI features than older platforms, and the requirement for a modern data stack and technical expertise.
29. GraphQL: Best Looker Studio Alternative for API-Driven Analytics Workflows
GraphQL is an open-source query language for APIs that retrieves structured data through a single endpoint. GraphQL defines types, fields, and relationships to create precise queries that reduce overfetching and underfetching.

GraphQL functions as a stronger option than Looker Studio for developer-driven analytics workflows that depend on API-level querying. Looker Studio produces business dashboards, while GraphQL focuses on flexible schema design and efficient data retrieval for custom applications.
Core tools in GraphQL include a schema definition language with type-based structures, queries, mutations, and subscriptions, plus interactive IDEs that test requests in real time. GraphiQL provides an in-browser environment for exploring schemas, running queries, and validating request logic during development.
GraphQL is a free, open-source tool with pricing tied only to managed GraphQL services. Costs vary for hosted platforms that charge based on API operations, data volume, and feature tiers.
Pros of GraphQL include strong schema control, and a single endpoint that enhances frontend and backend independence. Cons include a steep learning curve for schema design, performance issues with poorly structured queries, and no built-in standards for error processing.
30. Coefficient: Best Looker Studio Alternative for Sheets-Based Business Intelligence
Coefficient is a no-code data connector that turns Google Sheets and Excel into live-data reporting platforms. Coefficient links spreadsheets to business systems and automates data imports, updates, and workflows without manual entry.

Coefficient offers stronger value than Looker Studio for spreadsheet-based BI because it keeps analysis inside the familiar sheet environment. Coefficient automates data movement and reporting directly inside Sheets and Excel for non-technical users.
Core tools in Coefficient include two-way sync between spreadsheets and connected systems, scheduled data refreshes, bulk updates, workflow automation, and AI tools for building dashboards, formulas, and insights. Coefficient ensures that spreadsheet reports always use live, accurate data pulled from CRMs, analytics tools, and databases.
Coefficient pricing ranges from $0 to custom enterprise plans. Free costs $0 for basic live data. Starter at $49 adds workflow automation. Pro at $99 per user adds larger data pulls and advanced automation. Enterprise offers custom pricing with volume discounts and extra security.
Pros of Coefficient include fast setup, live-data updates inside spreadsheets, and automation features that reduce manual work. Cons include limited visualization options compared to dedicated BI tools and reliance on spreadsheet charting for advanced dashboards.
31. Cyfe: Best Looker Studio Alternative for Small Business All-in-One Dashboards
Cyfe is an all-in-one dashboard platform that centralizes data from marketing, sales, finance, and analytics tools into a single, customizable view. Cyfe uses prebuilt widgets to pull KPIs from popular services and presents them in real-time dashboards for quick decision-making.

Cyfe delivers stronger value than Looker Studio for small businesses that need simple, unified dashboards without technical setup. Looker Studio provides deeper visualization capabilities inside the Google ecosystem, while Cyfe offers easier onboarding, broader plug-and-play integrations, and faster reporting for non-technical teams.
Core tools in Cyfe include customizable dashboards, real-time KPI monitoring, over 100 native integrations, branded layouts, and automated reporting. Cyfe combines data from platforms such as Google Analytics, Salesforce, Facebook, Twitter, and Shopify into a single interface with minimal configuration.
Cyfe pricing ranges from $29 to $119 per month. Starter at $29 includes 2 dashboards and 1 user. Standard at $39 offers 5 dashboards and 2 users. Pro at $65 provides 10 dashboards and 5 users. Premier at $119 includes 20 dashboards, unlimited users, and $5 per extra dashboard.
Pros of Cyfe include easy setup, strong data consolidation, affordable pricing, and quick access to small business KPIs. Cons include limited customization depth, constrained data blending, and integration limitations tied to third-party API restrictions.
Why do People Seek Alternatives to Looker Studio Tool?
People look for Looker Studio alternatives because some analytics needs deeper modeling, faster performance, and simpler interfaces. Looker Studio works well for basic dashboards, but businesses that scale into larger datasets often encounter slow reports, limited real-time analysis, and constraints around complex transformations.
Looker Studio performance varies when handling high-volume data or multi-source reporting. Some users report lag, broken connectors, or refresh delays, which are manageable for small teams but become a roadblock for agencies or enterprises that depend on reliable, always-on dashboards. This pushes teams toward tools with stronger query engines.
The Looker Studio interface is familiar to many Google users, yet beginners still struggle with setup, permissions, and blending data from multiple sources. Navigation across connectors, charts, and data models introduces a learning curve compared to platforms built for fast onboarding and guided workflows.
Looker Studio is free, but Looker (the enterprise version) adds significant expense, creating budget constraints for small and mid-sized teams. Its pricing and technical complexity lead many businesses to explore simpler, lower-cost alternatives.
Looker Studio remains a solid option for lightweight dashboards and marketing reports. However, limitations in scalability, real-time analytics, connector reliability, and the steep cost of enterprise Looker push many users to seek alternatives that deliver stronger performance without the operational overhead.
What to Look for in a Looker Studio Alternative?
The best Looker Studio alternatives provide stronger connectors, easier setup, faster dashboards, and more flexible reporting. Top platforms deliver real-time syncing, richer visualization options, and collaborative workspaces that scale across teams and data environments.
The 6 features to look for in a Looker Studio platform alternative are listed below.
- Extensive Data Connectors. Stronger platforms connect to Google Analytics, SQL databases, BigQuery, SaaS apps, and third-party marketing data without complex setup or custom coding.
- Flexible Dashboard Templates. Advanced systems offer drag-and-drop builders, heat maps, funnel charts, and customizable visual layouts that adapt to different reporting needs.
- Real-Time Syncing and Export Options. Tools that refresh data instantly and provide PDF, CSV, and Excel exports create smoother workflows and more reliable dashboards.
- Collaboration and Workspace Controls. Shared workspaces, permission settings, version history, and automated report sharing make it easier for teams to review and present insights.
- Performance and Scalability. Faster load times, multi-source blending, and efficient data handling ensure that dashboards remain stable as datasets and projects grow.
- White-Labeling and Custom Branding. Platforms that offer branded reports, custom domains, and tailored layouts provide a polished experience for agencies and client-facing teams.
What is the Difference Between Looker Studio vs Mode?
The difference between Looker Studio vs Mode is that Looker Studio is simpler and free, while Mode is deeper and more advanced.
The Looker Studio vs Mode comparison shows a clear divide. Looker Studio focuses on quick dashboards and easy visual reporting, which make it ideal for straightforward marketing or analytics needs. Its strength lies in accessibility and Google ecosystem integrations.
Mode takes a different approach. Mode blends visualization with powerful data exploration, SQL editing, Python notebooks, and advanced analysis. It appeals to teams that need deeper interrogation of data rather than simple dashboards.
Looker Studio and Mode cover important analytics tasks, but both limit flexibility, performance, or scale depending on the project. Search Atlas solves this by unifying dashboards, AI analytics, and automated insights inside one system that grows with any data environment.
What is the Difference Between Domo vs Looker Studio?
The difference between Domo vs Looker Studio is that Domo is broader and more enterprise-focused, while Looker Studio is lighter and easier to start with.
The Domo vs Looker Studio comparison highlights this gap. Looker Studio delivers fast dashboards, familiar templates, and straightforward reporting inside the Google ecosystem. It remains a strong fit for small businesses, marketers, and teams with basic visualization needs.
Domo offers a wider platform. Domo offers large-scale data integration, complex pipelines, governance, and mobile-first dashboards built for daily operational use. It excels in environments that require continuous data syncing and broad executive visibility.
Looker Studio and Domo both succeed in different segments, but each trades off depth or simplicity. Search Atlas bridges these gaps by delivering unified metrics, automated intelligence, and scalable reporting without enterprise overhead.
What is the Difference Between Looker Studio vs Thoughtspot?
The difference between Looker Studio vs ThoughtSpot is that Looker Studio focuses on basic dashboards, while ThoughtSpot specializes in search-driven analytics and AI insights.
The Looker Studio vs ThoughtSpot comparison shows distinct use cases. Looker Studio works well for simple charts and marketing reports, providing free access and a familiar interface for everyday dashboards.
ThoughtSpot operates at an enterprise level. ThoughtSpot uses AI and natural language queries to generate instant insights, which allow teams to “ask” a question and get answers immediately. It suits fast-paced organizations that depend on real-time discovery rather than fixed dashboards.
Looker Studio and ThoughtSpot play different roles, yet both face limits around automation, unified data visibility, and adaptability. Search Atlas addresses these challenges by combining real-time insight generation with automated reporting inside one integrated system.
Why is Search Atlas the Best Looker Studio Alternative?
Search Atlas is the best alternative to Looker Studio because it fits teams that need reliable connectors, automated reporting, and fully branded client dashboards. Unlike Looker Studio, which struggles with data refresh issues, fragile integrations, and limited white-label options, Search Atlas delivers real-time syncing and agency-ready reporting starting at $99 per month with no hidden add-on costs.
Search Atlas unifies all sources inside one environment. Traffic, conversions, local visibility, rankings, backlinks, and paid media performance flow into a single reporting system with instant updates and no technical setup.
Search Atlas includes an AI-powered Report Builder that compiles cross-channel metrics, generates summaries, and produces white-label dashboards automatically. Reports update in real time, highlight key movements, and schedule delivery to clients without manual effort.
For businesses replacing Looker Studio, Search Atlas provides cleaner design, stronger automation, and a fully branded reporting workspace without technical overhead.
See stronger visibility, smoother reporting, and faster insights. Try Search Atlas free for 7 days.


 Allan F.


